Trust is everything when choosing where to shop for groceries. But what does that trust come down to? It’s more than product quality or store layout. It’s the whole experience, from helpful staff to checkout speed to how valued customers feel. So, how do we measure all of that in a meaningful way? The answer is Net Promoter Score (NPS).
In this blog, we’re taking a closer look at Whole Foods Market’s NPS performance. You’ll see how the brand is doing in terms of customer satisfaction, how it compares to others in the grocery space, and what those numbers mean.
Before we dive into Whole Foods’ NPS, let’s start with the basics…
What does NPS mean?
Net Promoter Score (NPS) is one of the easiest ways to find out how loyal your customers really are. It’s a quick and straightforward metric that helps you understand whether people are happy with their experience and whether they would actually recommend you to others.
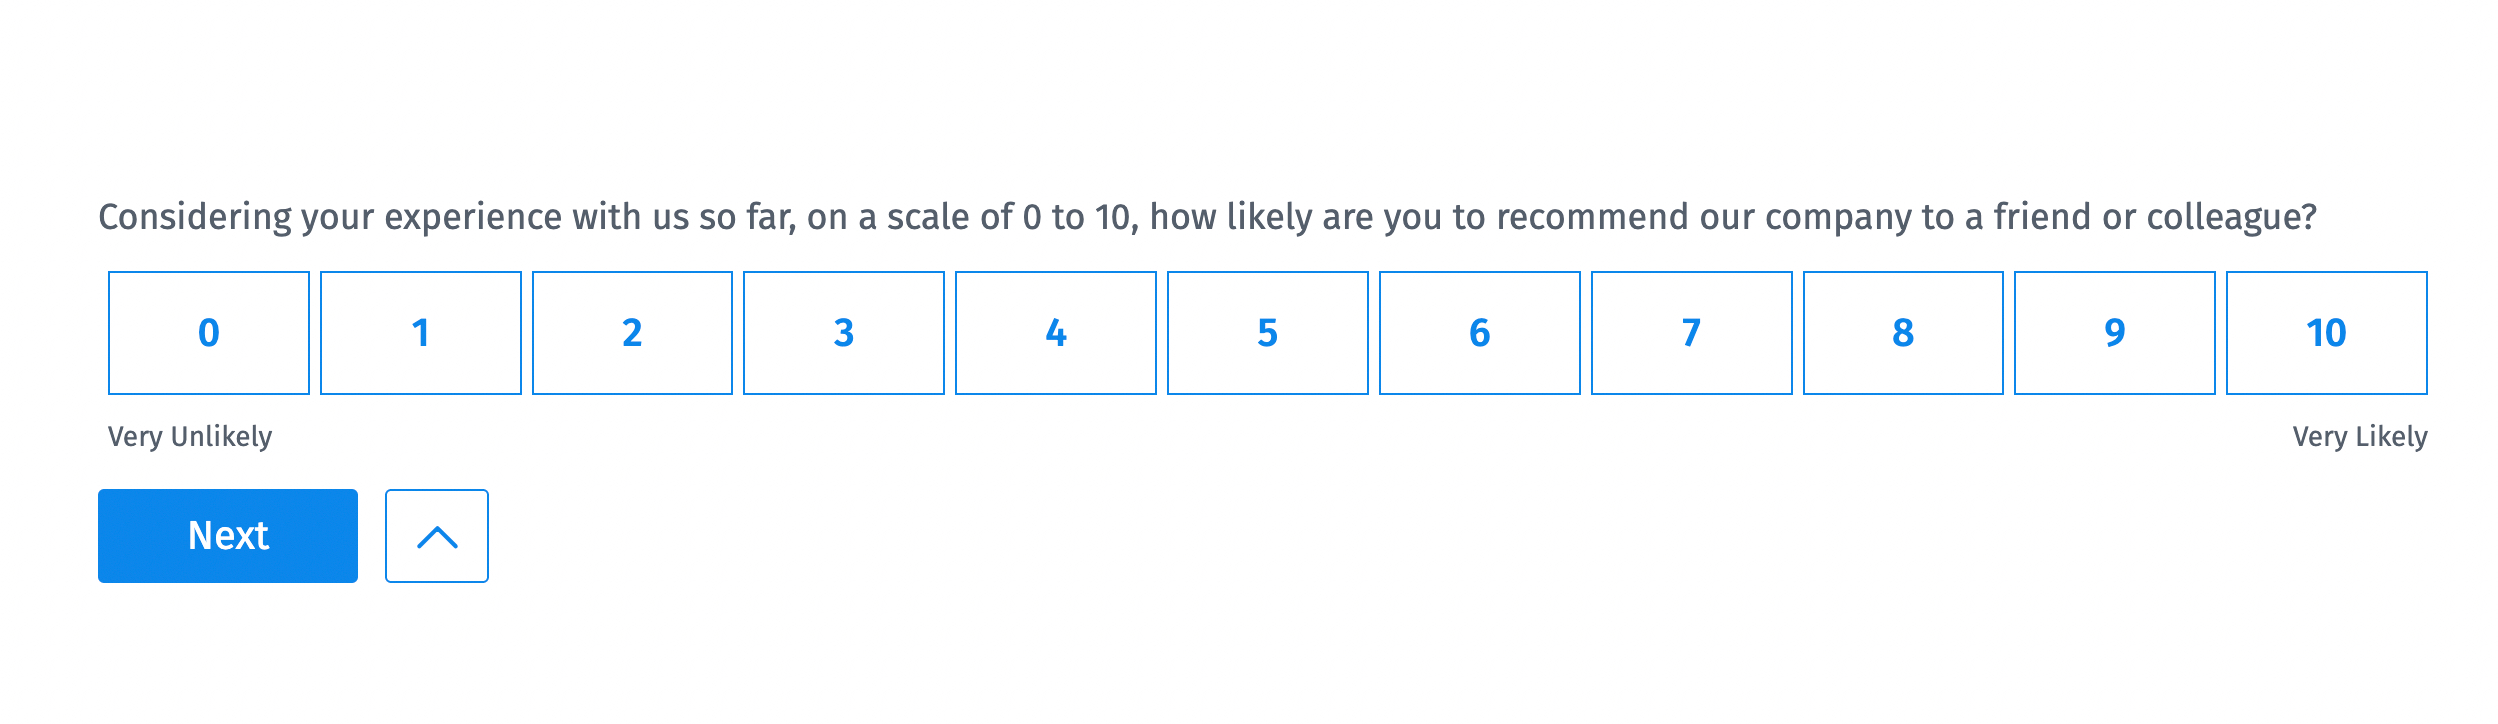
That’s why so many companies rely on it, especially in grocery stores. Now, you’re probably wondering, “Where does that score come from?” Well, the answer is simpler than you think. It all starts with a simple question applied to your customer base:
“On a scale of 0 to 10, how likely are you to recommend us to a friend or colleague?”
Based on how people respond, they fall into three groups:
- Promoters (9–10): These are your fans. They love what you do and aren’t shy about telling others.
- Passives (7–8): They’re fine with your service but not overly excited, and they might switch if a better option comes along.
- Detractors (0–6): These folks are unhappy and may be spreading the word incorrectly.
To figure out your score, you subtract the percentage of Detractors from the percentage of Promoters:
NPS = % of Promoters – % of Detractors
A high score usually means your customers are happy and loyal – great job! A low one is a warning sign that something might be off in the experience you’re delivering.
But here’s the thing—your number doesn’t mean much in isolation. That’s where benchmarking helps. Comparing your NPS with others in your industry can show you where you’re winning and where there’s room to grow.
Whole Foods Market NPS Performance
Whole Foods Market’s NPS in 2025 is 35, indicating a moderate level of customer loyalty within the grocery sector and placing it below the industry average.
Here’s the breakdown behind their NPS score:
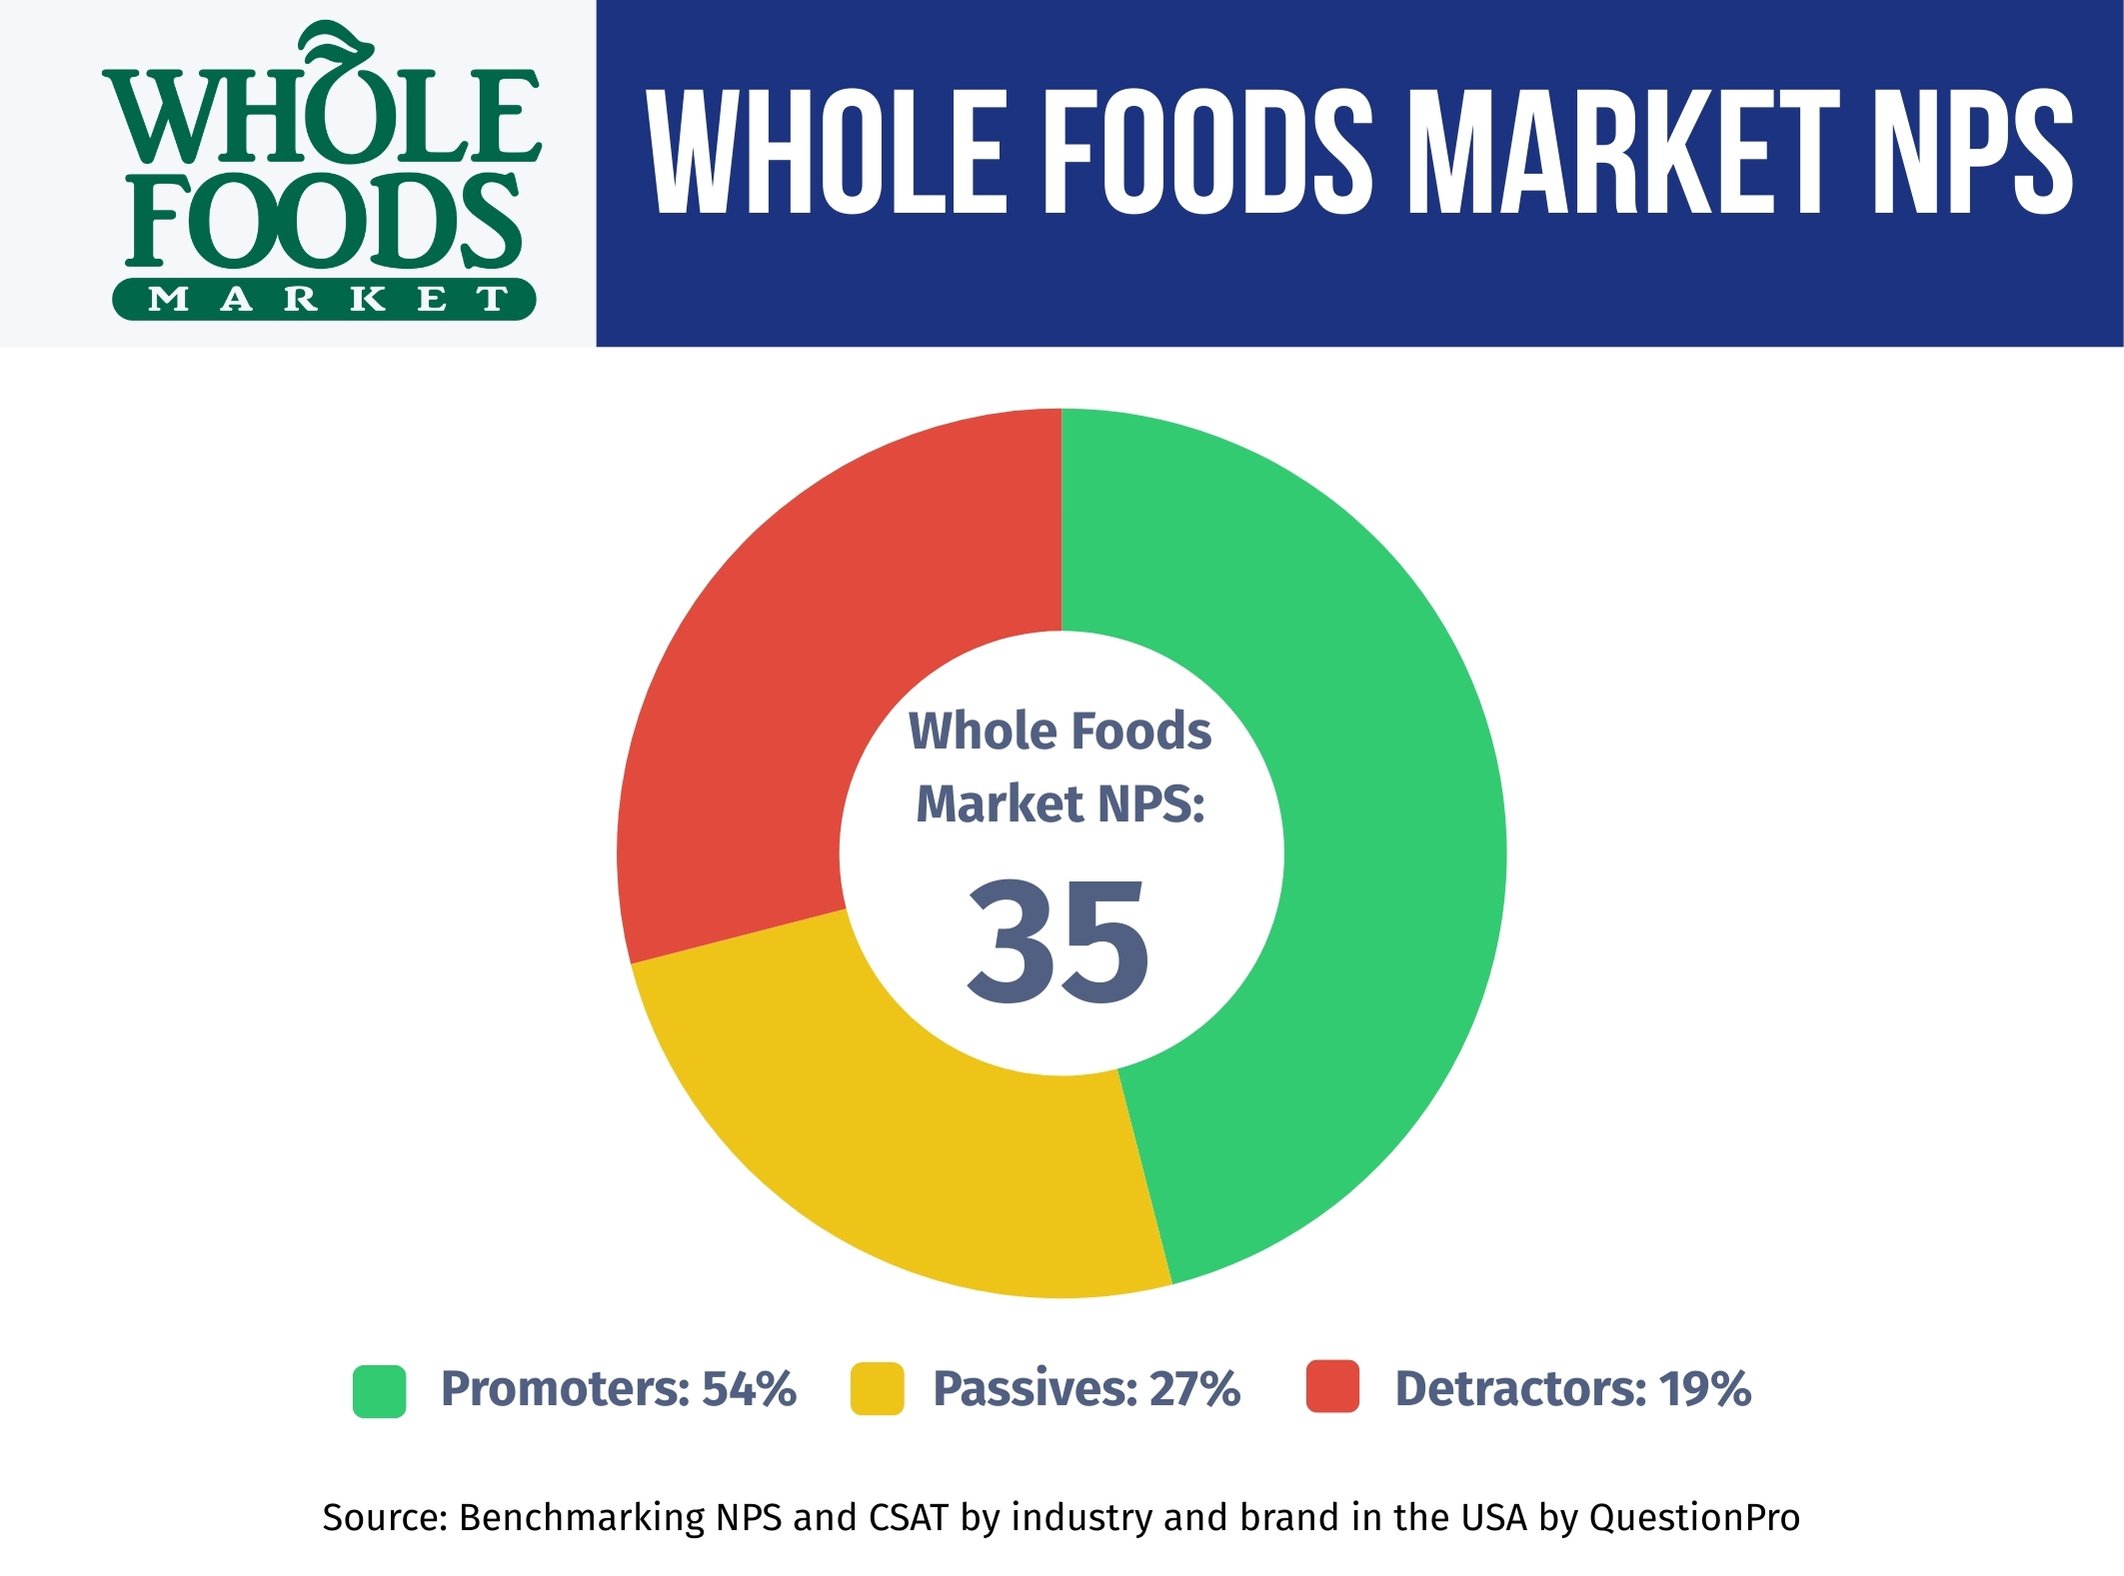
- Promoters: 54%
- Passives: 27%
- Detractors: 19%
NPS = % Promoters (54%) – % Detractors (19%) = 35
Compared to the grocery industry average of 37, as reported in “QuestionPro’s Q1 2025 Benchmarking NPS and CSAT Report”, Whole Foods Market is just slightly below the benchmark. While more than half of its customers are enthusiastic enough to recommend the brand, the relatively high percentage of detractors shows there’s room for improvement.
Whole Foods’ close-to-average score suggests a customer base that appreciates its offerings but may also be sensitive to pricing, store experience, or other factors that influence brand loyalty. Reducing detractor sentiment while growing promoter enthusiasm could be the key to pushing Whole Foods closer to the top performers in the industry.
How does Whole Foods Market compare to Grocery Industry Benchmarks?
Whole Foods Market has an NPS of 35. This score seems low. Still, let’s compare it with the 37 points that indicate the national average for their industry. We can see that while it is not an indicator of excellent performance, they are not far from surpassing the average.
This NPS Benchmark is possible to obtain thanks to the work that companies like QuestionPro do to generate studies that evaluate consumers from different industries. For this article, we used QuestionPro’s Q1 2025 Benchmarking NPS and CSAT Report as a reference.
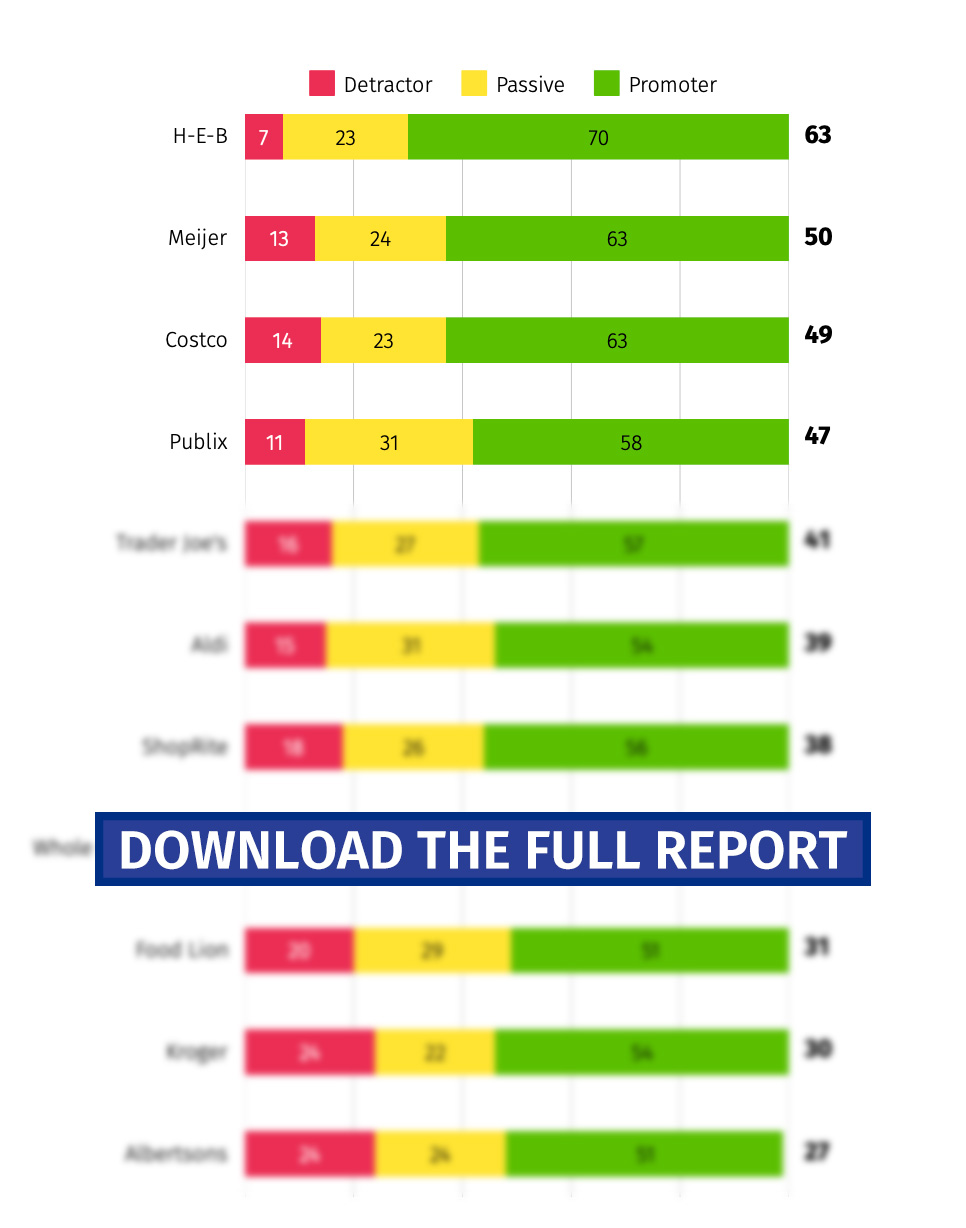
Unlike top-performing grocery brands that consistently exceed the benchmark, Whole Foods sees a more mixed response from its customer base. Factors like pricing, store accessibility, or perceived value may influence this middling score.
These insights are pulled from QuestionPro’s latest study, which surveyed 1,000 participants to track NPS performance across various grocery retailers. The report is based on honest customer feedback from Q1 2025 and is updated quarterly.
What’s Behind Whole Foods Market’s Customer Loyalty?
Whole Foods Market has earned an NPS of 35, putting it just slightly below the grocery industry average of 37, according to QuestionPro’s Q1 2025 Benchmarking NPS and CSAT Report. While more than half of its customers (54%) are Promoters, a notable 19% fall into the Detractor category, indicating room for improvement.
Several factors contribute to Whole Foods Market’s current NPS:
- Recognition at the brand level is strong, with Whole Foods ranked among the top five retail brands.
- Whole Foods has a 77% future purchase intent, indicating that factors beyond immediate satisfaction suggest that most shoppers still feel a strong connection to the brand.
- Demographic differences matter. Female customers rated Whole Foods higher than male customers, and younger shoppers (ages 18–25) gave the highest loyalty scores, while the 66+ age group gave the lowest ratings.
- Customer satisfaction (CSAT) scores 74 out of 100, indicating moderate contentment with the overall experience.
- Among key competitors, Whole Foods is performing very well in customer satisfaction score, trailing only Trader Joe’s and Costco, which highlights an opportunity to strengthen loyalty drivers.
The data points to a respected brand performing reasonably well but with untapped potential. With a more focused effort on reducing detractor feedback and fine-tuning the customer experience, Whole Foods could move closer to the top of its category.
What Your Brand Can Learn from Whole Food Market?
Whole Foods Market shows that even well-established brands with strong reputations can experience a wide range of customer sentiment. Its NPS of 35 reflects solid brand recognition and a loyal core audience, but also highlights the importance of listening closely to detractors and passives.
Here’s what other brands can take away:
- Know your audience: Younger and female customers rate Whole Foods more favorably. Understanding who your strongest promoters are can help you double down on what’s working.
- Watch for warning signs: A significant percentage of detractors suggest friction in parts of the experience, such as price sensitivity, service inconsistency, or product availability.
- Benchmark often: Whole Foods performs well in the retail category, but lags behind competitors like Trader Joe’s. Comparing your NPS with others in your space helps reveal your competitive position.
- Balance satisfaction and loyalty: A CSAT score of 74% suggests there’s room to boost not just loyalty, but everyday satisfaction. One influences the other.
The key takeaway? Even brands with a passionate following must continually invest in listening, improving, and adapting. Your NPS isn’t just a number, and it reflects how well your brand is meeting customer expectations in real time.
How to Measure and Improve Your NPS?
Measuring and improving your Net Promoter Score doesn’t have to be complicated. With the right tools like QuestionPro, you can turn customer feedback into real action. Here’s how to get started:
- Create Your NPS Survey
Start with the classic NPS question – “On a scale of 0 to 10, how likely are you to recommend our company to a friend or colleague?”
Pro Tips: To understand why someone gave a specific score, add an open-ended AskWhy follow-up question. QuestionPro’s ready-to-use NPS template makes this easy to set up in just a few clicks.
- Share Your Survey
Distribute your survey through channels your customers already use:
Pro Tips: If you need to reach a more specific audience, QuestionPro Audience lets you target by demographics, location, and industry.
- Analyze Feedback in Real Time: QuestionPro automatically calculates your score as responses roll in and categorizes respondents into Promoters, Passives, or Detractors. The live dashboard helps you quickly spot trends and problem areas without waiting for a manual report.
- Act on What You Learn: Your NPS results are only valuable if you use them. Focus on improving touchpoints where detractors are most vocal and reinforcing what your promoters already love. The insights can drive meaningful improvements from customer service tweaks to product updates.
- Benchmark Against the Industry: Use QuestionPro’s benchmarking tools to see how your NPS compares to others in your space. Whether you’re aiming to catch up or maintain a lead, knowing where you stand gives you the context to make smarter decisions.
With tools like QuestionPro, measuring and improving NPS becomes part of an ongoing customer experience strategy, not just a one-time task.
Stay Informed with the Latest NPS Trends
Curious how your customer loyalty stacks up against others in your industry? The Q1 2025 NPS Benchmark Report is your go-to resource for understanding how top brands build trust and long-term loyalty.
See how retail, grocery, finance, and more companies are performing, and get the insights you need to improve your strategy.
Need help improving your NPS? Contact the QuestionPro experts for custom tips on improving customer satisfaction.
Let’s talk about how we can help.
Whole Foods Market isn’t the only company in its industry with valuable lessons for those looking to improve their customer service and experience. Below, we recommend a few articles where you can learn how other major brands manage to maintain a high NPS and a loyal customer base — you’ll surely find some useful insights along the way.