In a recent conversation, we were discussing what it means to reach the end of a year. Growing up, most of my events revolved around a calendar that started in August and ended on Memorial Day weekend which signaled the end of the school year. The end of the school year was filled with a variety of things that reminded us of the time of year. There were certainly the warm feelings of spring, perhaps a few skipped days and the measurement of success in final exams. Year after year, we could come to expect certain things and also marvel in what we had accomplished.
All these years later, I still have that August to May calendar in my head – after all, I still have two kids finishing up university. Over thirty years later though, the traditional calendar – which matches up against our fiscal calendar, takes priority. Some of these things remain the same. I tend to work the holiday weeks at the end of the calendar year because it allows me to catch up a little bit and help close out the year – but I’ll still take a few days off. One thing I always like to do is reflect on the year and see what progress has been made. My own version of final exams – written by me, taken by me and graded by me.
Here’s a recap of the most important highlights from this year, with the promise that the upcoming year will be even better, featuring new and improved functionalities!
Reporting Updates
Heatmap Widget Enhancements
The existing Heatmap widget has been updated with multiple new options to cater to multiple user requirements. Users now will be able to add questions and segments in rows or columns based on their individual requirements. Further, the Heatmap widget now supports additional scoring models such as Mean, and Custom Metrics. Users can now add multiple custom metrics to the heatmap enhancing their analysis capabilities. To support frontline reporting, we have added a new option Allow managers to view data for parent segment under the widget sharing settings of the Heatmap widget. When turned on, portal managers (child segments) will be able to see data for their immediate parent if any such columns/rows are present in the Heatmap shared with them in the configuration.
Comment List Widget Enhancements
We have enhanced the comment list widget to support the addition of up to seven variables to display along with the comment. These variables can include fields such as phone numbers, email addresses, or any transactional custom variables that are shown against the response IDs in the widget. We have also added an option to exclude as a scoring model in the widget which enables users to hide the color indicators and scores columns in the widget. Using the None scoring model this widget can be used for open-ended questions as well, eliminating the dependency on NPS or other KPI questions.
KPI Comparison Widget
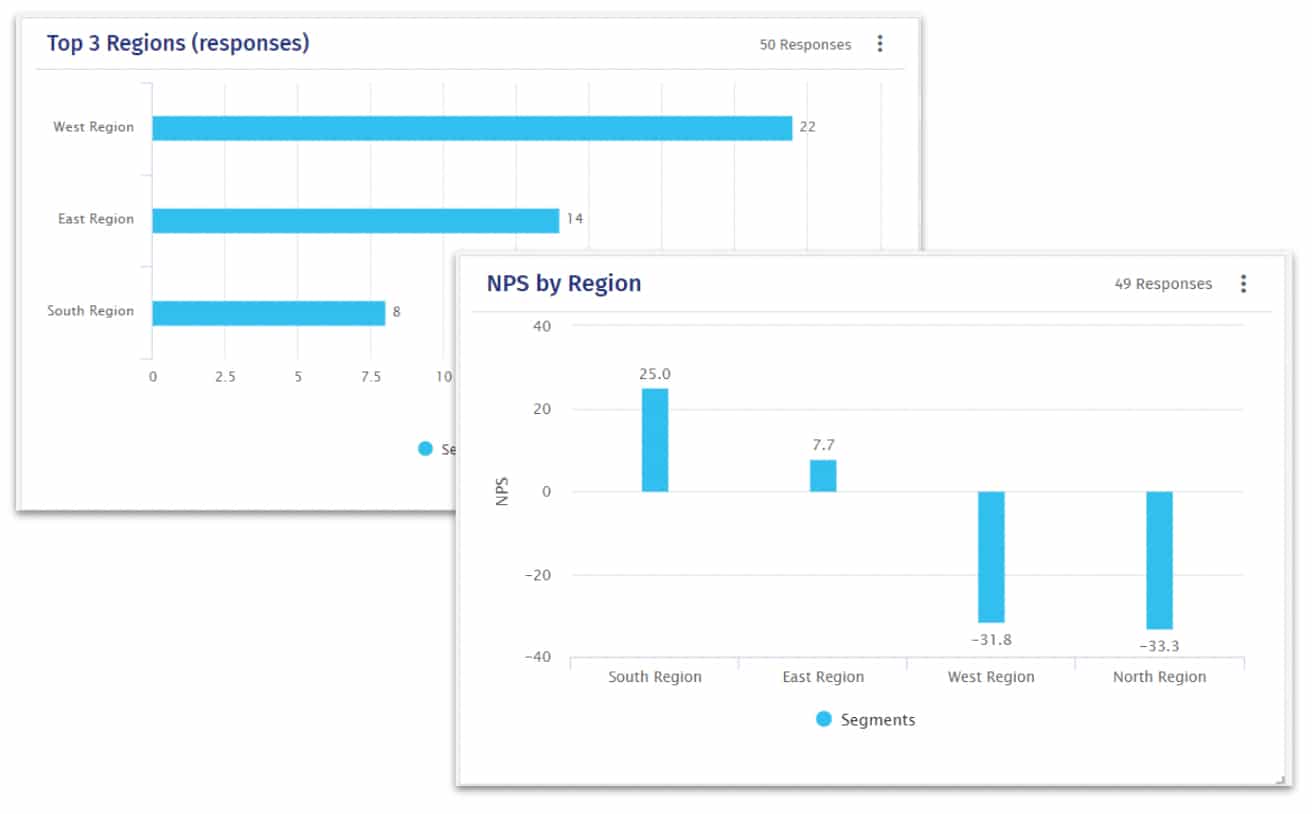
The KPI comparison widget can be used to compare the different KPIs such as NPS, CSAT, count between segments, closed ended question answer options, and products. A chart for Top/bottom ‘N’ can also be plotted using this widget. This widget also has advanced sharing options for sharing it among the organizational hierarchy with control over the data points to be made accessible.
Restricted access to portal managers
With this feature, account admins will be able to restrict specific data fields as a part of the dashboard settings. For instance, data fields such as email addresses, phone numbers, and others can be set as restricted by the admins so when such dashboards are shared with the managers they will not be able to view/access these data fields. In the file downloads by the portal managers, these fields will be shown as Hidden. This is expected to give more flexibility and control to CX admins while sharing dashboards with their portal managers.
Deployment Updates
Survey Tokens (Anonymous Tokens) Revamp – We have restructured the survey tokens functionality in the CX. We added the ability to add anonymous tokens in bulk to the platform through Excel upload. Further, users can also download all the anonymous tokens present in the system in the Excel file. This Excel file will include token URLs for all the present tokens.
We have also enhanced the survey tokens with the support for including up to five pre-defined custom variables along with a product variable that users can use while creating/adding survey tokens to the system to allow for use with survey logic or reporting classifications without the need for extra questions. Finally, users now have the option to utilize respondents’ email addresses in other CX features, including reporting and ticketing when the data is collected as a part of an anonymous token, which gives the managers the ability to better take action.
CSV Support in Export Email Report (Scheduler) – Support for CSV format has been added to the Export Email Report option. Now users can choose and set the report format between Excel and CSV for greater flexibility in processing data into various systems beyond our API calls for such transfers.
Enhanced Closed Loop Feedback
Closed-loop Winback Survey – The purpose of closed-loop feedback ticketing is to respond to a customer’s needs. Sometimes the pressure to close open tickets results in tickets being marked as resolved to meet performance metrics of ticket resolution time or reduce the number of overall open tickets – sometimes without the customer ever being contacted.
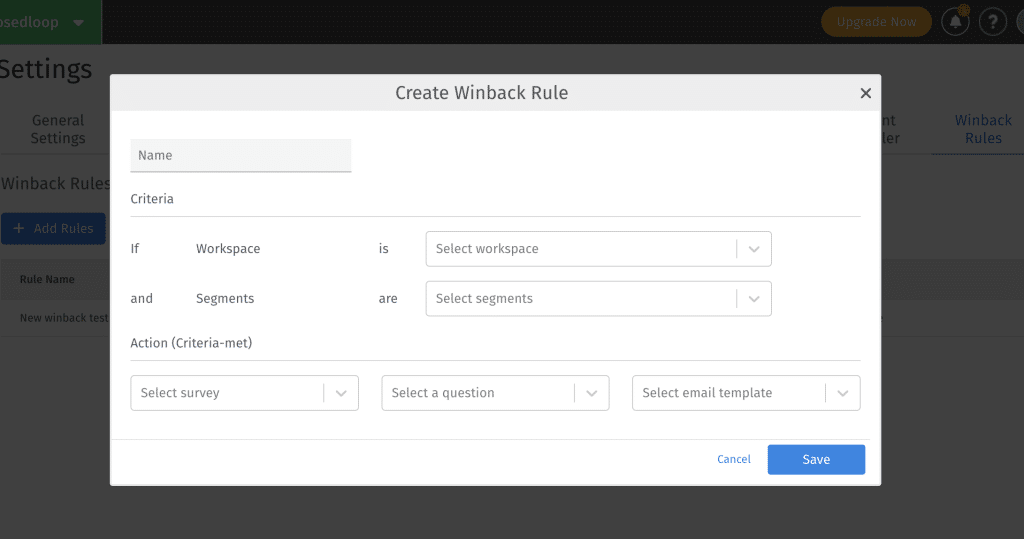
The Winback Survey feature allows for an automated survey to the customer once their ticket has been marked as resolved. This survey will allow the admin to understand if the customer is happy with the ticket resolution process and the solution provided by the agent. Winback survey allows users to send a new survey once the ticket is resolved and captures the updated NPS score. Combined with Root Cause analysis, this feature will help you understand how many of your customers are converted from Detractors to Promoters based on actions taken.
Enhanced CX Assignments – We’ve enhanced CX notifications to improve user experience. You can now set up notifications for a single CX segment with multiple managers more easily. Additionally, our new update allows users to configure notifications for multiple segments simultaneously, eliminating the need to set up separate notifications for each one.
Historical Data Closed-loop Notifications – In September, we added support for notifications for data (responses) imported via Excel and API. You can now enable notifications for historical responses as you import them into the CX platform. Whenever you import responses, whether through the API or an Excel file, the system will automatically check for any enabled notifications and take the appropriate notification actions based on your settings.
Ticket Status Notifications – With this new and improved notifications setup, users can create custom notifications for most actions that can be taken on their tickets. These notifications can be sent to the Admin or the Manager added in your CX Workspace. Alerts can be set for various actions like ticket creation, ticket deletion, comments added by other users. All the notifications are workspace specific.
With all that, we would already have a great year in our product development. In addition to these items, we enhanced our Customer Experience platform with two big changes: AskWhy question type and our Journey Management Software.
Our AskWhy question type (formerly NPS+) is an update to our prior version which focused on the NPS and survey level Root Causes. Now, Root Causes can be created at a CX Workspace level. These Root Causes can be added through a simple input tool that allows for three levels of analytics. When building the AskWhy question type for a specific touchpoint survey, there is the option to use all or just a subset of the available Root Causes. Building out a set of Root Causes across an entire CX Workspace will have far-reaching implications.
While we have always had the option to show an NPS score across the entire CX Workspace from any set of questions, the Root Cause analysis was limited to each touchpoint survey since the Root Causes were built within that survey. With the centralized Root Cause tools, we will soon have the ability to conduct Root Cause analytics across the entire CX Workspace where the AskWhy question type is included.

We will build this out further by leveraging these centralized Root Causes when analyzing closed-loop tickets, creating outer loop backlogs and analyzing success from both outerloop initiatives and in Journey Management action tracking.
Speaking of Journey Management, it was in the middle of 2024 that we made the switch from the legacy SuiteCX software to the QuestionPro Journey Management software. With so many significant improvements in the design, the features and functionality, we are proud of the results from this conversion.
We have taken an award winning software and integrated it into our suite of customer experience tools and upgraded many of the features. In addition to great features such as including multi-media in touchpoint views, the ability to add notes to every cell, and linking maps to other maps, we have also added functionality that provides live scoring updates from QuestionPro CX surveys to the touchpoints within the map. Further updates will include incorporating data from other survey platforms so you can manage the entire customer journey – or all the journeys – from a central place. With so many updates, I could dedicate an entire post just to that, perhaps we’ll do that next week.
Awards & Recognition 🏆
We have built out tools so CX practitioners can Understand Journeys and Take Actions, this is our core philosophy at QuestionPro CX. We are proud of the products we have put together and recognize the support it is bringing our clients. We are also quite proud of the accolades coming from independent analysts that look at all the solutions that support the customer experience practice. It can be challenging just to be included in most of these analyst reports as some do not want emerging tools that are innovative and would prefer to see the established players as the index for inclusion and assessing them based on their size instead of how they are changing the industry.
However, this year QuestionPro CX had the honor of being classified as a Leader in two Customer Experience reports published by Quadrant Knowledge Solutions: Voice-of-the-Customer software and Journey Management software. I have long noted that we are the only CX software that has full-featured communities built into our platform, but now we are also the only Customer Experience software that is considered a Leader in both categories. You can also read more about these accolades here.
Reflecting on 2024, I will always wish that we had done more. However, with all that we accomplished, we are proud of what we produced towards the goal of helping our customers Understand Journeys and Taking Actions.
Looking forward to a great 2025. Happy New Year!


