Are you curious about digging into data but not sure where to start? Don’t worry; we’ve got you covered! As a data scientist, you know that having the right tools can make all the difference in the world. When it comes to analyzing quantitative data, having the right quantitative data analysis software can help you extract insights faster and more efficiently.
From spotting trends to making smart decisions, quantitative analysis helps us unlock the secrets hidden within our data and chart a course for success.
In this blog post, we’ll introduce you to 10 quantitative data analysis software that every data scientist should know about.
What is Quantitative Data Analysis?
Quantitative data analysis refers to the process of systematically examining numerical data to uncover patterns, trends, relationships, and insights.
Unlike analyzing qualitative data, which deals with non-numeric data like text or images, quantitative research focuses on data that can be quantified, measured, and analyzed using statistical techniques.
What is Quantitative Data Analysis Software?
Quantitative data analysis software refers to specialized computer programs or tools designed to assist researchers, analysts, and professionals in analyzing numerical data.
These software applications are tailored to handle quantitative data, which consists of measurable quantities, counts, or numerical values. Quantitative data analysis software provides a range of features and functionalities to manage, analyze, visualize, and interpret numerical data effectively.
Key features commonly found in quantitative data analysis software include:
- Data Import and Management: Capability to import data from various sources such as spreadsheets, databases, text files, or online repositories.
- Descriptive Statistics: Tools for computing basic descriptive statistics such as measures of central tendency (e.g., mean, median, mode) and measures of dispersion (e.g., standard deviation, variance).
- Data Visualization: Functionality to create visual representations of data through charts, graphs, histograms, scatter plots, or heatmaps.
- Statistical Analysis: Support for conducting a wide range of statistical tests and analyses to explore relationships, test hypotheses, make predictions, or infer population characteristics from sample data.
- Advanced Analytics: Advanced analytical techniques for more complex data exploration and modeling, such as cluster analysis, principal component analysis (PCA), time series analysis, survival analysis, and structural equation modeling (SEM).
- Automation: Features for automating analysis workflows, scripting repetitive tasks, and ensuring the reproducibility of results.
- Collaboration: Tools for generating customizable reports, summaries, or presentations to communicate analysis results effectively to stakeholders.
Benefits of Quantitative Data Analysis
Quantitative data analysis offers numerous benefits across various fields and disciplines. Here are some of the key advantages:
Making Confident Decisions
Quantitative data analysis provides solid, evidence-based insights that support decision-making. By relying on data rather than intuition, you can reduce the risk of making incorrect decisions. This not only increases confidence in your choices but also fosters buy-in from stakeholders and team members.
Cost Reduction
Analyzing quantitative data helps identify areas where costs can be reduced or optimized. For instance, if certain marketing campaigns yield lower-than-average results, reallocating resources to more effective channels can lead to cost savings and improved ROI.
Personalizing User Experience
Quantitative analysis allows for the mapping of customer journeys and the identification of preferences and behaviors. By understanding these patterns, businesses can tailor their offerings, content, and communication to specific user segments, leading to enhanced user satisfaction and engagement.
Improving User Satisfaction and Delight
Quantitative data analysis highlights areas of success and areas for improvement in products or services. For instance, if a webpage shows high engagement but low conversion rates, further investigation can uncover user pain points or friction in the conversion process. Addressing these issues can lead to improved user satisfaction and increased conversion rates.
Best 10 Quantitative Data Analysis Software
Choosing the right quantitative data analysis software can significantly impact the efficiency and accuracy of your research or analysis. Here, we explore the top 10 quantitative data analysis software options available today.
1. QuestionPro
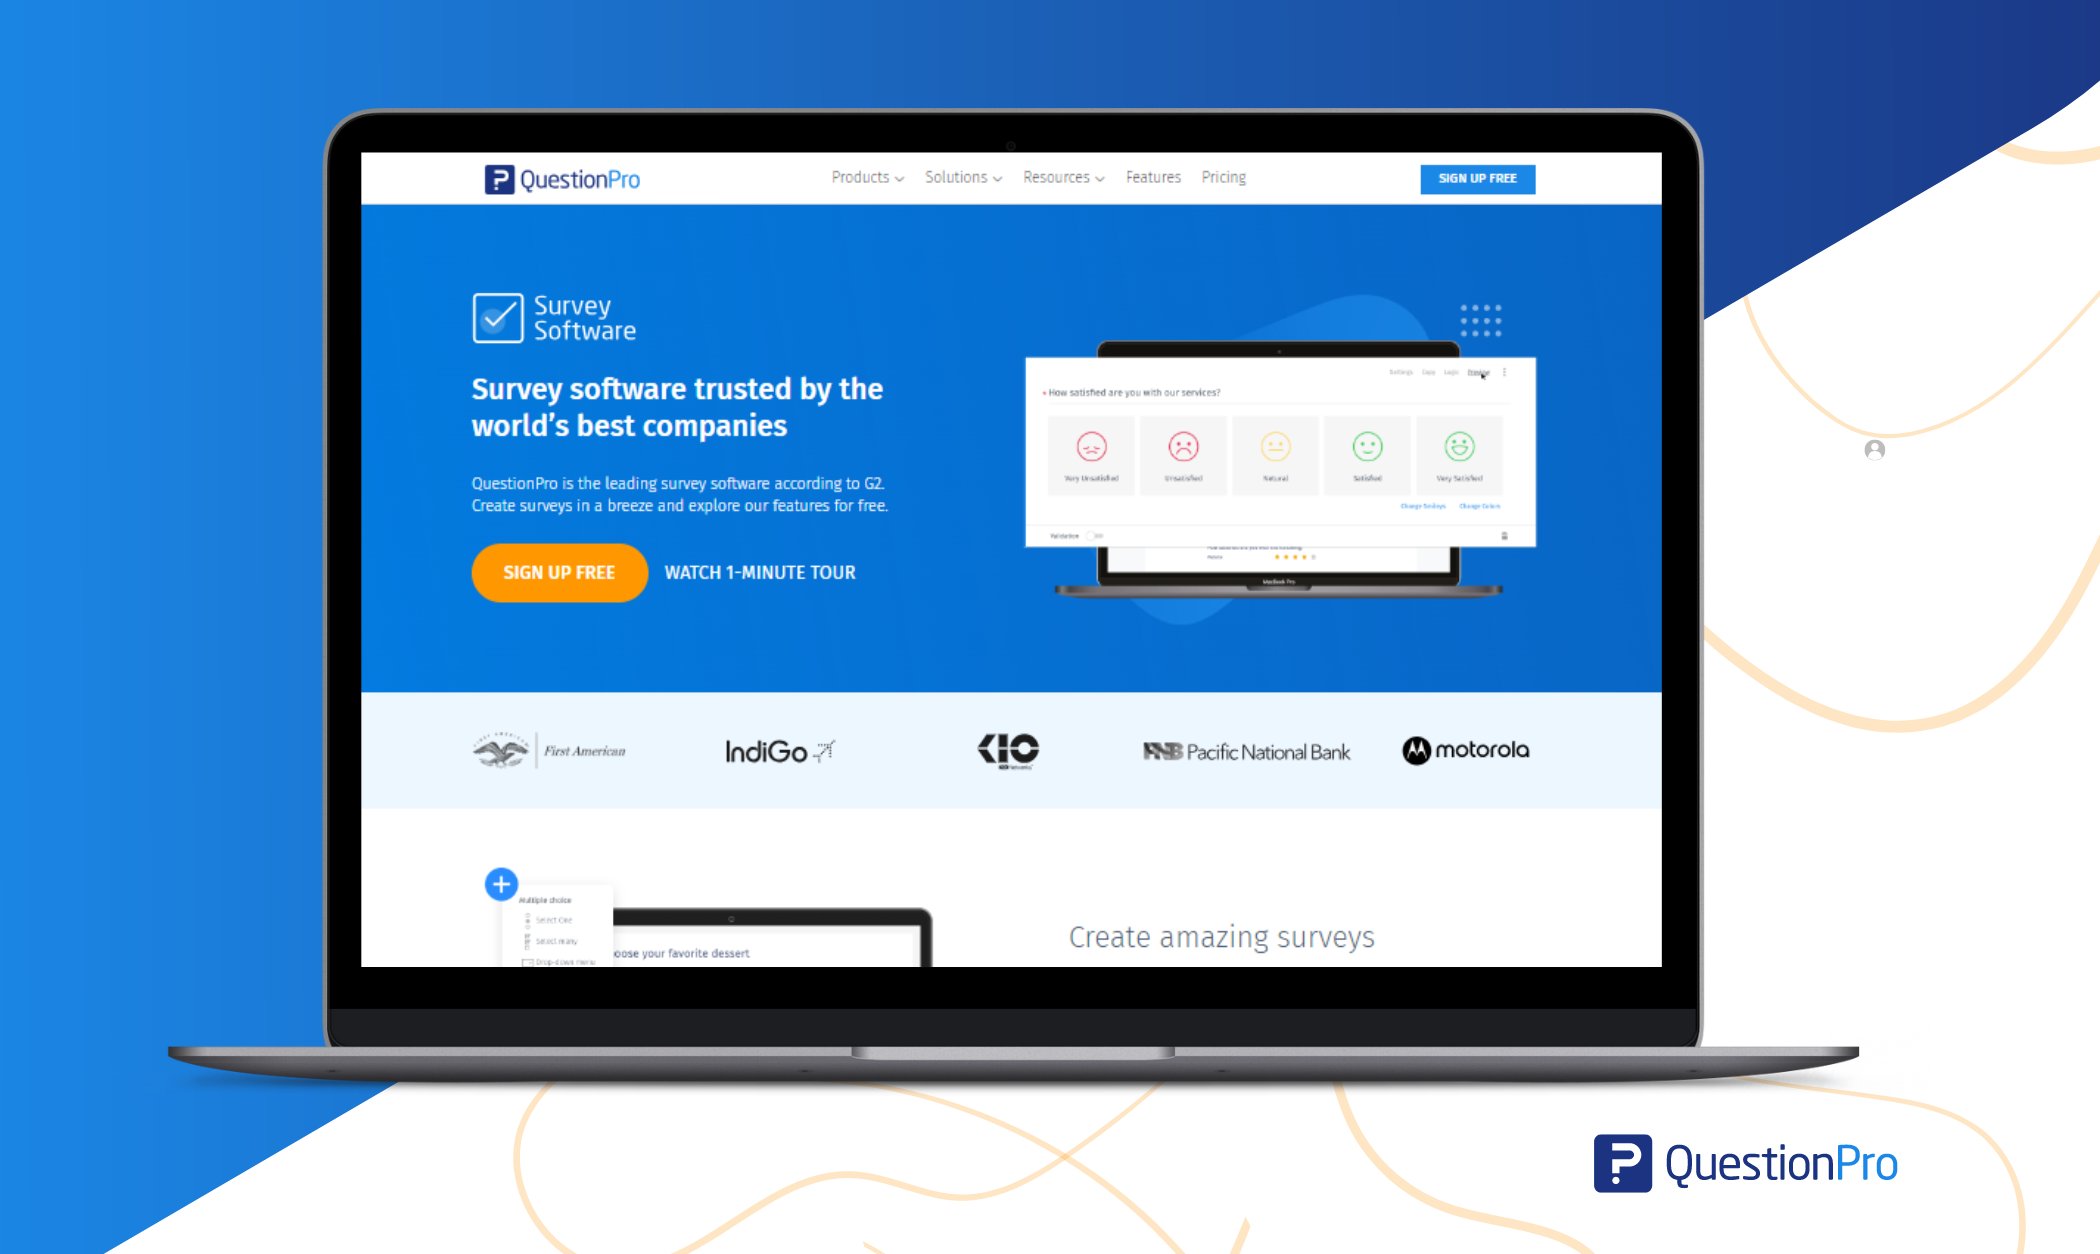
Known for its robust survey and research capabilities, QuestionPro is a versatile platform that offers powerful data analysis tools tailored for market research, customer feedback, and academic studies. With features like advanced survey logic, data segmentation, and customizable reports, QuestionPro empowers users to derive actionable insights from their quantitative data.
Features of QuestionPro
- Customizable Surveys
- Advanced Question Types:
- Survey Logic and Branching
- Data Segmentation
- Real-Time Reporting
- Mobile Optimization
- Integration Options
- Multi-Language Support
- Data Export
Pros:
- User-friendly interface.
- Extensive question types.
- Seamless data export capabilities.
Cons:
- Limited free version.
Pricing:
Starts at $99 per month per user.
2. SPSS (Statistical Package for the Social Sciences)
SPSS is a venerable software package widely used in the social sciences for statistical analysis. Its intuitive interface and comprehensive range of statistical techniques make it a favorite among researchers and analysts for hypothesis testing, regression analysis, and data visualization tasks.
Features:
- Advanced statistical analysis capabilities.
- Data management and manipulation tools.
- Customizable graphs and charts.
- Syntax-based programming for automation.
Pros:
- Extensive statistical procedures.
- Flexible data handling.
- Integration with other statistical software package
Cons:
- High cost for the full version.
- Steep learning curve for beginners.
Pricing:
- Starts at $99 per month.
3. Google Analytics
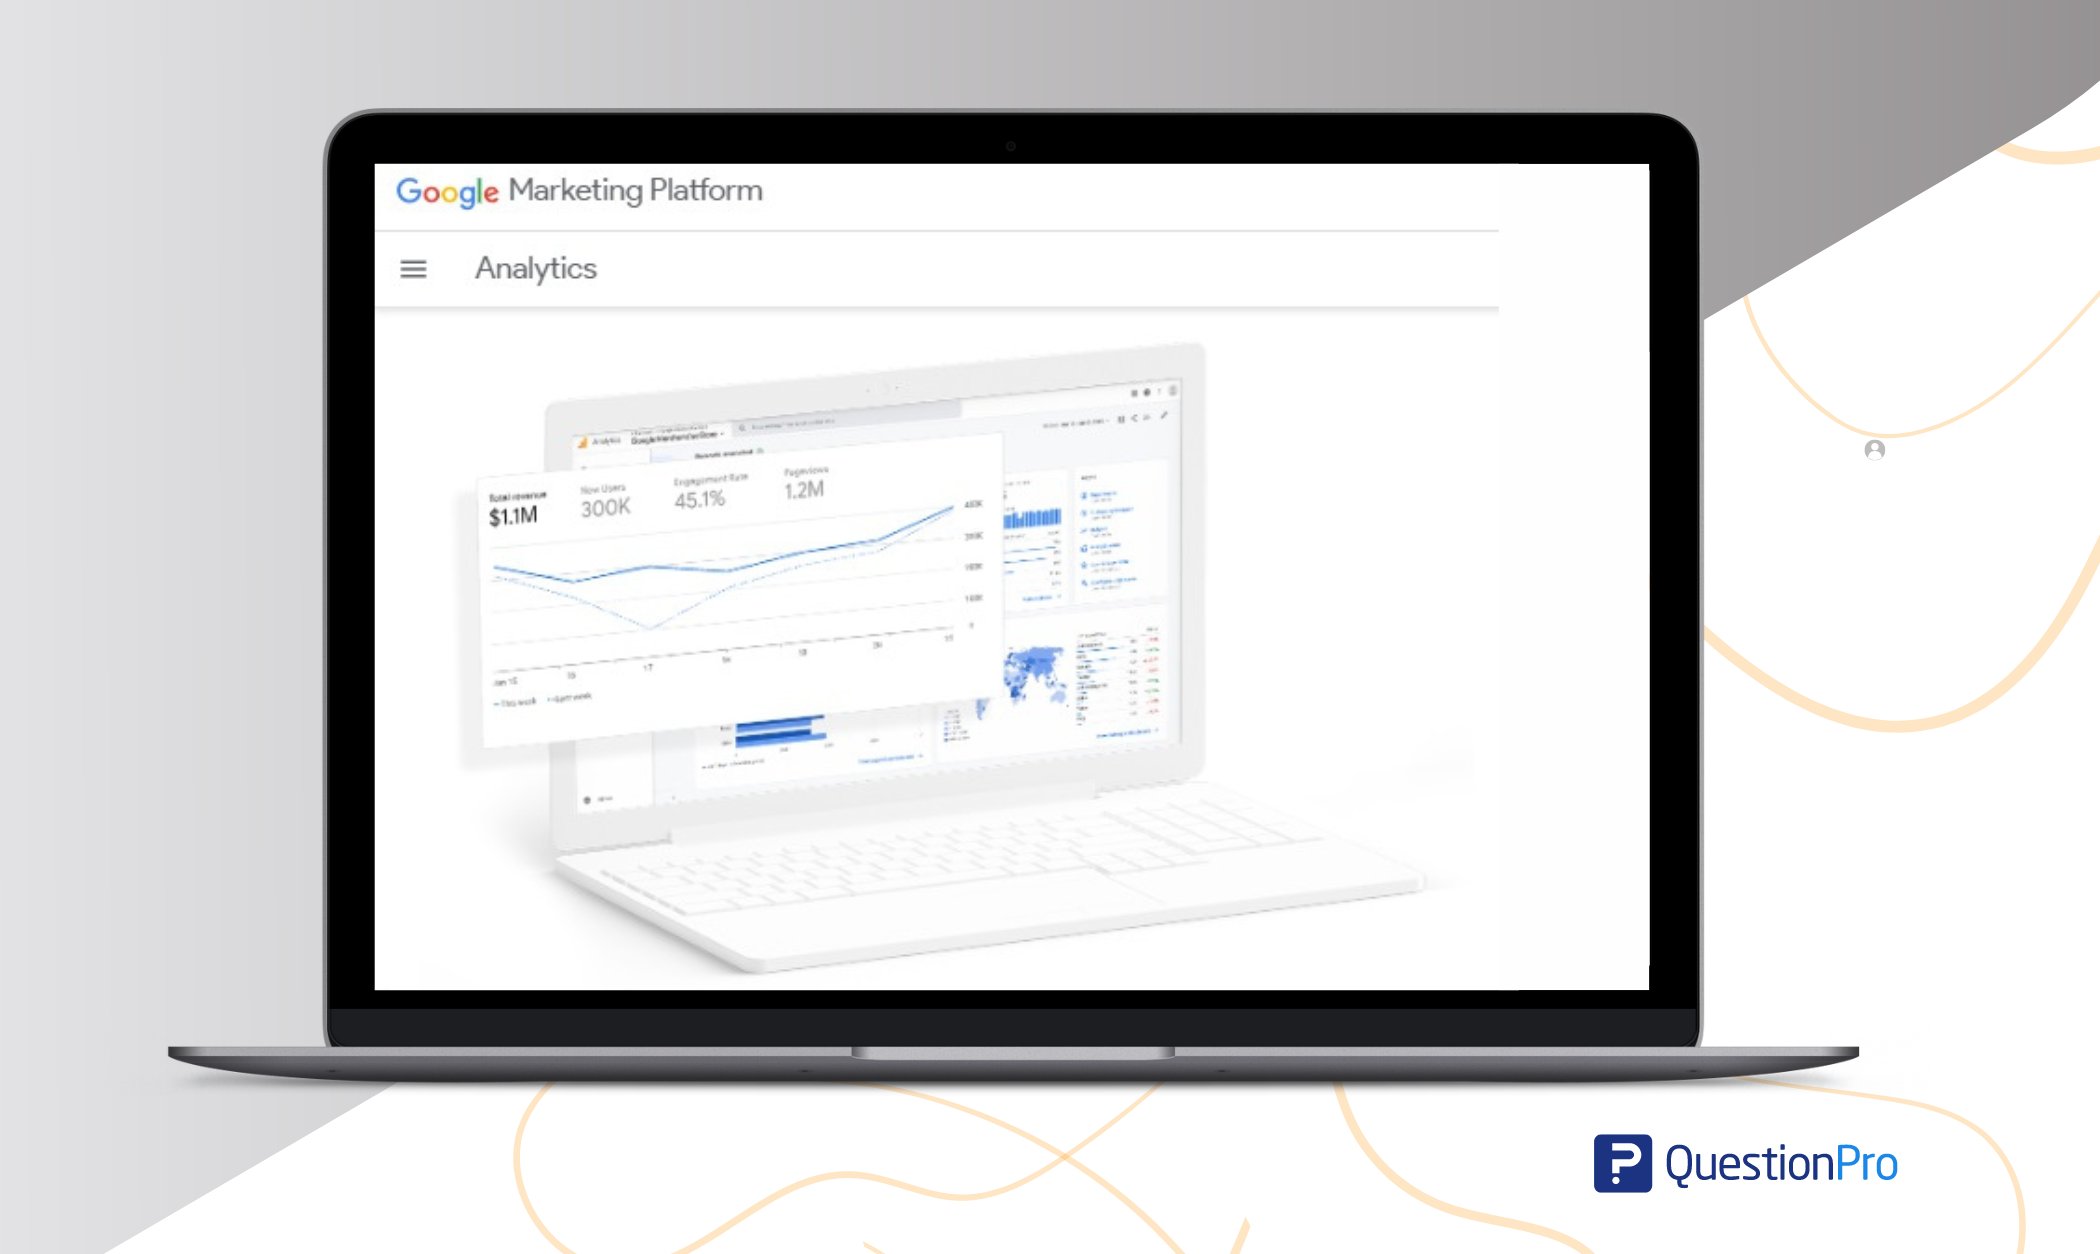
Primarily used for web analytics, Google Analytics provides invaluable insights into website traffic, user behavior, and conversion metrics. By tracking key performance indicators such as page views, bounce rates, and traffic sources, Google Analytics helps businesses optimize their online presence and maximize their digital marketing efforts.
Features:
- Real-time tracking of website visitors.
- Conversion tracking and goal setting.
- Customizable reports and dashboards.
- Integration with Google Ads and other Google products.
Pros:
- Free version available.
- Easy to set up and use.
- Comprehensive insights into website performance.
Cons:
- Limited customization options in the free version.
Pricing:
- Free for basic features.
4. Python
While not a dedicated data analysis software, Python is a versatile programming language widely used for data analysis, machine learning, and scientific computing. With libraries such as NumPy, pandas, and matplotlib, Python provides a comprehensive ecosystem for data manipulation, visualization, and statistical analysis, making it a favorite among data scientists and analysts.
Features:
- The rich ecosystem of data analysis libraries.
- Flexible and scalable for large datasets.
- Integration with other tools and platforms.
- Open-source with a supportive community.
Pros:
- Free and open-source.
- High performance and scalability.
- Great for automation and customization.
Cons:
- Requires programming knowledge.
Pricing:
- It is Free for the beginners.
5. SAS (Statistical Analysis System)
SAS is a comprehensive software suite renowned for its advanced analytics, business intelligence, and data management capabilities. With a wide range of statistical techniques, predictive modeling tools, and data visualization options, SAS is trusted by organizations across industries for complex data analysis tasks and decision support.
Features:
- Wide range of statistical procedures.
- Data integration and cleansing tools.
- Advanced analytics and machine learning capabilities.
- Scalable for enterprise-level data analysis.
Pros:
- Powerful statistical modeling capabilities.
- Excellent support for large datasets.
- Trusted by industries for decades.
Cons:
- Expensive licensing fees.
- Steep learning curve.
Pricing:
- Contact sales for pricing details.
6. Excel
Despite its simplicity compared to specialized data analysis software, Excel remains popular for basic quantitative analysis and data visualization. With features like pivot tables, functions, and charting tools, Excel provides a familiar and accessible platform for users to perform tasks such as data cleaning, summarization, and exploratory analysis.
Features:
- Formulas and functions for calculations.
- Pivot tables and charts for data visualization.
- Data sorting and filtering capabilities.
- Integration with other Microsoft Office applications.
Pros:
- Widely available and familiar interface.
- Affordable for basic analysis tasks.
- Versatile for various data formats.
Cons:
- Limited statistical functions compared to specialized software.
- Not suitable for handling large datasets.
Pricing:
- Included in Microsoft 365 subscription plans, starts at $6.99 per month.
7. Hotjar
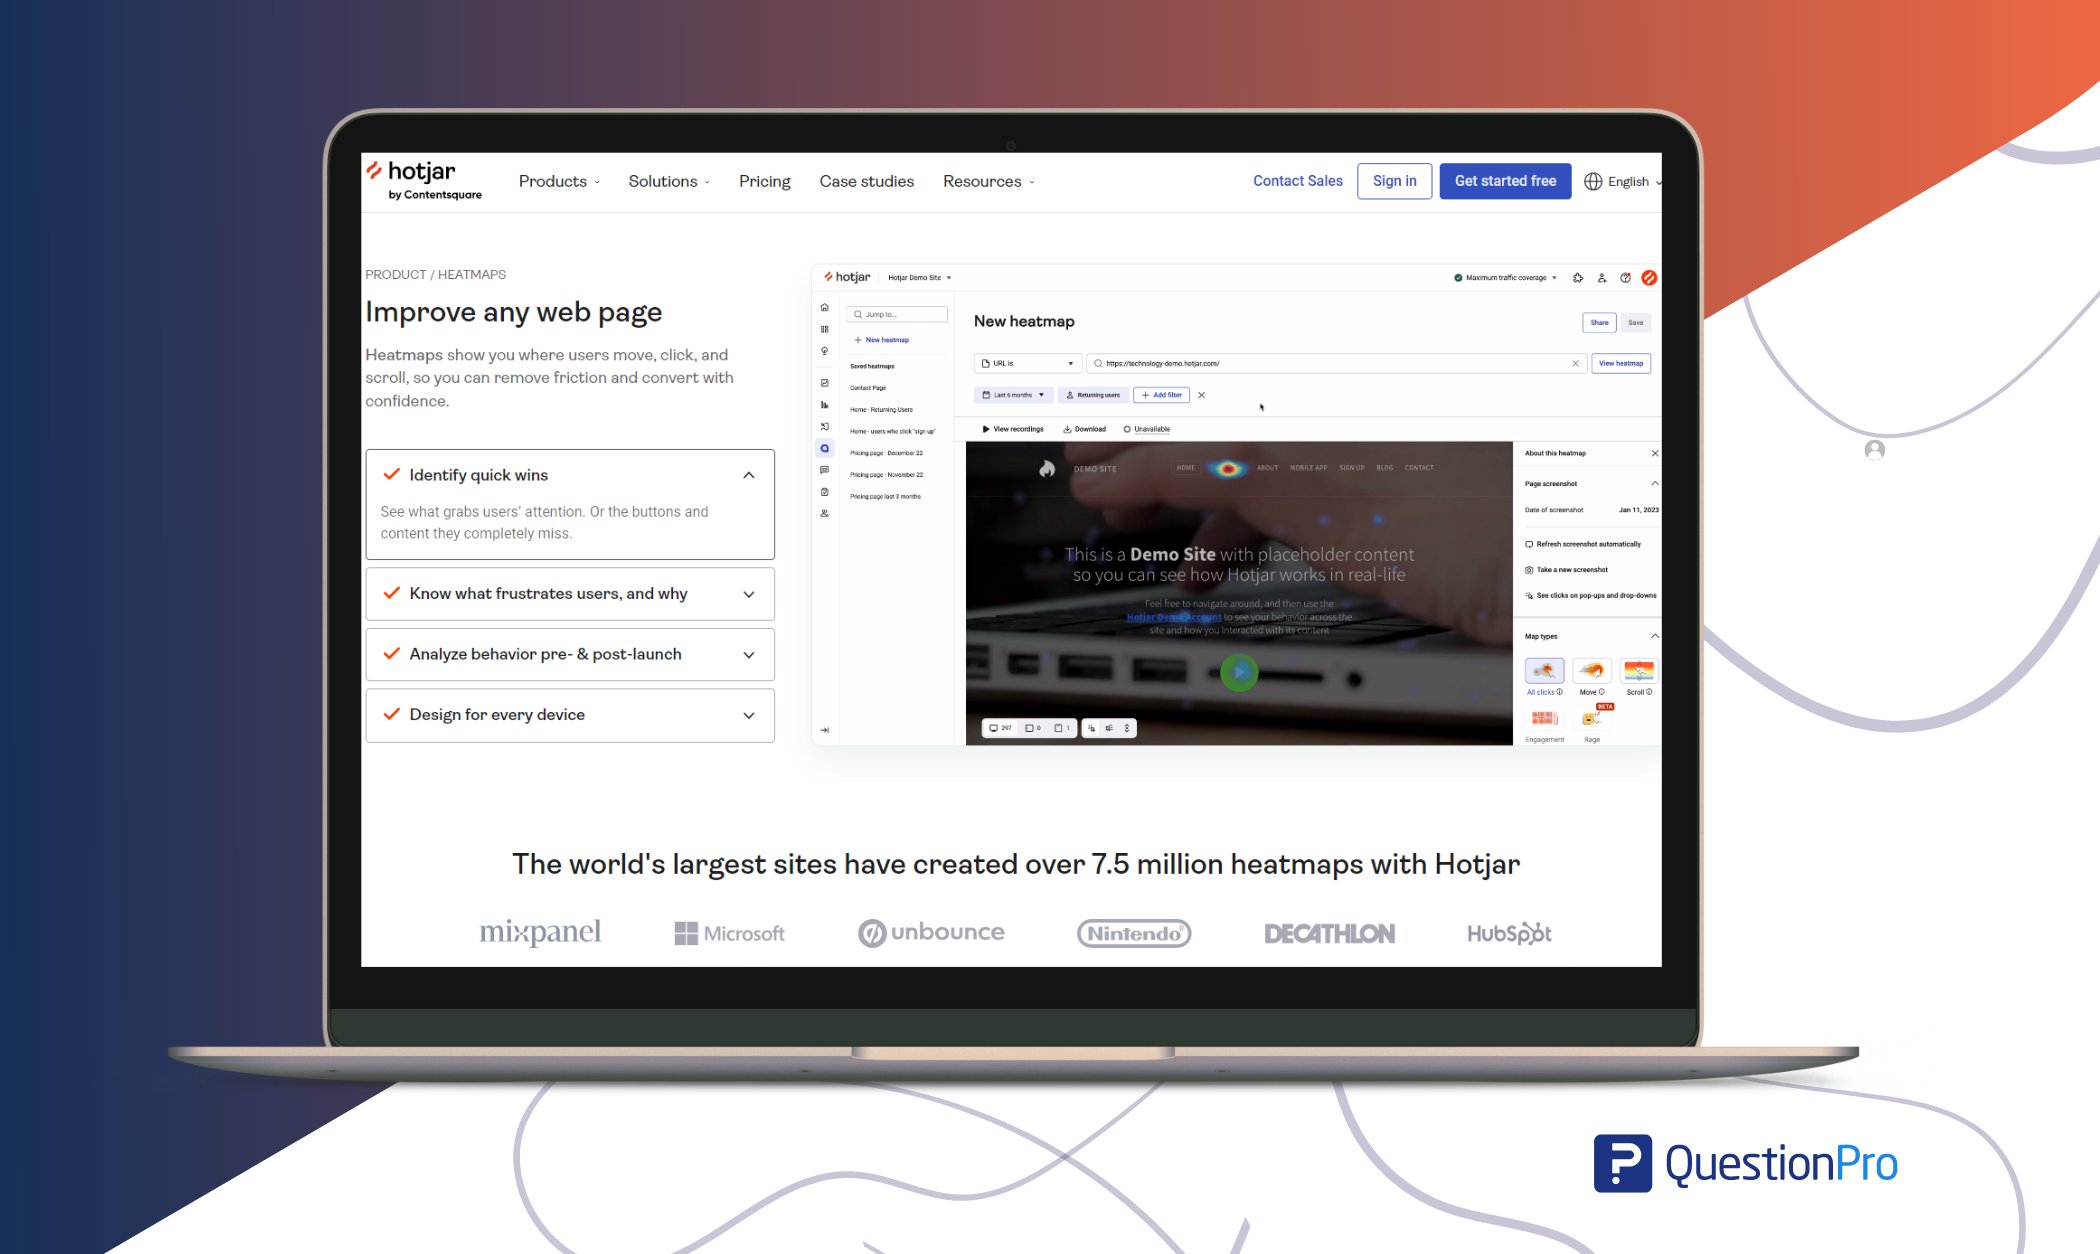
Hotjar is a powerful tool for understanding user behavior on websites and digital platforms. It enables businesses to visualize how users interact with their websites, identify pain points, and optimize the user experience for better conversion rates and customer satisfaction through features like heatmaps, session recordings, and on-site surveys.
Features:
- Heatmaps to visualize user clicks, taps, and scrolling behavior.
- Session recordings for in-depth user interaction analysis.
- Feedback polls and surveys.
- Funnel and form analysis.
Pros:
- Easy to install and set up.
- Comprehensive insights into user behavior.
- Affordable pricing plans.
Cons:
- Limited customization options for surveys.
Pricing:
- Starts at $39 per month.
8. IBM SPSS Statistics
Building on the foundation of SPSS, IBM SPSS Statistics offers enhanced features and capabilities for advanced statistical analysis and predictive modeling. With modules for data preparation, regression analysis, and survival analysis, IBM SPSS Statistics is well-suited for researchers and analysts tackling complex data analysis challenges.
Features:
- Advanced statistical procedures.
- Data preparation and transformation tools.
- Automated model building and deployment.
- Integration with other IBM products.
Pros:
- Extensive statistical capabilities.
- User-friendly interface for beginners.
- Enterprise-grade security and scalability.
Cons:
- High cost for the full version.
- Limited support for open-source integration.
Pricing:
- Contact sales for pricing details.
9. Minitab
Minitab is a specialized software package designed for quality improvement and statistical analysis in manufacturing, engineering, and healthcare industries. With tools for experiment design, statistical process control, and reliability analysis, Minitab empowers users to optimize processes, reduce defects, and improve product quality.
Features:
- Basic and advanced statistical analysis.
- Graphical analysis tools for data visualization.
- Statistical methods improvement.
- DOE (Design of Experiments) capabilities.
Pros:
- Streamlined interface for statistical analysis.
- Comprehensive quality improvement tools.
- Excellent customer support.
Cons:
- Limited flexibility for customization.
- Steep learning curve for beginners.
Pricing:
- Starts at $29 per month.
10. JMP
JMP is a dynamic data visualization and statistical analysis tool developed by SAS Institute. Known for its interactive graphics and exploratory data analysis capabilities, JMP enables users to uncover patterns, trends, and relationships in their data, facilitating deeper insights and informed decision-making.
Features:
- Interactive data visualization.
- Statistical modeling and analysis.
- Predictive analytics and machine learning.
- Integration with SAS and other data sources.
Pros:
- Intuitive interface for exploratory data analysis.
- Dynamic graphics for better insights.
- Integration with SAS for advanced analytics.
Cons:
- Limited scripting capabilities.
- Less customizable compared to other SAS products.
Pricing:
- Contact sales for pricing details.
Why Choose QuestionPro as Your Right Quantitative Data Analysis Software?
QuestionPro offers a range of features specifically designed for quantitative data analysis, making it a suitable choice for various research, survey, and data-driven decision-making needs. Here’s why it might be the right fit for you:
Comprehensive Survey Capabilities
QuestionPro provides extensive tools for creating surveys with quantitative questions, allowing you to gather structured data from respondents. Whether you need Likert scale questions, multiple-choice questions, or numerical input fields, QuestionPro offers the flexibility to design surveys tailored to your research objectives.
Real-Time Data Analysis
With QuestionPro’s real-time data collection and analysis features, you can access and analyze survey responses as soon as they are submitted. This enables you to quickly identify trends, patterns, and insights without delay, facilitating agile decision-making based on up-to-date information.
Advanced Statistical Analysis
QuestionPro includes advanced statistical analysis tools that allow you to perform in-depth quantitative analysis of survey data. Whether you need to calculate means, medians, standard deviations, correlations, or conduct regression analysis, QuestionPro offers the functionality to derive meaningful insights from your data.
Data Visualization
Visualizing quantitative data is crucial for understanding trends and communicating findings effectively. QuestionPro offers a variety of visualization options, including charts, graphs, and dashboards, to help you visually represent your survey data and make it easier to interpret and share with stakeholders.
Segmentation and Filtering
QuestionPro enables you to segment and filter survey data based on various criteria, such as demographics, responses to specific questions, or custom variables. This segmentation capability allows you to analyze different subgroups within your dataset separately, gaining deeper insights into specific audience segments or patterns.
Cost-Effective Solutions
QuestionPro offers pricing plans tailored to different user needs and budgets, including options for individuals, businesses, and enterprise-level organizations. Whether conducting a one-time survey or needing ongoing access to advanced features, QuestionPro provides cost-effective solutions to meet your requirements.
Conclusion
Choosing the right quantitative data analysis software depends on your specific needs, budget, and level of expertise. Whether you’re a researcher, marketer, or business analyst, these top 10 software options offer diverse features and capabilities to help you unlock valuable insights from your data.
If you’re looking for a comprehensive, user-friendly, and cost-effective solution for quantitative data analysis, QuestionPro could be the right choice for your research, survey, or data-driven decision-making needs. With its powerful features, intuitive interface, and flexible pricing options, QuestionPro empowers users to derive valuable insights from their survey data efficiently and effectively.
So go ahead, explore QuestionPro, and empower yourself to unlock valuable insights from your data!
Frequently Asked Questions (FAQs)
Common features include:
Data Management
Statistical Analysis
Visualization
Data Export
Advanced Analytics
Yes, many quantitative data analysis tools are designed to handle large datasets. However, the efficiency can vary depending on the software and the system resources available. Tools like SAS and MATLAB are known for their capacity to manage and analyze large volumes of data effectively.
The main functions include data management (importing and cleaning data), statistical analysis (e.g., regression, hypothesis testing), data visualization (charts, graphs), and reporting results.


