Are you ready to survey your research target? Research surveys help you gain insights from your target audience. The data you collect gives you insights to meet customer needs, leading to increased sales and customer loyalty. Sample size calculation and determination are imperative to the researcher to determine the right number of respondents, considering the research study’s quality.
So, how should you determine the sample size? How do you know who should get your survey? How do you decide on the number of the target audience?
Sending out too many surveys can be expensive without giving you a definitive advantage over a smaller sample. But if you send out too few, you won’t have enough data to draw accurate conclusions.
Knowing how to accurately calculate and determine the appropriate sample size can give you an edge over your competitors. Let’s take a look at what a good sample includes. Also, let’s look at the sample size calculation formula so you can determine the perfect sample size for your next survey.
What is Sample Size?
‘Sample size’ is a market research term used to define the number of individuals included in research. Researchers choose their sample based on demographics, such as age, gender, or physical location. The term can be vague or specific.
For example, you may want to know what people within the 18-25 age range think of your product. Or, you may only require your sample to live in the United States, giving you a wide population range. The total number of individuals in a particular sample is the sample size.
What is Sample Size Determination?
Sample size determination is choosing the correct number of observations or people from a larger group to use in a sample. The goal of figuring out the sample size is to ensure that the sample is big enough to give statistically valid results and accurate estimates of population parameters but small enough to be manageable and cost-effective.
In many research studies, getting information from every member of the population of interest is not possible or useful. Instead, researchers choose a sample of people or events representative of the whole to study. How accurate and precise the results are can depend a lot on the size of the sample.
Choosing the statistically significant sample size depends on a number of things, such as the size of the population, how precise you want your estimates to be, how confident you want to be in the results, how different the population is likely to be, and how much money and time you have for the study. Statistics are often used to determine a sample size for a certain type of study and research question.
Figuring out the sample size is important in ensuring that research findings and conclusions are valid and reliable.
Why Do You Need to Determine the Sample Size?
Let’s say you are a market researcher in the US and want to send out a survey or questionnaire. The survey aims to understand your audience’s feelings toward a new cell phone you are about to launch. You want to know what people in the US think about the new product to predict the phone’s success or failure before launch.
Hypothetically, you choose the population of New York, which is 8.49 million. You use a sample size determination formula to select a sample of 500 individuals who fit into the consumer panel requirement. The responses can help you determine how your audience will react to the new product.
However, determining a sample size requires more than just sending your survey to as many people as possible. If your estimated sample size is too big, it could waste resources, time, and money. A sample size that’s too small doesn’t allow you to gain maximum insights, leading to inconclusive results.
LEARN ABOUT: Survey Sample Sizes
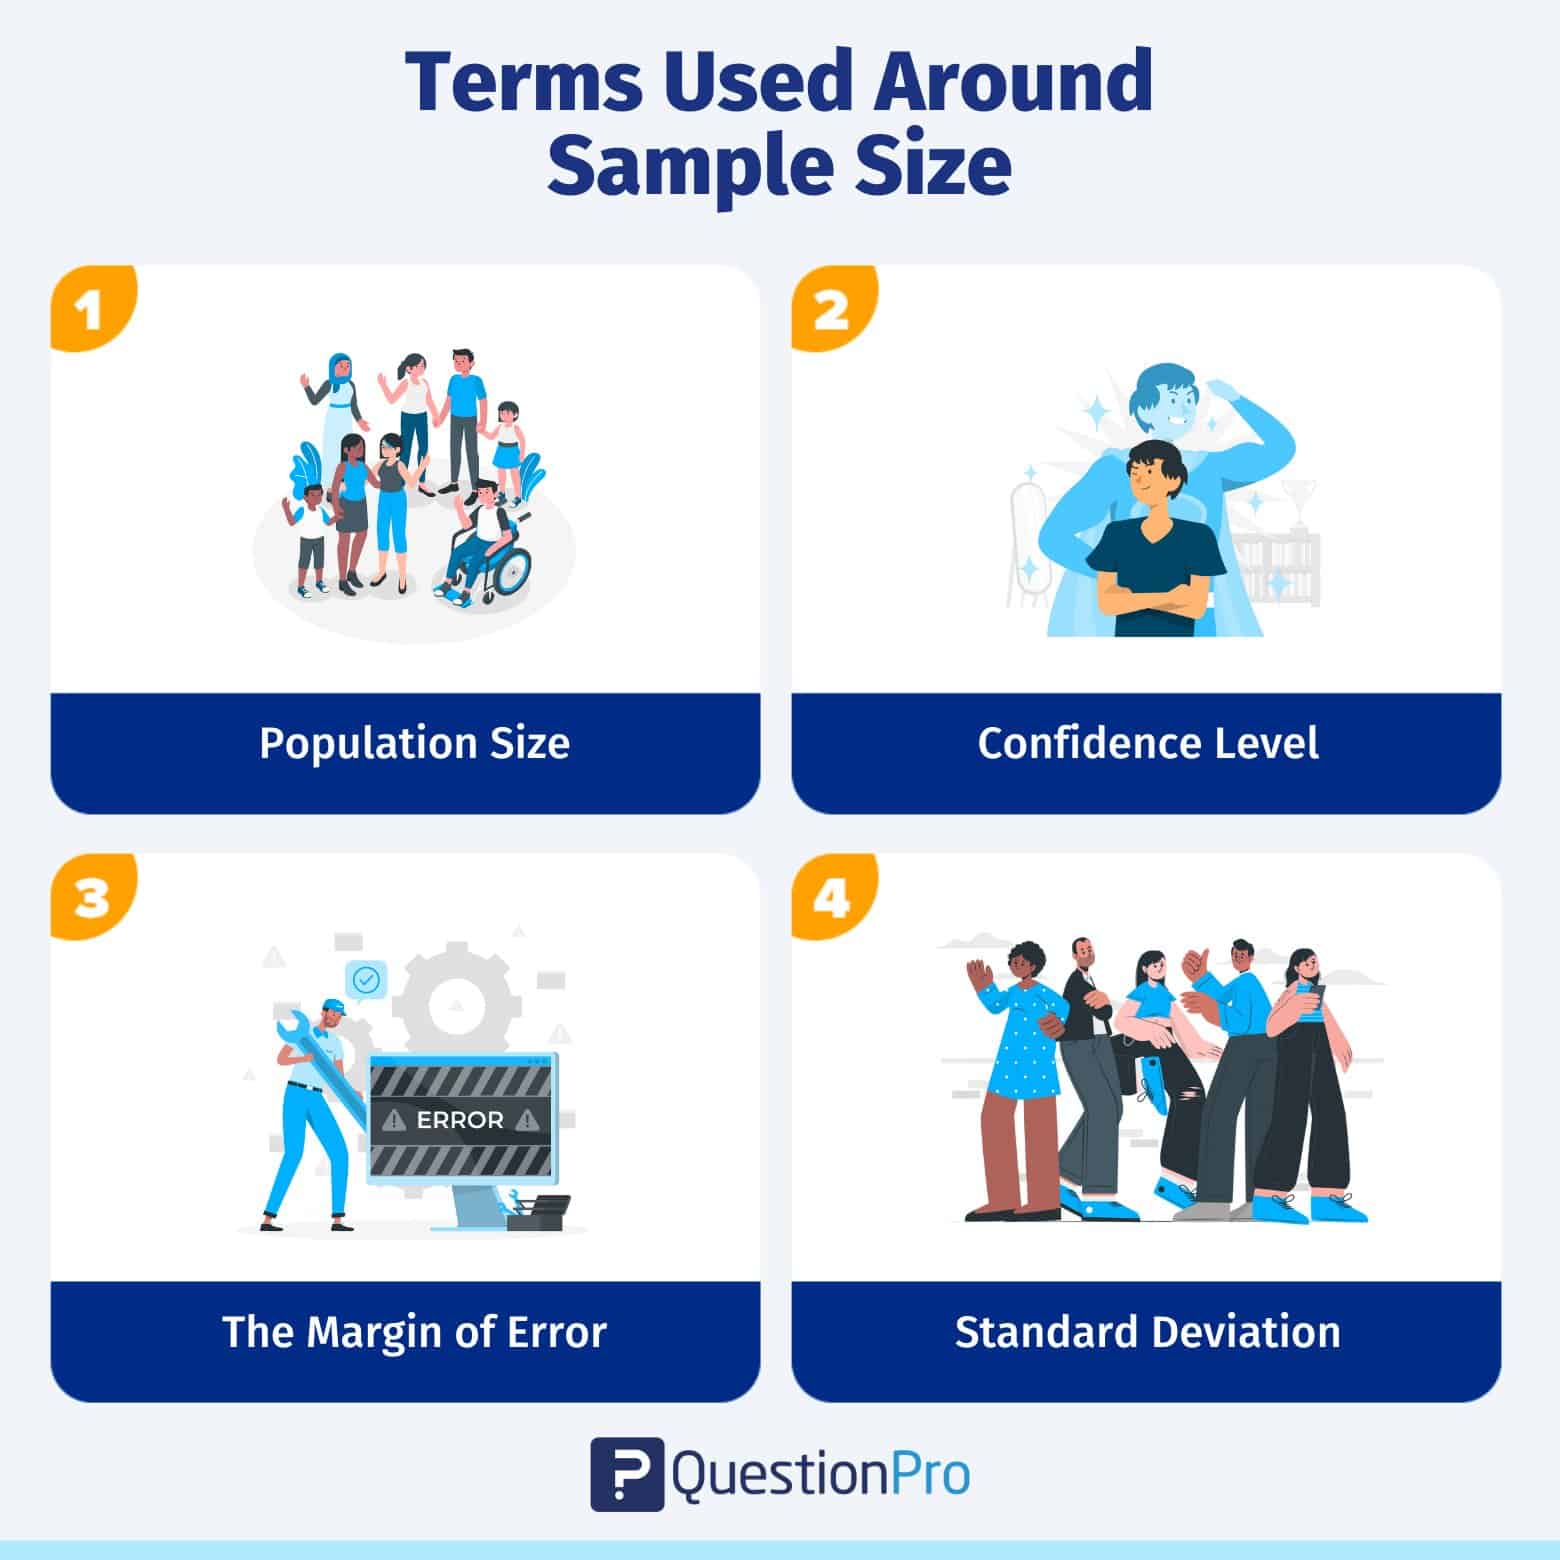
What are the Terms Used Around the Sample Size?
Before we jump into sample size determination, let’s take a look at the terms you should know:

1. Population size:
Population size is how many people fit your demographic. For example, you want to get information on doctors residing in North America. Your population size is the total number of doctors in North America.
Don’t worry! Your population size doesn’t always have to be that big. Smaller population sizes can still give you accurate results as long as you know who you’re trying to represent.
2. Confidence level:
The confidence level tells you how sure you can be that your data is accurate. It is expressed as a percentage and aligned to the confidence interval. For example, if your confidence level is 90%, your results will most likely be 90% accurate.
3. The margin of error (confidence interval):
There’s no way to be 100% accurate when it comes to surveys. Confidence intervals tell you how far off from the population means you’re willing to allow your data to fall.
A margin of error describes how close you can reasonably expect a survey result to fall relative to the real population value. Remember, if you need help with this information, use our margin of error calculator.
4. Standard deviation:
Standard deviation is the measure of the dispersion of a data set from its mean. It measures the absolute variability of a distribution. The higher the dispersion or variability, the greater the standard deviation and the greater the magnitude of the deviation.
For example, you have already sent out your survey. How much variance do you expect in your responses? That variation in response is the standard deviation.
Sample Size Calculation Formula – Sample Size Determination
With all the necessary terms defined, it’s time to learn how to determine sample size using a sample calculation formula.
Your confidence level corresponds to a Z-score. This is a constant value needed for this equation. Here are the z-scores for the most common confidence levels:
90% – Z Score = 1.645
95% – Z Score = 1.96
99% – Z Score = 2.576
If you choose a different confidence level, various online tools can help you find your score.
Necessary Sample Size = (Z-score)2 * StdDev*(1-StdDev) / (margin of error)2
Here is an example of how the math works, assuming you chose a 90% confidence level, a .6 standard deviation, and a margin of error (confidence interval) of +/- 4%.
((1.64)2 x .6(.6)) / (.04)2
( 2.68x .0.36) / .0016
.9648 / .0016
=603
603 respondents are needed, and that becomes your sample size.
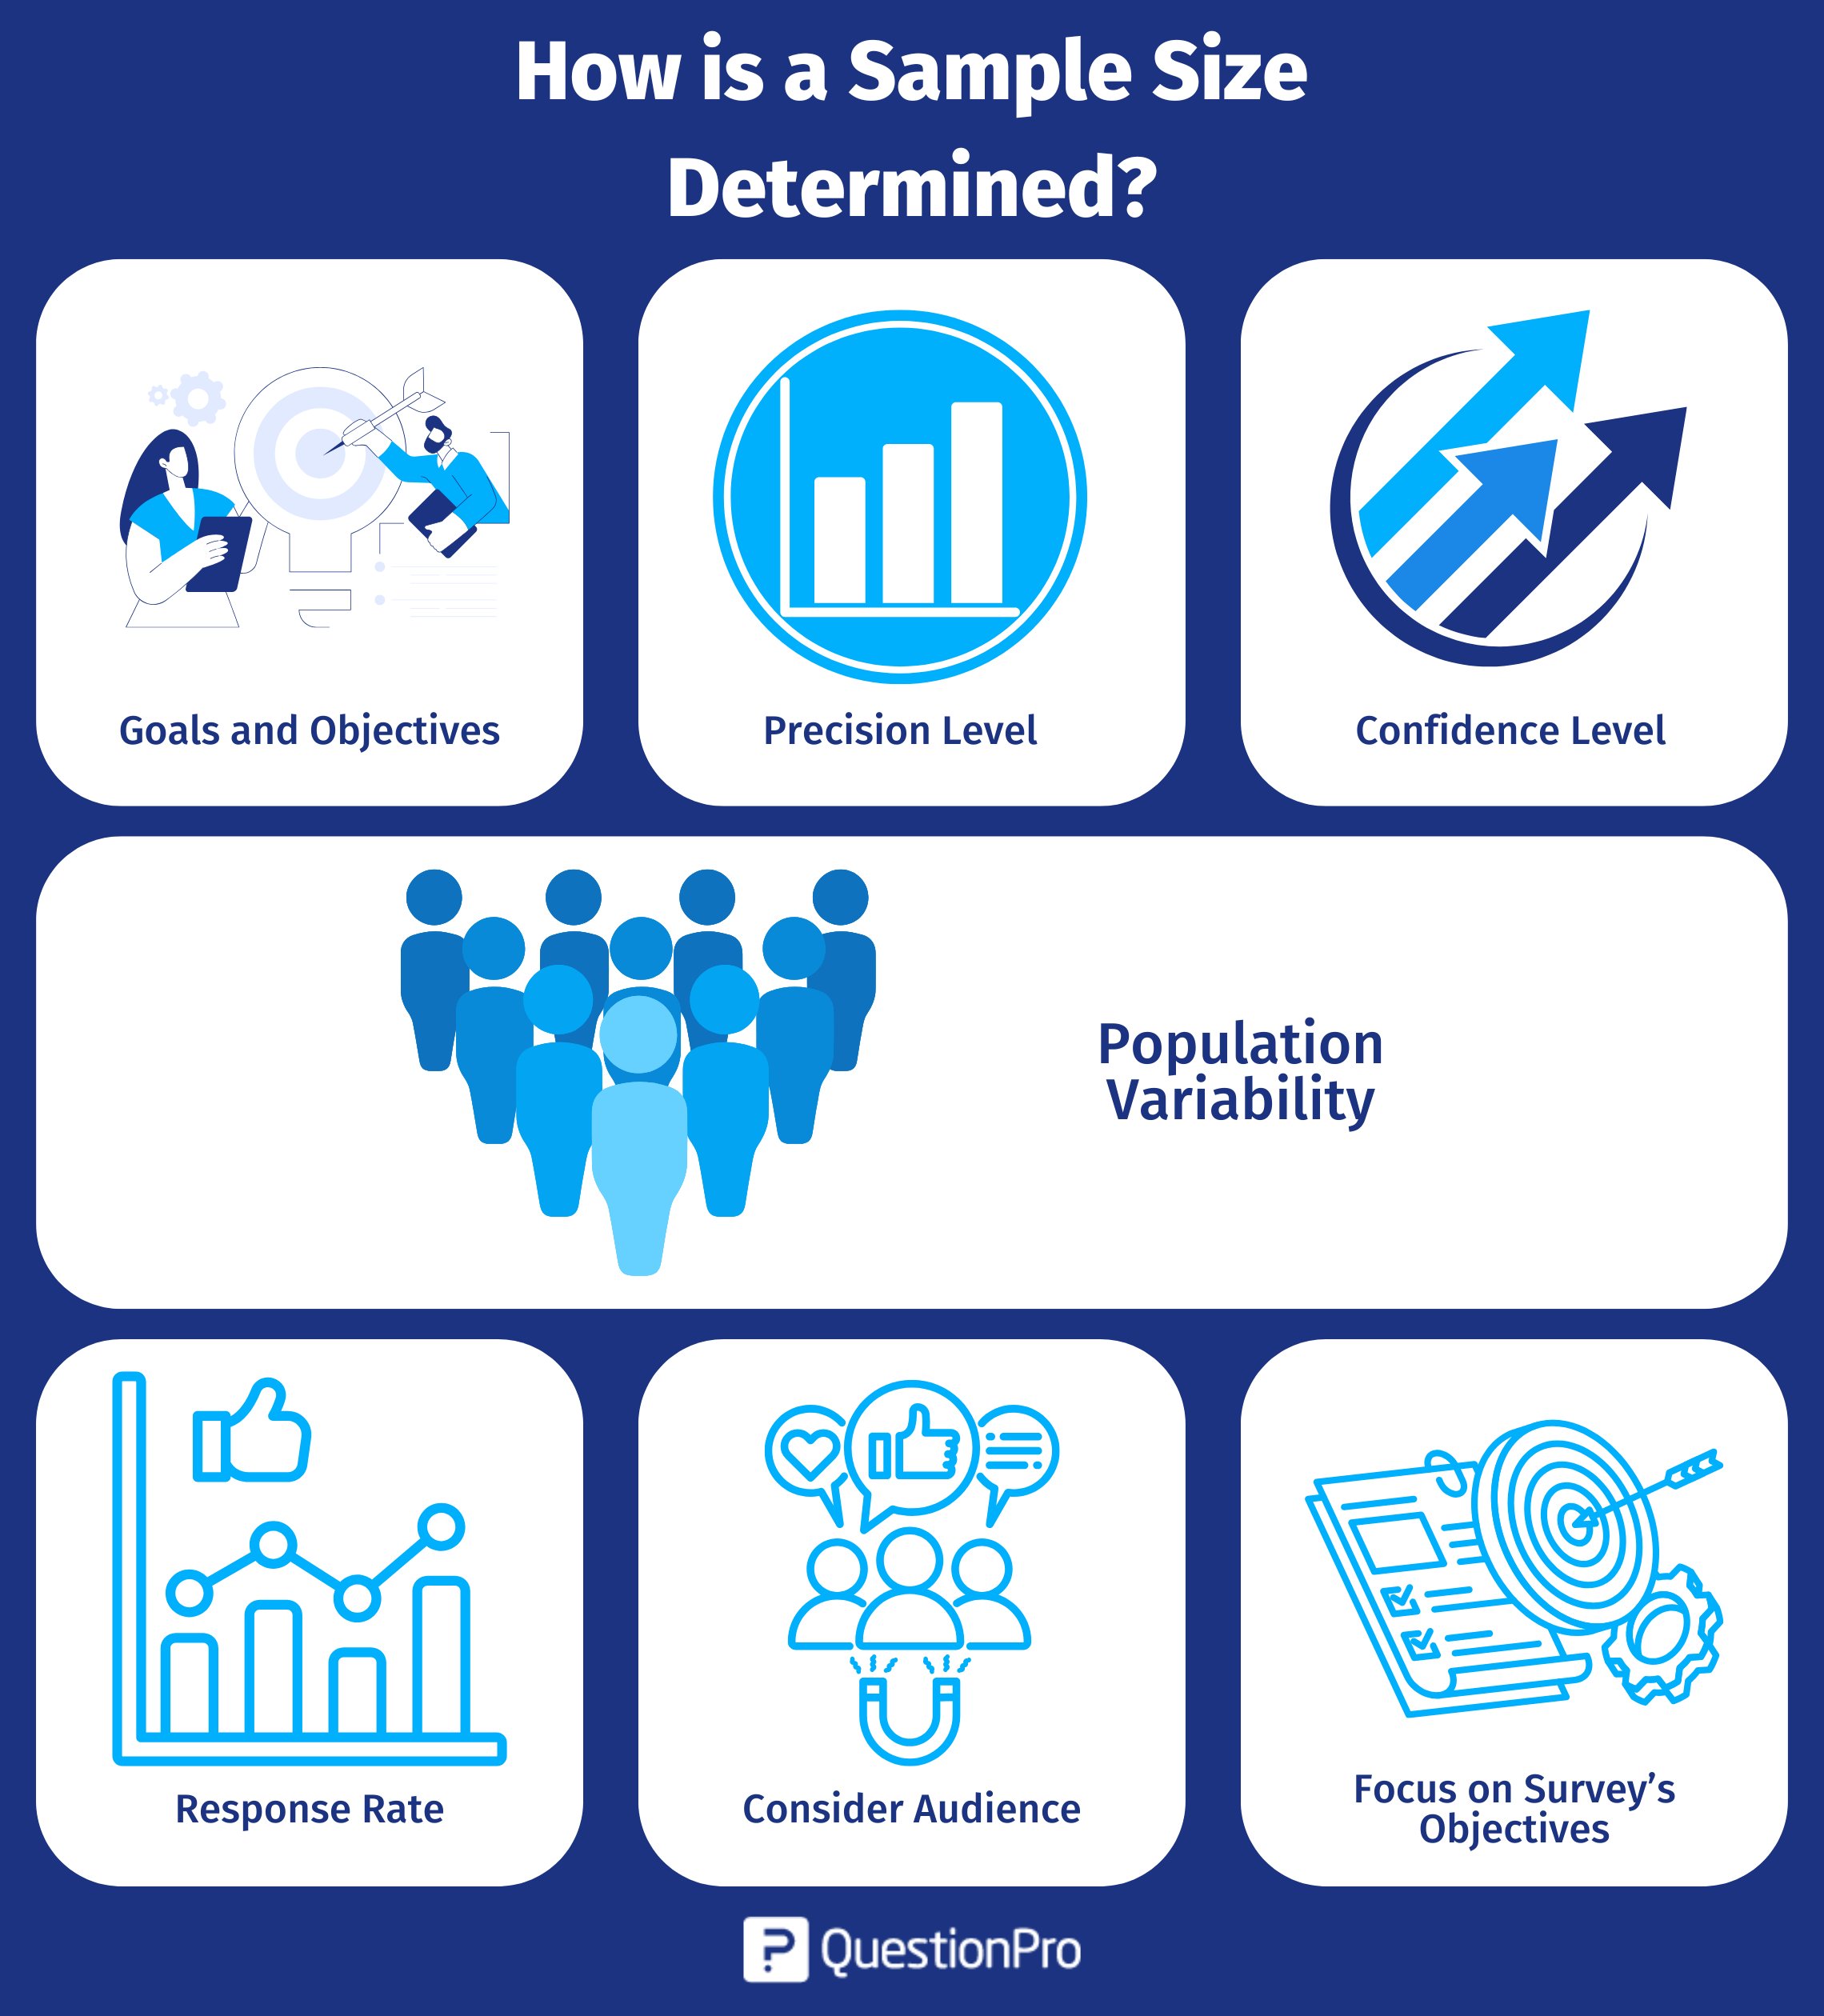
How is a Sample Size Determined?
Determining the right sample size for your survey is one of the most common questions researchers ask when they begin a market research study. Luckily, sample size determination isn’t as hard to calculate as you might remember from an old high school statistics class.
Before calculating your sample size, ensure you have these things in place:

1. Goals and objectives:
What do you hope to do with the survey? Are you planning on projecting the results onto a whole demographic or population? Do you want to see what a specific group thinks? Are you trying to make a big decision or just setting a direction?
Calculating sample size is critical to projecting your survey results on a larger population. You’ll want to ensure it’s balanced and reflects the community as a whole. However, the sample size isn’t as critical if you’re trying to understand preferences.
For example, you’re surveying homeowners across the US on the cost of cooling their homes in the summer. A homeowner in the South probably spends much more money cooling their home in the humid heat than in Denver, where the climate is dry and cool.
You’ll need responses from people in all US areas and environments for the most accurate results. If you only collect responses from one extreme, such as the warm South, your results will be skewed.
2. Precision level:
How close do you want the survey results to mimic the true value if everyone responded? Again, if this survey determines how you will spend millions of dollars, then your sample size determination should be exact.
The more accurate you need to be, the larger the sample you want to have, and the more your sample will have to represent the overall population. If your population is small, say, 200 people, you may want to survey the entire population rather than cut it down with a sample.
3. Confidence level:
Think of confidence from the perspective of risk. How much risk are you willing to take on? This is where your Confidence Interval numbers become important. How confident do you want to be — 98% confident, 95% confident?
Understand that the confidence percentage you choose greatly impacts the number of completions you’ll need for accuracy. This can increase the survey’s length and the number of responses you need, which means increased costs for your survey.
Knowing the actual numbers and amounts behind percentages can help you make more sense of your correct sample size needs compared to survey costs.
For example, you want to be 99% confident. After using the sample size determination formula, you need to collect an additional 1000 respondents.
This, in turn, means you’ll be paying for samples or keeping your survey running for an extra week or two. You have to determine if the increased accuracy is more important than the cost.
4. Population variability:
What variability exists in your population? In other words, how similar or different is the population?
If you are surveying consumers on a broad topic, there may be many variations. To get the most accurate picture of the population, you’ll need a larger sample size.
However, if you’re surveying a population with similar characteristics, your variability will be less, and you can sample fewer people. More variability equals more samples, and less variability equals fewer samples. If you’re not sure, you can start with 50% variability.
5. Response rate:
You want everyone to respond to your survey. Unfortunately, every survey has targeted respondents who either never open the study or drop out halfway through. Your response rate will depend on your population’s engagement with your product, service organization, or brand.
The higher the response rate, the higher your population’s engagement level. Your base sample size is the number of responses you must get for a survey to be successful.
6. Consider your audience:
Besides the variability within your population, you need to ensure your sample doesn’t include people who won’t benefit from the results. One of the biggest mistakes you can make in sample size determination is forgetting to consider your actual audience.
For example, you would not want to send a survey to a group of homeowners asking about the quality of local apartment amenities.
7. Focus on your survey’s objectives:
You may start with general demographics and characteristics, but can you narrow those characteristics down even more? Narrowing down your audience makes it easier to get a more accurate result from a small sample size.
For example, you want to know how people will react to new automobile technology. Your current population includes anyone who owns a car in a particular market.
However, you know your target audience is people who drive cars that are less than five years old. You can remove anyone with an older vehicle from your sample because they will unlikely purchase your product.
Once you know what you hope to gain from your survey and what variables exist within your population, you can decide how to calculate the sample size. Using the formula to determine sample size is a great starting point for getting accurate results.
After calculating the sample size, you’ll want to find reliable customer survey software to help you accurately collect survey responses and turn them into analyzed reports.
LEARN MORE: Population vs Sample
Conclusion
In determining sample size, the statistical analysis plan needs to carefully consider the level of significance, effect size, and sample size.
Researchers must reconcile statistical significance with practical and ethical factors like practicality and cost. A well-designed study with a sufficient sample size can improve the odds of obtaining statistically significant results.
To meet the goal of your survey, you may have to try a few methods to increase the response rate, such as:
- Increase the list of people who receive the survey.
- To reach a wider audience, use multiple distribution channels, such as SMS, website, and email surveys.
- Send reminders to survey participants to complete the survey.
- Offer incentives for completing the survey, such as an entry into a prize drawing or a discount on the respondent’s next order.
- Consider your survey structure and find ways to simplify your questions. The less work someone has to do to complete the survey, the more likely they will finish it.
- Longer surveys tend to have lower response rates due to the time it takes to complete the survey. In this case, you can reduce the number of questions in your survey to increase responses.
QuestionPro’s sample size calculator makes it easy to find the right sample size for your research based on your desired level of confidence, your margin of error, and the population size.
Frequently Asked Questions (FAQ)
The four ways to determine sample size are:
1. Power analysis
2. Convenience sampling,
3. Random sampling,
4. Stratified sampling
The three factors that determine sample size are:
1. Effect size,
2. Level of significance
3. Power
The best way to calculate the sample size is to use statistical techniques like power analysis, the minimal detectable effect size, or the sample size formula, taking into account the study’s goals and practical limitations.
The sample size is important because it affects how precise and accurate a study’s results are and how well researchers can spot real effects or relationships between variables.
The sample size is the number of observations or study participants chosen to be representative of a larger group.


