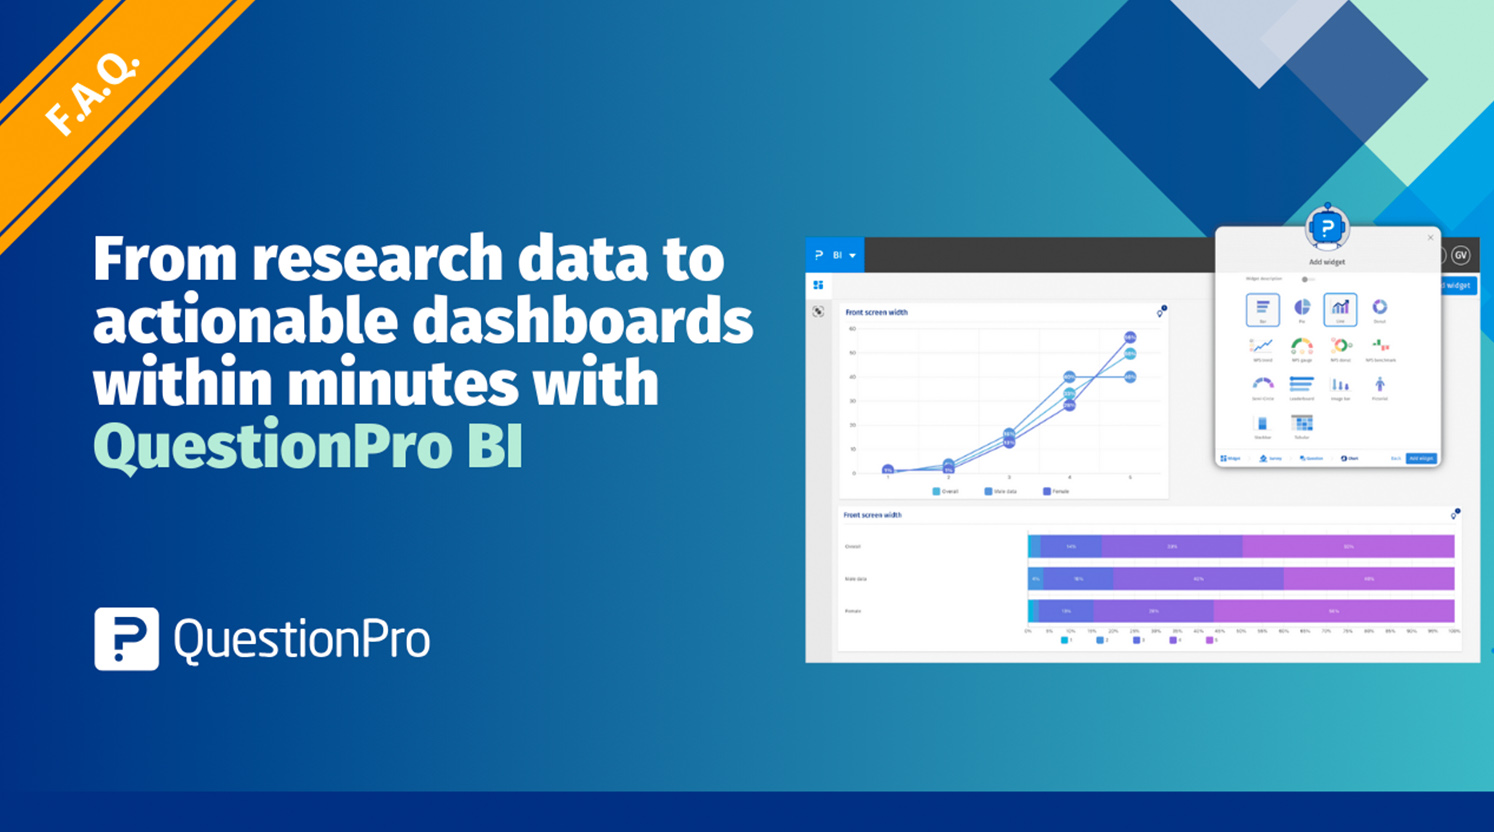
QuestionPro BI, a business intelligence tool for research data visualization, is live for all existing users. It is a simple yet powerful tool that allows for intuitive data visualization and charting platforms for unlocking actionable insights and intelligent reporting of your survey and research data.
Users leveraging the power of QuestionPro BI are reporting an 85% time benefit in conducting statistical analysis and creating dashboards.
QuestionPro BI launch for all existing users
After being in public beta for a few months, QuestionPro BI is now live for all existing QuestionPro account holders. We recently officially launched the tool for all our existing users.
Click below to watch the recap of the official launch that can help you get started from
| You can view the deck from the webinar below.
Salient features of QuestionPro BI
Some key features of QuestionPro BI are as follows:
- Reduce time to create dashboards from hours to minutes.
- Build automated baseline dashboards or manually set up dashboards.
- Pull from various QuestionPro tools to build your dashboards.
- Load research with as many responses and complexities within seconds in the dashboard.
- Simple to use UX without any training.
- Set up data splicers, smart RIM-based weighting and balancing to data, consolidate data from multiple surveys, and create datasets to look at the data any way you want.
- Train the AI engine with prompts to surface insights that work for you.
- Fully customizable dashboards and the ability to add brand components.
- Share the dashboards and collaborate in real-time with recipients.
Answers to some critical questions about QuestionPro BI that will help you get started
To simplify the process of getting started with the tool, we have compiled a list of commonly asked questions and consolidated questions from the official QuestionPro BI launch to set you up today!
Q) What products of QuestionPro can I pull from to create BI dashboards?
- QuestionnPro BI is available with the Advanced license, Team edition, Research edition, Communities, CX, and Workforce license. There are limits on how much you can do with the dashboards. Higher license types get access to more features. To get detailed information, please reach out to your account manager.
Q) Can I add data from multiple surveys to a dashboard?
- You can add data from multiple products, like CX and Workforce, to your Research surveys to gain insights into various aspects, like journey mapping or any other aspect where you need to gather data from similar questions or even get a pulse of topical data. You can even compare survey data to get a snapshot view of insights.
You can even consolidate data from multiple surveys into a dataset and run a QuestionPro BI dashboard.
Q) What type of dashboards are created for qualitative and quantitative survey questions? And are those editable?
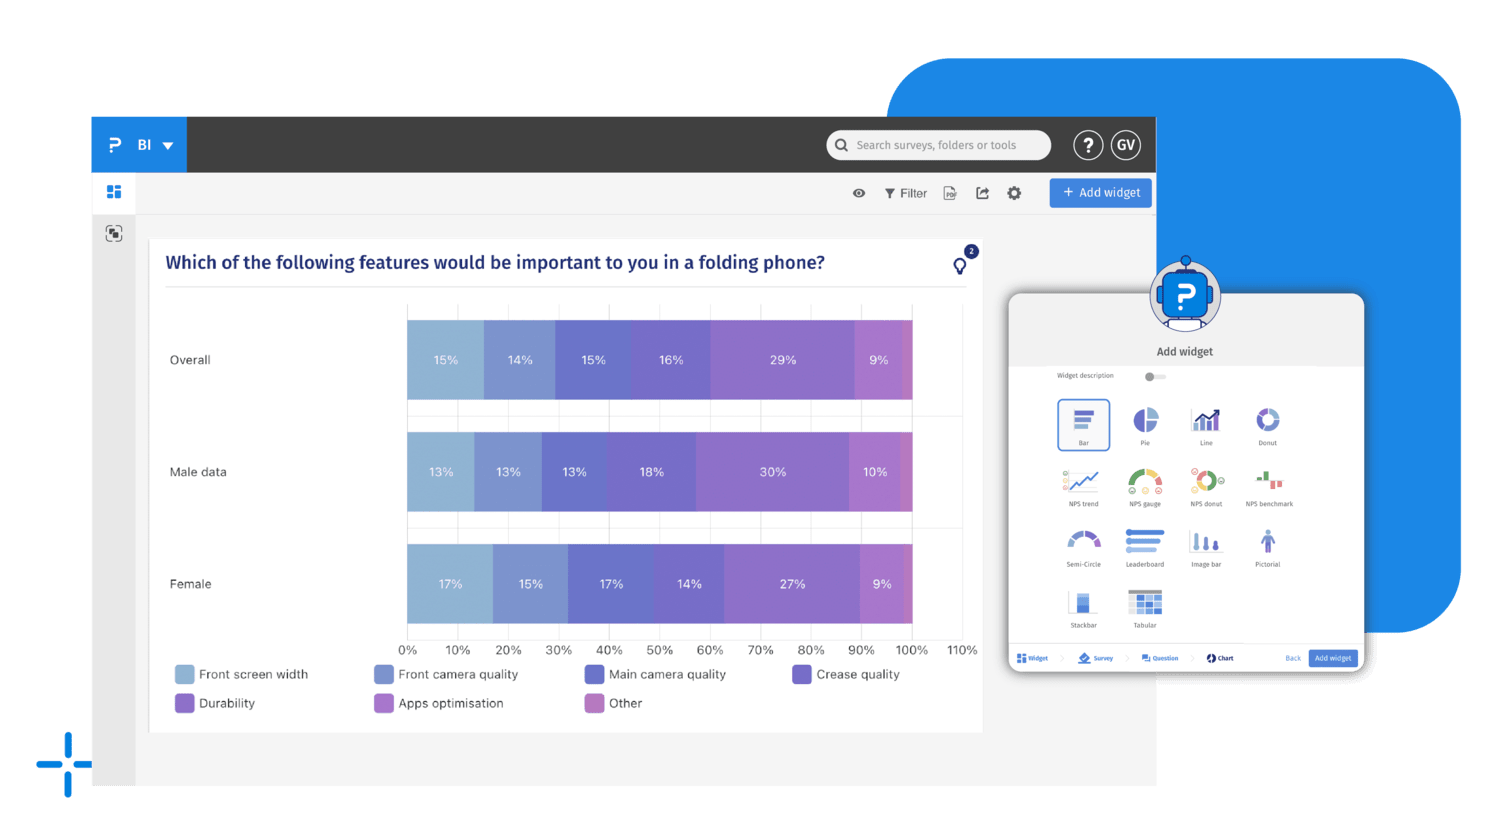
- The AI engine builds baseline dashboards for you automatically within seconds based on the type of questions. For gender and demographic questions, you can get a pictorial graph, donut graphs, etc. For questions that require bar graphs, line graphs, and even advanced graphical representations, you get the most accurate dashboards to represent your data. Open-ended questions, too, are categorized into sentiments and showcased in the dashboard in an easy-to-read format. For open-ended questions that do not necessarily require sentiment analysis, the AI engine is smart enough to showcase that qualitative data in relevant topical analysis dashboards.
The bot predicts and uses a suitable model to generate dashboards.
You can manually change these dashboards based on how you would like to showcase your research data.
Q) Can you download the data to PowerPoints?
- You can currently only export PDFs. However, we are building PowerPoint and Google presentation exports, which should be live by the end of October 2024.
Q) What is the engine doing to create sentiment analysis? How can I validate this? What have they coded?
- We have built this engine over the past 4-5 years, and it has been through millions of open-ended data to generate insights, which we have seen offer us excellent insights. There is good categorization of insights, but if you feel the output isn’t at the level you need to be, the dashboard allows you to go in and make tweaks and recommendations to surface the insights in the best manner for you. These recommendations make further studies and dashboards easier as the bot learns.
Q) How can you add multiple surveys to see either a trend over time or a comparison (perhaps fielding two of the same surveys to two different populations)?
- You can create a data slicer and configure it for another survey or how the respondents answer the question. This slicer can be edited into groups and then added to your dashboard. You can then add multiple slicers to the data to generate the necessary insights.
Q) Are the dashboard elements downloadable if I want to include them in a presentation?
- You can download them into a PDF and use them in your presentation.
Q) Can a user tailor dashboards to a brand?
- With an interactive branding scheme, you can quickly change the dashboard colors, schemes, and more to tailor the report to your brand.
Q) Can users build new variables (think: combine answer options, use and/or logic, etc.) to include the dashboard OR is it limited to the survey data as it’s collected in the field?
- Creating your variables is currently not in public beta, but it should go live on the tool by September 2024. After that, you can build the dashboards with the necessary variables. These variables will allow you to build widgets, crosstabs, comparisons, and more.
Q) Can you compare data sets to compare time periods 1, 2, and 3 in one graph?
- This can be achieved with datasets, variables, and widgets within the tool. Splice up or compare the data in a way that offers you the most actionable insights.
Q) What file formats do you support right now for importing data?
- You can only import data from the QuestionPro suite of products and not any external data.
Q) Can users share the dashboards with non-licensed colleagues?
- You can share interactive dashboards with any relevant recipient to view the data. Share a link that allows them to view the dashboard or add filters. Then, share the link so they can look at the data however they like. Recipients can even add comments to the dashboards to make the interaction with insights real-time.
Q) How do you “nudge” the bot/give it feedback on sentiment analysis? And can you train your AI bot to get better insights?
- We currently allow you to train the bot to generate AI-driven dashboards and data in a way that works for you. For steps on how to do that, please reach out to your account manager. Also, watch for our upcoming webinar on how to work better and faster with the AI engine built into QuestionPro BI and how you can set up your own guardrails to generate insights that matter to you.
Q) Does this integrate or stack upon other tools that you might survey?
- QuestionPro BI will work with data in the QuestionPro ecosystem. However, if you move research platforms, such as from Qualtrics to QuestionPro, you can use the past data to build dashboards in our system.
Q) Can you use this feature to create a dashboard for multiple survey results for one specific researcher?
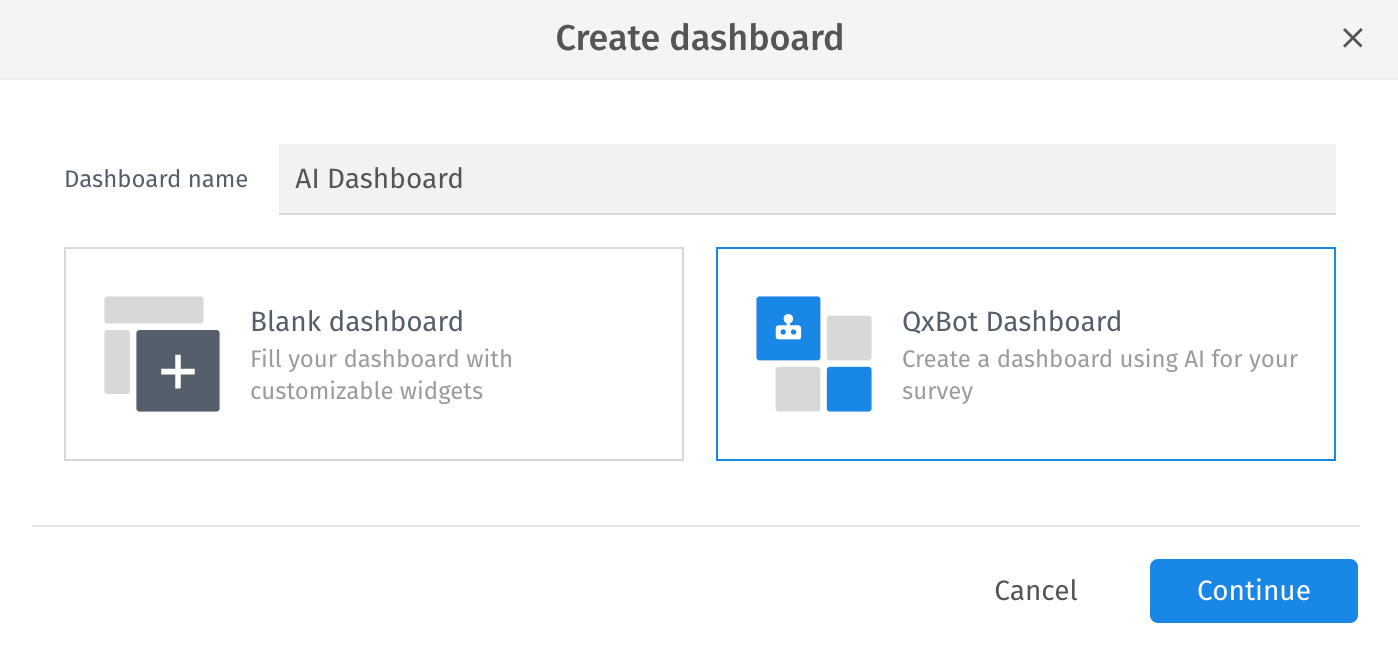
- The auto-dashboard creation with QxBot creates surveys from a single survey at a time. You can manually add the surveys or data you need by adding a widget in the source drop-down. Alternatively, you can consolidate multiple surveys into a dataset and create a dashboard.
Q) You can create a dashboard with information from multiple surveys, but can you compare between surveys? For example, if a parent and child answered different surveys, can you see the percentage agreement between pairs of parents and children if they share an ID number across the two surveys?
- For this, you must create a dataset with the common questions merged; you can then compare parent vs child responses.
Q) What can you do with a combined dataset? I can map the variables between two surveys, but I can’t seem to view it or create a dashboard from it.
- Once you have created the data set, go to create a new dashboard and in the source, select a dataset.
Start using QuestionPro BI in your projects right away!
Get started with QuestionPro BI in your projects today! This tool is integrated into the QuestionPro platform, enhancing its comprehensive features that make research projects seamless and efficient. If you have a QuestionPro account, you can access it and see how powerful data visualization can be.
Don’t have a QuestionPro account? No worries! Sign up for a free trial of QuestionPro Research Edition and experience our tools firsthand.
Already have an account? Click the link below to log in:


