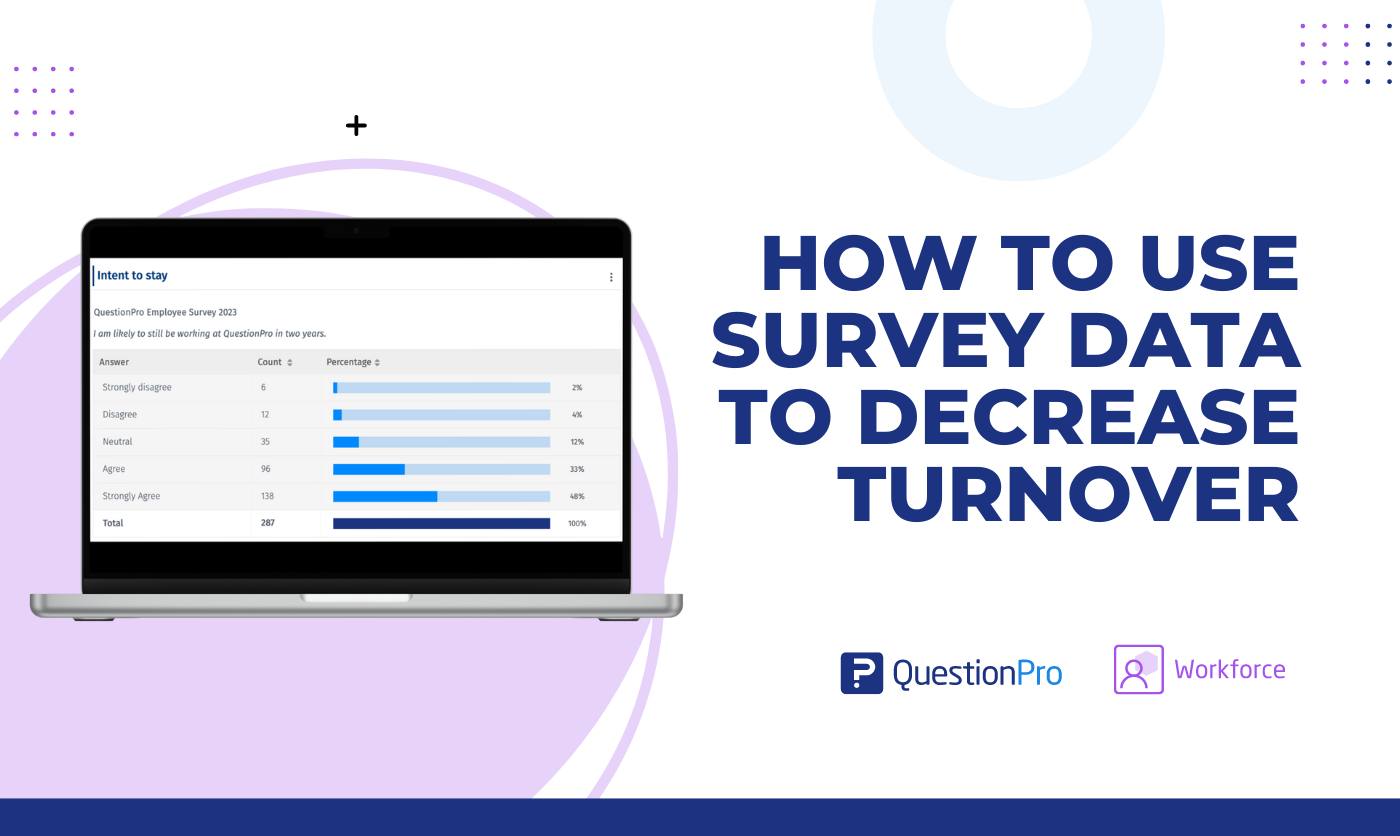
Insights from employee surveys can help with a great number of organizational initiatives. No matter the state of the labor market, a key goal for most organizations is to keep their best people from turning over. This is why in the latest QuestionPro Workforce product update we released a functionality that makes it even easier to look at the data in the way to know how to better keep your people. Want to learn how? Keep reading on!
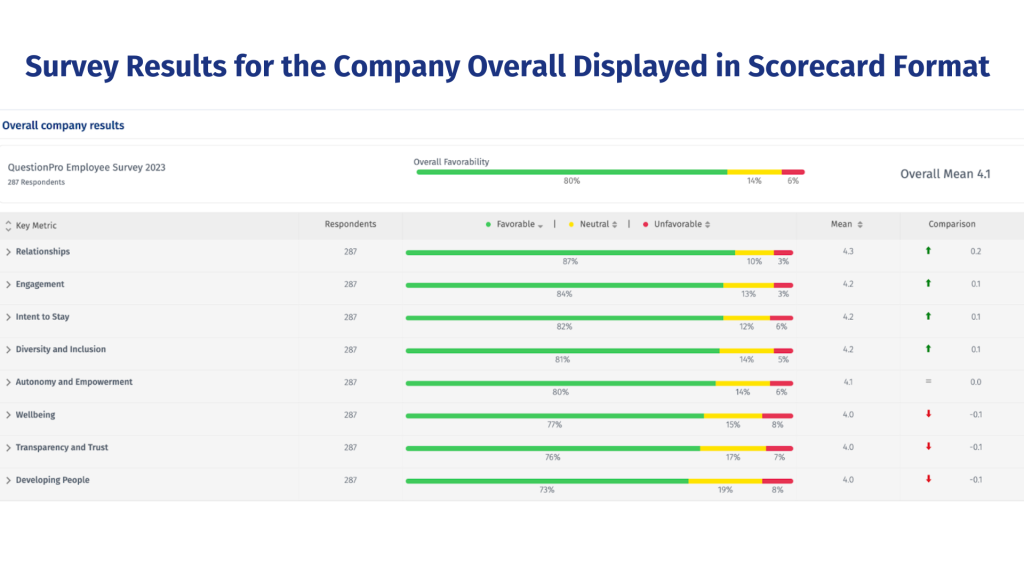
One of the first steps in survey data analysis is to check the overall company results and see where you are doing well as an organization, and where you have the greatest opportunity to improve.
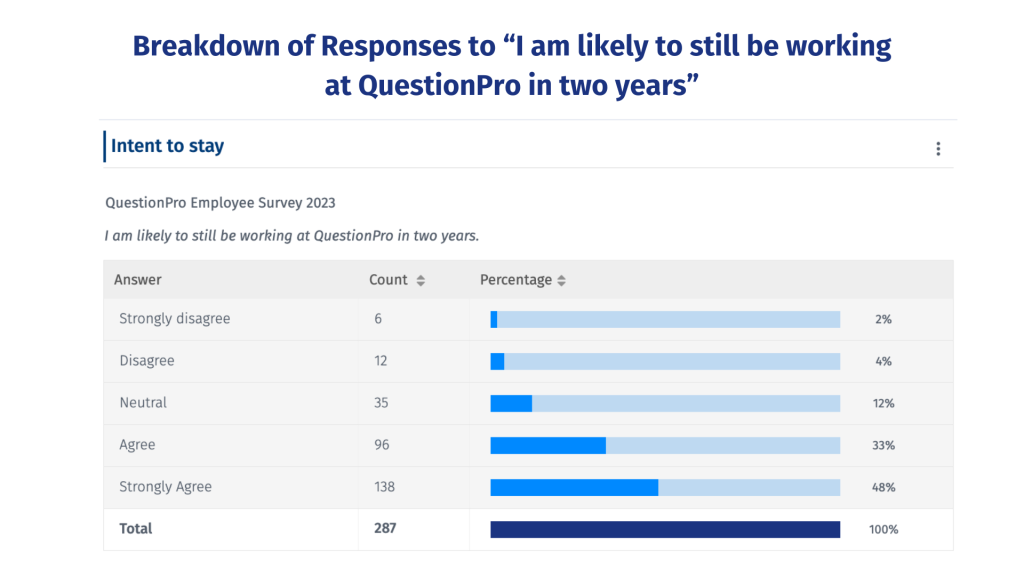
As one of the questions, we suggest asking “How likely are you to still be with {Insert your company name} in 2 years.” You can change the amount of time to what is most appropriate for you. We find 2 years to be a good amount of time because it’s people who don’t see themselves with the company in the mid-long term, but you still have time to use the data to understand why and make any company or team changes to increase their likelihood to stay.
In the most recent release of QuestionPro Workforce, we added the ability for our clients to filter any analytics widget and see that data for just those individuals who answered “strongly disagree” or “disagree” to this question. You can also include those who answered “neutral” if you want a wider definition of the “at risk for turnover” group.
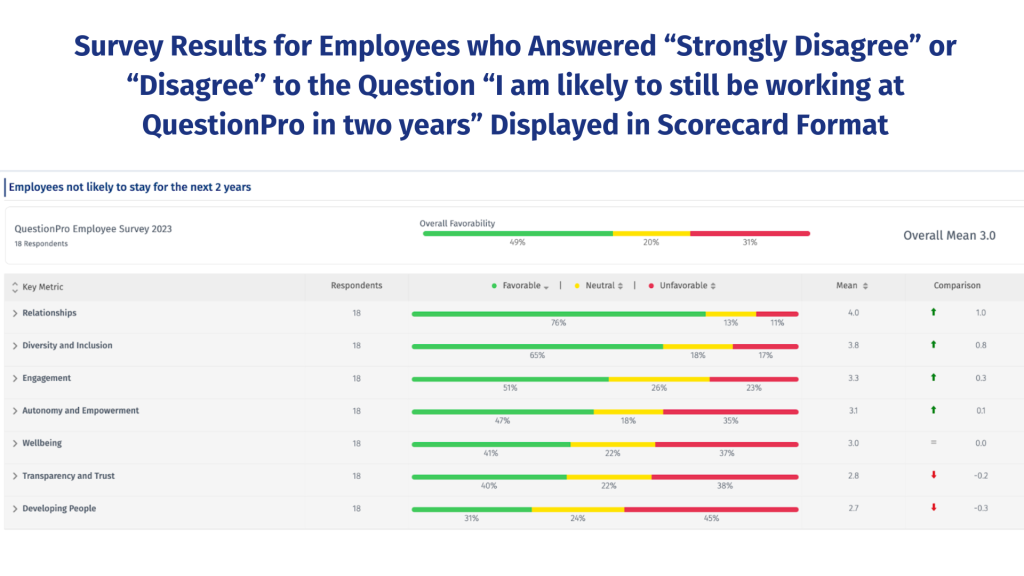
You can see in the dashboard where we filtered just by those who answered “strongly disagree” or “disagree” to the question, while “Developing People” was still the area with lowest employee satisfaction, a whopping 45% of high turnover risk employees were dissatisfied with this area, compared to only 8% of employees overall. This gives another great datapoint for why prioritizing career development for the company is important.
It’s also valuable to add this filter to open-ended questions and see how this group in particular responded. Really, you can add this filter to any question, below is an example for eNPS survey software. You can see that there is a strong relationship between likelihood to stay with the company and likelihood to recommend it as an employer. For organizations where eNPS is an important KPI, this data can be particularly useful.
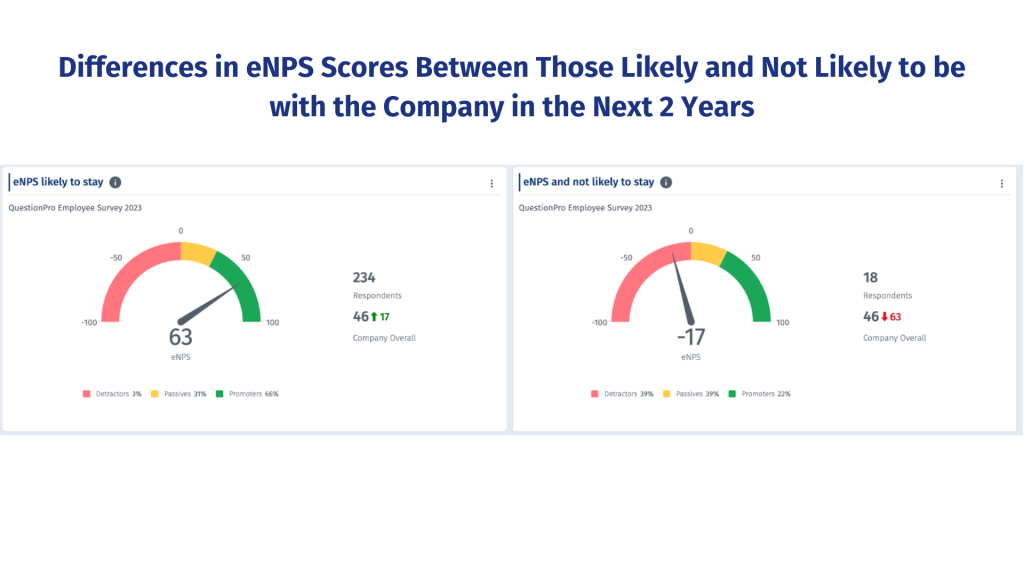
This is just one example of how the ability to filter results by a survey question can help gain even deeper insights and take even more powerful actions.
If you’d like to know more about how this functionality can help you enhance your employee experience strategy, or you aren’t a current client and you’d like to learn more about QuestionPro Workforce, don’t hesitate to reach out to us!


