What do my employees really want?
We all know the trends and stereotypes: corporate employees prioritize stable pay and clear structure while startup hackers prefer being able to glide in at noon and/or working from home. But even within these increasingly defined categories, each company has its own unique quirks and desires as determined by the group’s dynamic and goals. Unfortunately, these dynamics and goals are not always immediately clear. So we run employee surveys, get the results, implement changes… but employees continue to report average-low job satisfaction scores.
What are we doing wrong? What are we still doing wrong?
Let me set the stage a bit.
So you’ve done an employee survey.
Congratulations! I know it wasn’t easy. From creating the questions to hassling management, to actually collecting data from an increasingly skeptical and survey-weary workforce–it’s been a journey. And now you’re at the final stretch: the analysis.
Resist your first instinct to zero in on the lowest score (or worse, the comments). Yes, you’ve scored lowest on Vision and Transparency. Yes, your employees are complaining about product quality. It would be lovely to fix those things. But if you do so, you’ll just be doing what you’ve been doing every past year: panicking over the lowest scoring questions, implementing a few hard-won changes, only to still get low scores.
Get the Best ROI With Your Limited Resources
The ideal workspace has genius management and perfectly-coordinated teams working in a beautiful office with a gazillion perks. Everyone understands their role, the company’s vision, and everyone’s happy with their pay. I’ve heard about these offices. Never saw one myself, and judging from my peers’ industry experience, we’re pretty sure it’s a myth. (Google, maybe?)
We all have limited resources, be it our time or money. Given that it’s near impossible to realistically fix everything, we’re often tempted to shore up our “worst” weaknesses with immediate solutions. Oh, employees are complaining about product quality. Hire more PMs! (Unless you’re a startup.) Oh, employees are complaining about micromanaging supervisors. Fire those PMs!
Key Driver Analysis: Look At What I Do, Not What I Say
We can all agree that things like clear management, invested teammates, product quality, and compensation are important. But which one is most important? What is the key driver of your employees’ happiness?
There’re two ways to go about this: you could expand your already-long survey to include not just the metric questions (Strongly Disagree-Strongly Agree) but also importance inputs (Not Important-Very Important). This gives you an exact stated result on what employees care about. But that’s assuming everyone answers truthfully and thoughtfully, and with everyone’s ever-shortening patience, survey fatigue is more likely than not to muck your data. (And then you’ll get an incorrect analysis, implement an incorrect strategy, and employees will just get even more tired of those pesky internal surveys. What’s the point of asking how happy I am when things never change?)
Enter the Key Driver Analysis.
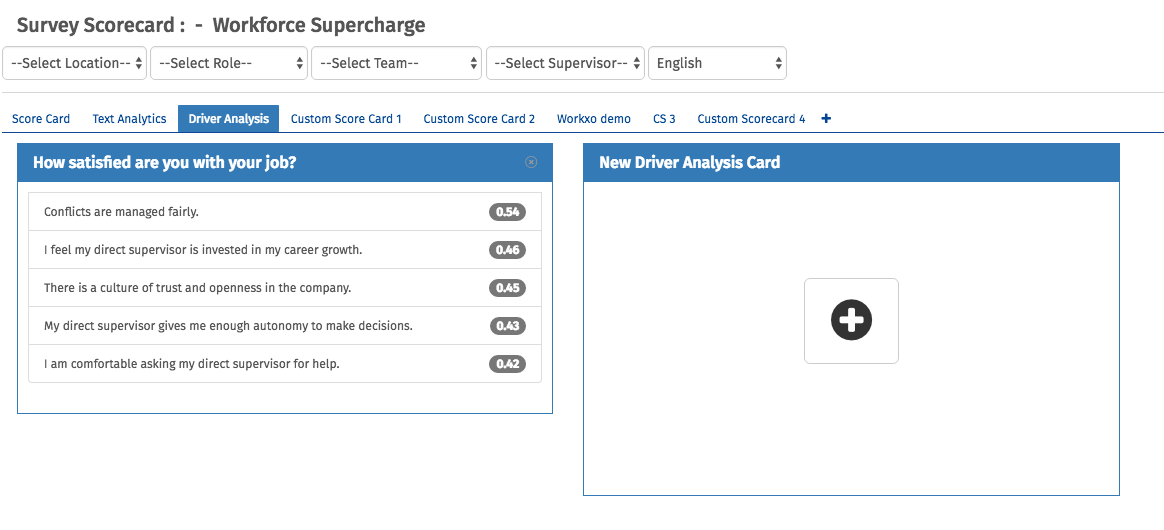
Don’t be fooled by the fancy name: it’s really a very simple process. Key Driver Analysis is simply the process of running regression analysis of all questions against a single common dependent variable
For example: say you have a standard employee survey that asks questions across key categories such as Vision, Transparency, Leadership, and Equipment/Lifestyle. (hint, hint, ask about our Workforce Supercharge framework.) You ask questions like, “my supervisor gives me regular feedback” and “I believe the promotion process is fair,” and so on so forth. Most importantly, you also ask a final, all-encompassing question: “I am satisfied with your job, rate Strongly Disagree to Strongly Agree.”
After you have all the data, run a regression analysis of all the other questions–regular feedback, promotion process–against this single all-encompassing question. We will call this question the dependent variable.
You are looking for strong correlations that will ideally imply causation. For example: if 60% of respondents report “my supervisor does not give me regular feedback” and low job satisfaction, there’s a very strong chance that Leadership is a strong driver of this particular data set’s job satisfaction. In that situation, even if Leadership scored average–say a 3 out of a 5–spending the effort to raise that score of ‘3’ to a ‘4’ may impact job satisfaction more than investing effort on raising an Equipment/Lifestyle score of ‘2’ to ‘3’.
Not the End All Be All, but A Good Guide
Key Driver Analysis is not a magic wand that will miraculously divine your employees’ thoughts. However, it is a more data-centric, quantitative approach to interpreting data than one’s gut-feeling. Key Driver Analysis gives companies deeper insight and potentially helps them from falling into common pitfalls.
LEARN ABOUT: Employee Centricity
Sick of SPSS? Want to get Key Driver Analysis done at a click of a button? Check out QuestionPro Workforce, your one-stop, full-service solution to employee feedback.


