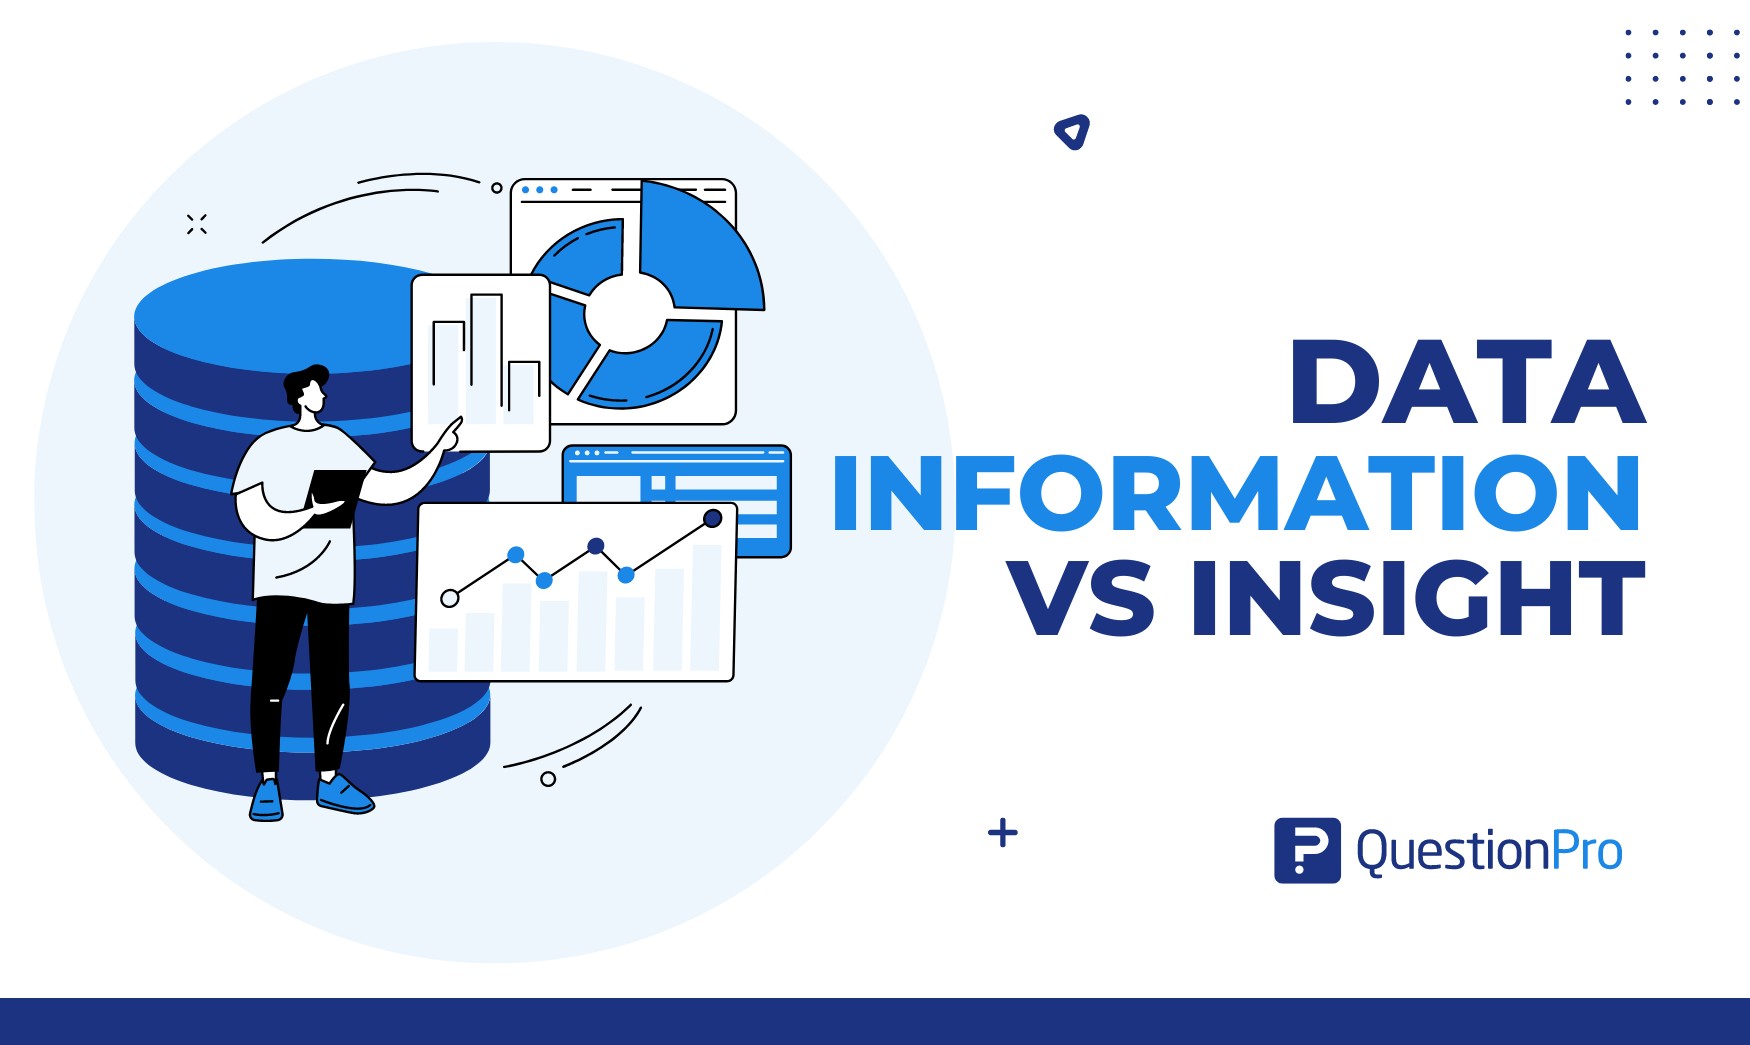
Businesses new to analytics sometimes become confused by the differences between data information vs insight. The differences might seem confusing initially, but they are easy to understand once you see how they work together. Understanding these differences is important to get the most out of analytics and make your program work best for your business.
Here are the three most essential elements of analytics. Once you understand how they work together, you can apply these ideas to your situation and get valuable results from your analytics.
At first, we will learn about data, information, and insight. Then we will go to know how they are different from one another.
What is data?
Data is defined as a collection of facts or figures.. Specific pricing, weights and measurements, addresses, and demographic data like age and name, date and temperature, and distance are all examples of data. There are several ways to collect and present data: text, photos, figures, statistics, graphs, and symbols.
Data is a raw form of knowledge that doesn’t mean or serve anything on its own. You need to interpret data for it to have meaning. Data may appear simple or pointless until it is analyzed, arranged, and comprehended.
There are two types of data we can see:
- Quantitative data
Quantitative data is information that can be measured in numbers or counts, and each data set has its unique number value. Quantitative data, also called numerical data, gives more information about numbers (e.g., how many? Usually? How much?)
This type of data can also be considered a group of measurable information that can be used for mathematical calculations and statistical analysis to help make decisions in the real world.
- Qualitative data
Qualitative or Categorical Data is information that can’t be measured or counted as numbers. These kinds of data are sorted by category, not by number, which is why they are also known as Categorical Data. These data include audio, images, symbols, or text. The gender of a person, such as male, female, or other, is a type of qualitative data.
What is data information vs insight?
Information is the refined form of data, processed and assembled so that people can read and understand. It is defined as knowledge learned through study, communication, research, or instruction.
Information is the result of analyzing and making sense of pieces of data. Data are the specific figures, numbers, or graphs, whereas information is the interpretation of those pieces of data.
Data can only provide helpful knowledge to others when organized and assembled effectively. For example, a piece of data may include temperature measurements from a particular place for many years. Those temps have no meaning without any extra context. However, by analyzing and organizing that data, you may be able to discover seasonal temperature patterns or even broader climatic trends.
Analyzing data and information may help the organization make better choices by generating insights and drawing conclusions. This is the data in its final form, ready for further usage.
Data is a collection of structured and synthesized information using analytics, which is then utilized to get better knowledge or insight into your company. With the help of insights, you may better understand your company and use data analysis to improve it.
For example, a data insight may be that people usually establish an account after spending 5 minutes on your company’s website.
We took a short idea about data, information, and insight. Let’s get into the next section, where we will discuss how they differ and how they will act if we put them together.
Difference of data information vs insight
Though data, information, and insight seem like the same thing, they are not. Now, we will explore the difference between them.
Data is the Foundation
The vast majority of people begin their journey into analytics by understanding data. These are the facts. The facts are unchangeable at any time. For example, on one specific day, fifty consumers purchased a total of forty-five blocks of Velveeta from one particular supermarket. Whatever logic you want to place on it, that is a fact.
If you’ve set up automated data gathering procedures, data such as the SKUs (Stock Keeping Unit sold), the dollar amount, the time of sale, the business’s location, and the payment type are all readily available to you.
Sometimes, data are facts you’ve previously gathered, such as purchase records from your internet store or cash register receipts. For example, surveys may be used to collect data.
Information is the story behind the data
Information adds value to data. This is the point when the data begin to tell a tale. For example, soda, cheese, chocolate, and chips sell a lot more at noon on Sundays in the fall than at any other time. You can see this pattern in your stores and the times of day when they sell the most.
It is generally advantageous to use some level of automation to locate information in data. The more data there is, the more difficult it is to sort through and uncover patterns. Technology allows you to achieve this without using human labor, as long as your data is collected and preserved on purpose.
Insight from analytics
With insight, we may get new perspectives and see new possibilities. Analytics only monetizes your data and generates a return on investment when you make new choices and take further actions.
From the information above, you might be able to determine that your shop’s sales are at their highest every Sunday at noon in the fall because people buy snacks before watching games on TV.
How can you use that insight? You could offer special football-related items or suggest things to buy together, like soda and chips. You could add a football-themed offer to your rewards program to get people to buy more so they can get something for free.
This insight will ensure your business is properly staffed for the Sunday pre-game rush. Employees may be briefed on usual pre-football purchases in the aisles, or an additional football-related element can be placed at the front door. The aim is to transform the original data into something that helps you achieve your company objectives, such as boosting weekend income.
Now that we know how data, information, and insight differ, let’s find out how they work together from the information given below.
How they work together
Data, information, and insight are the foundation of any comprehensive analytics solution. As raw data is collected, it is turned into a readable form known as information, which is then used to generate insights that can be used to make critical business decisions.
Assume you’ve posted a piece of material on social media and anticipate a particular number of likes, shares, and comments. Your data is this post’s number of likes, shares, and comments.
When this data is combined with other social media engagement statistics, such as the number of followers, shares, and comments, a business can determine which social engagement measures are most effective for rating the post. That is the data information you obtain. You can acquire insight from this information and select which matrices you should focus on to engage your audience more successfully.
Conclusion
From the above exploration, we learned about data information vs. insight. According to our discussion, data is the raw material from which information is formed. Even if we don’t get anything new or profound out of this data, it’s still valuable. However, if we do, we’ll have gained insight.
If you are searching for software that will manage data for your organization, QuestionPro is there for you. Organizations across the globe are using data management software to utilize their data, information, and insight to improve their working process. QuestionPro also has the software InsightsHub to manage data better, shorten the time to insights, and boost historical data use while lowering costs and improving ROI.
With InsightHub, you can manage and utilize your data for better purposes. QuestionPro experts are always ready to help you with your data management process.


