
Market research is at the forefront of decision-making for brands, researchers, and individuals. Surveys form an integral part of the research process. Depending on the various factors like complexity, tools to conduct research, budgets, and time to insights, each research study varies in how it is conducted! The only constant steps in research studies are the survey, data collection, dashboarding, and analysis.
Survey creation and data collection receive a lot of impetus, but often, splicing up the data, representing it, and dashboarding and charting take a back seat. Making sense of data in easy-to-understand charts and graphs and then presenting the data to actually co-create with your respondents is critical. Creating charts and representing data has traditionally taken weeks if not days.
With QuestionPro BI, you can now reduce your time to smart dashboards within minutes from right inside the QuestionPro ecosystem.
What is QuestionPro BI?
QuestionPro BI is an intuitive data visualization and charting solution designed to unlock actionable insights and intelligent reporting from native QuestionPro surveys. Built with artificial intelligence at its core, this innovative tool empowers users to harness the power of data and plot interactive yet smart dashboards from qualitative and quantitative data.
Gone are the days of spending hours manually processing and analyzing survey data. With QuestionPro BI, the process is streamlined, allowing you to focus your time and energy on deriving meaningful insights. Whether you’re a seasoned researcher or a novice user, the intuitive interface of QuestionPro BI makes it easy to create customized dashboards tailored to your specific needs.
Built on our proprietary QxBot engine, which has artificial intelligence at its core, QuestionPro BI makes dashboarding and statistical analysis a breeze.
Users leveraging the power of QuestionPro BI are reporting an 85% time benefit in conducting statistical analysis and creating dashboards.
You no longer have to enter your survey data into a business intelligence tool, wasting time, effort, and manpower. Within the QuestionPro ecosystem, you can now build smart dashboards from our suite of products, namely the surveys and research platform, the CX platform, and the Workforce platform.
Are you curious about our platform? Discover the numerous features of QuestionPro BI in this amazing video! 👇
With a free trial of the QuestionPro BI platform, unlock the magic of transforming your survey data into smart dashboards within minutes.
What can QuestionPro BI do for you?
From building baseline dashboards with a simple point-and-click model to advanced dashboarding, there is something in the tool for everyone. As a novice researcher to full-scale research teams, the tool does the heavy lifting for your statistical analysis.
You can use QuestionPro BI as below:
Generating reports
Generate manually customized dashboards tailored to your specific needs or leverage QxBot for an automated data population. With the flexibility of intelligent dashboards, effortlessly refine and adjust your visualizations to reveal actionable insights that resonate with your brand’s objectives. Streamline your analysis process and uncover the most relevant findings with intuitive dashboard customization options.
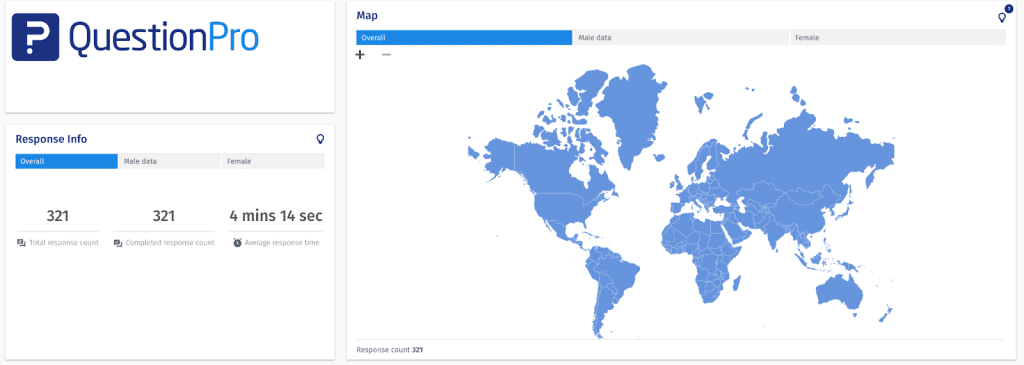
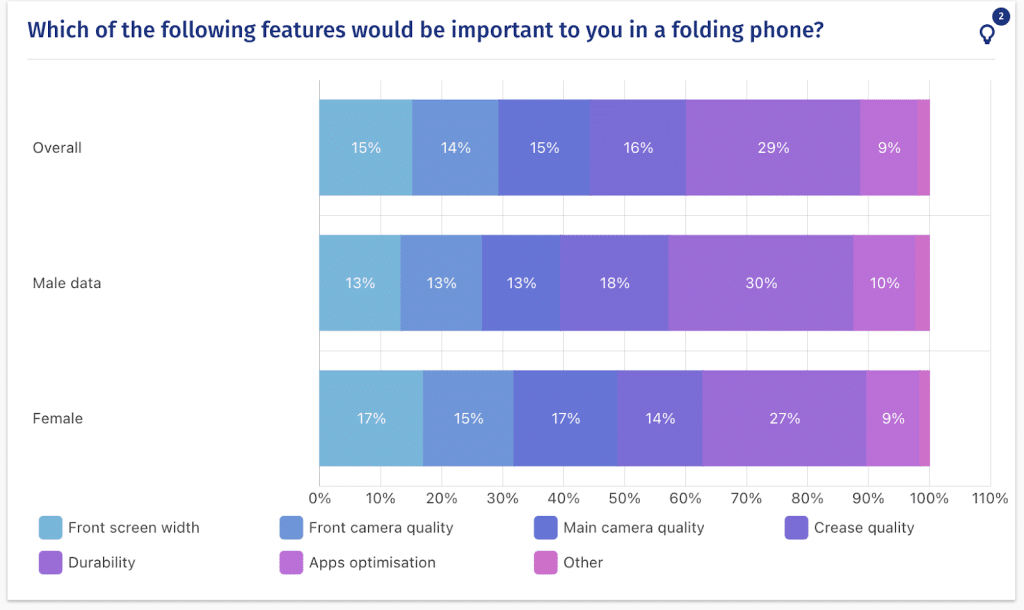
Tailor your dashboards to your preferences by adjusting colors, splicing data, and selecting chart types that best suit your requirements. With complete customization capabilities, you can showcase your data exactly as desired, enabling you to surface the most relevant insights in a format that aligns with your preferences and objectives. Whether highlighting specific metrics or visualizing trends, you have full control over how your data is presented, empowering you to create dashboards that effectively communicate your message.
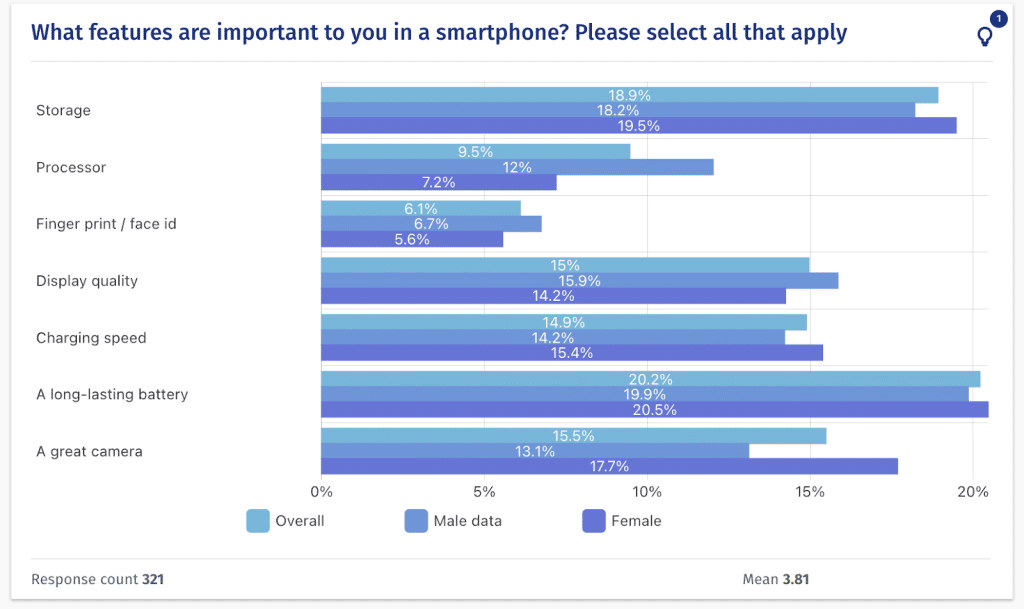
Interactive visualization
Customize your charts to reflect your brand’s colors, craft interactive visualizations for dynamic reporting, and present your data in a manner that provides actionable insights. With the ability to tailor every aspect of your charts, you can ensure that your visualizations align with your brand identity and effectively convey key insights to your audience. By leveraging interactive features, you can enhance engagement and empower stakeholders to explore the data more deeply, enabling informed decision-making based on clear, impactful visualizations.
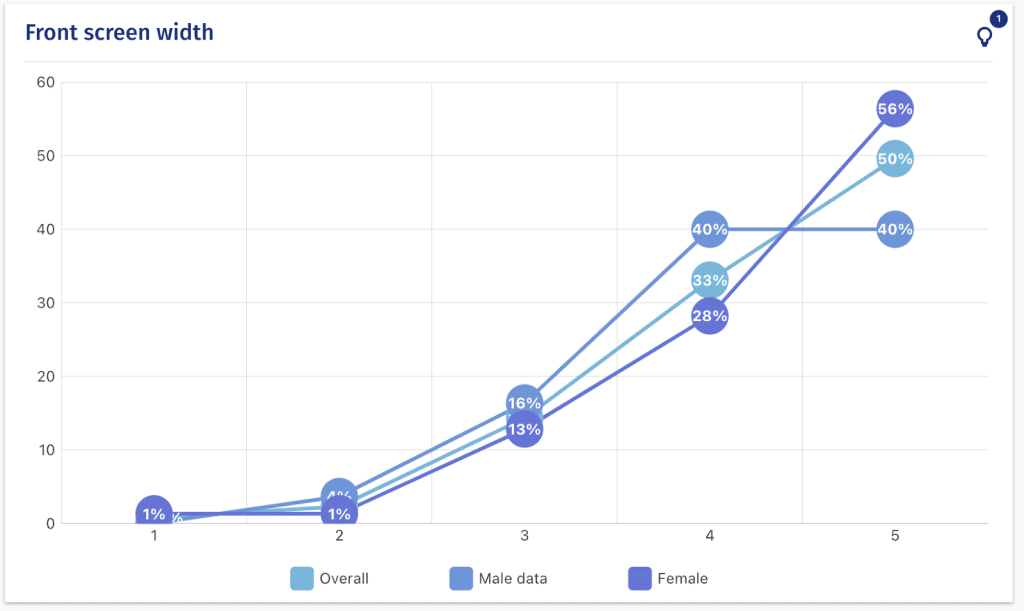
AI linked dashboards
Leverage the power of AI and our QxBot engine to swiftly construct dashboards in mere minutes. Employ QxBot to effortlessly extract insights with a single click, providing you with a comprehensive overview of your report. Enhance your dashboards with your own insights, allowing generative AI to seamlessly consolidate data and insights into digestible information nuggets, streamlining your analytical process and empowering you to make informed decisions quickly.
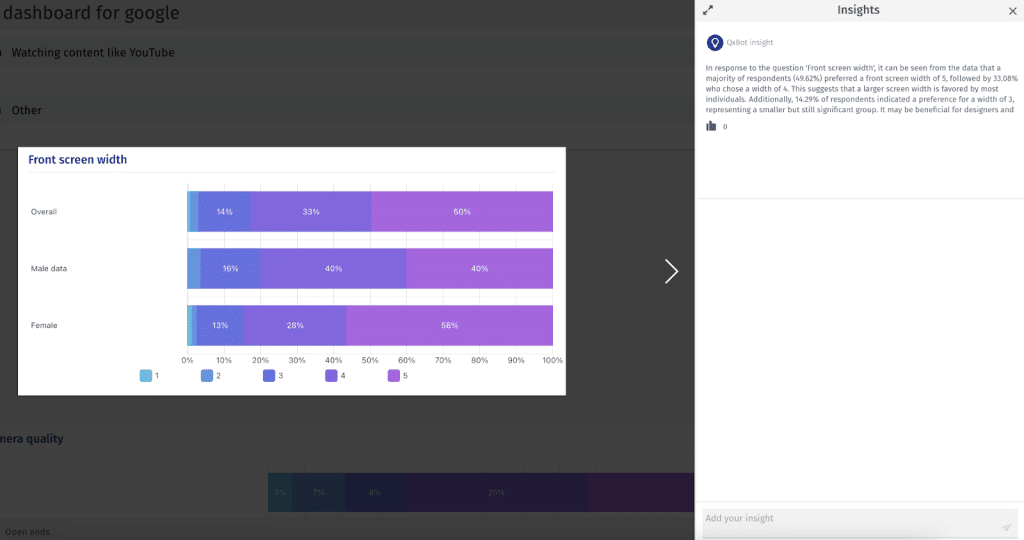
Create and distribute dashboards tailored to specific roles, ensuring accessibility for multiple stakeholders. Leveraging advanced data presentation features, BI empowers insights teams to craft engaging presentations that succinctly convey research findings to stakeholders, facilitating improved comprehension and decision-making processes.
Advantages of QuestionPro BI
To fully grasp the power of QuestionPro BI and how it can transform your research projects, you can get started with a free platform trial. Some salient advantages that you will immediately notice are:
- Seamless integration with QuestionPro products: QuestionPro BI works across your existing QuestionPro suite and licenses. Talk to your customer representative to get you started within minutes.
- No need to integrate external BI tools: To reduce your efforts and time, we have built QuestionPro BI right within our existing product suite. You no longer have to look elsewhere to harness the power of BI and AI.
- Fully customizable dashboards and widgets for your brand: With QuestionPro BI, you can customize your dashboards to meet your specific reporting requirements and brand aesthetics.
- Qualitative and quantitative data support: Get dashboards and statistical analysis from quantitative and qualitative data to stay within one ecosystem for your statistical analysis.
- Simplistic UX: Using QuestionPro BI doesn’t take any learning or training. The UX is so simple that you can get started as soon as you enter the platform!
- Data splicers on tab and widget levels: Splice up the data for key demographic representation at the tab and widget levels to surface the data that really matter.
- Sentiment trendline: Track sentiment trends over time with built-in sentiment trendlines, allowing you to gauge changes in customer sentiment effortlessly.
Start using QuestionPro BI in your projects right away!
This tool is now available within the QuestionPro platform, adding to the wide range of features and platforms that make conducting research projects simple and effective. If you already have a QuestionPro account, you can explore it and discover the power of visualizing your data. Below, we explain the step-by-step process to achieve this.
Don’t have a QuestionPro account yet? No problem! You can start with a free QuestionPro Research Edition trial and experience the power of our tools firsthand.
Using QuestionPro BI is straightforward. If you already have an account, simply click on the following access link:
QuestionPro BI will be free until the end of the year, so you have a great opportunity to discover its full potential.
Once you’ve entered your registration information, you’ll be presented with the following screen:
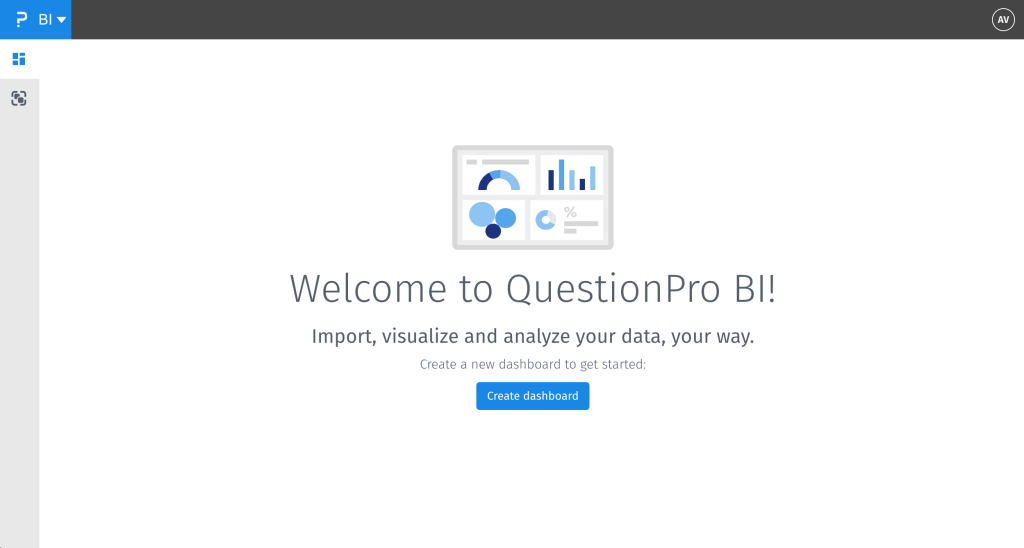
Once inside the platform, it’s very intuitive, and there are just a few steps left to start experiencing the magic of visualizing your data in an incredible way.
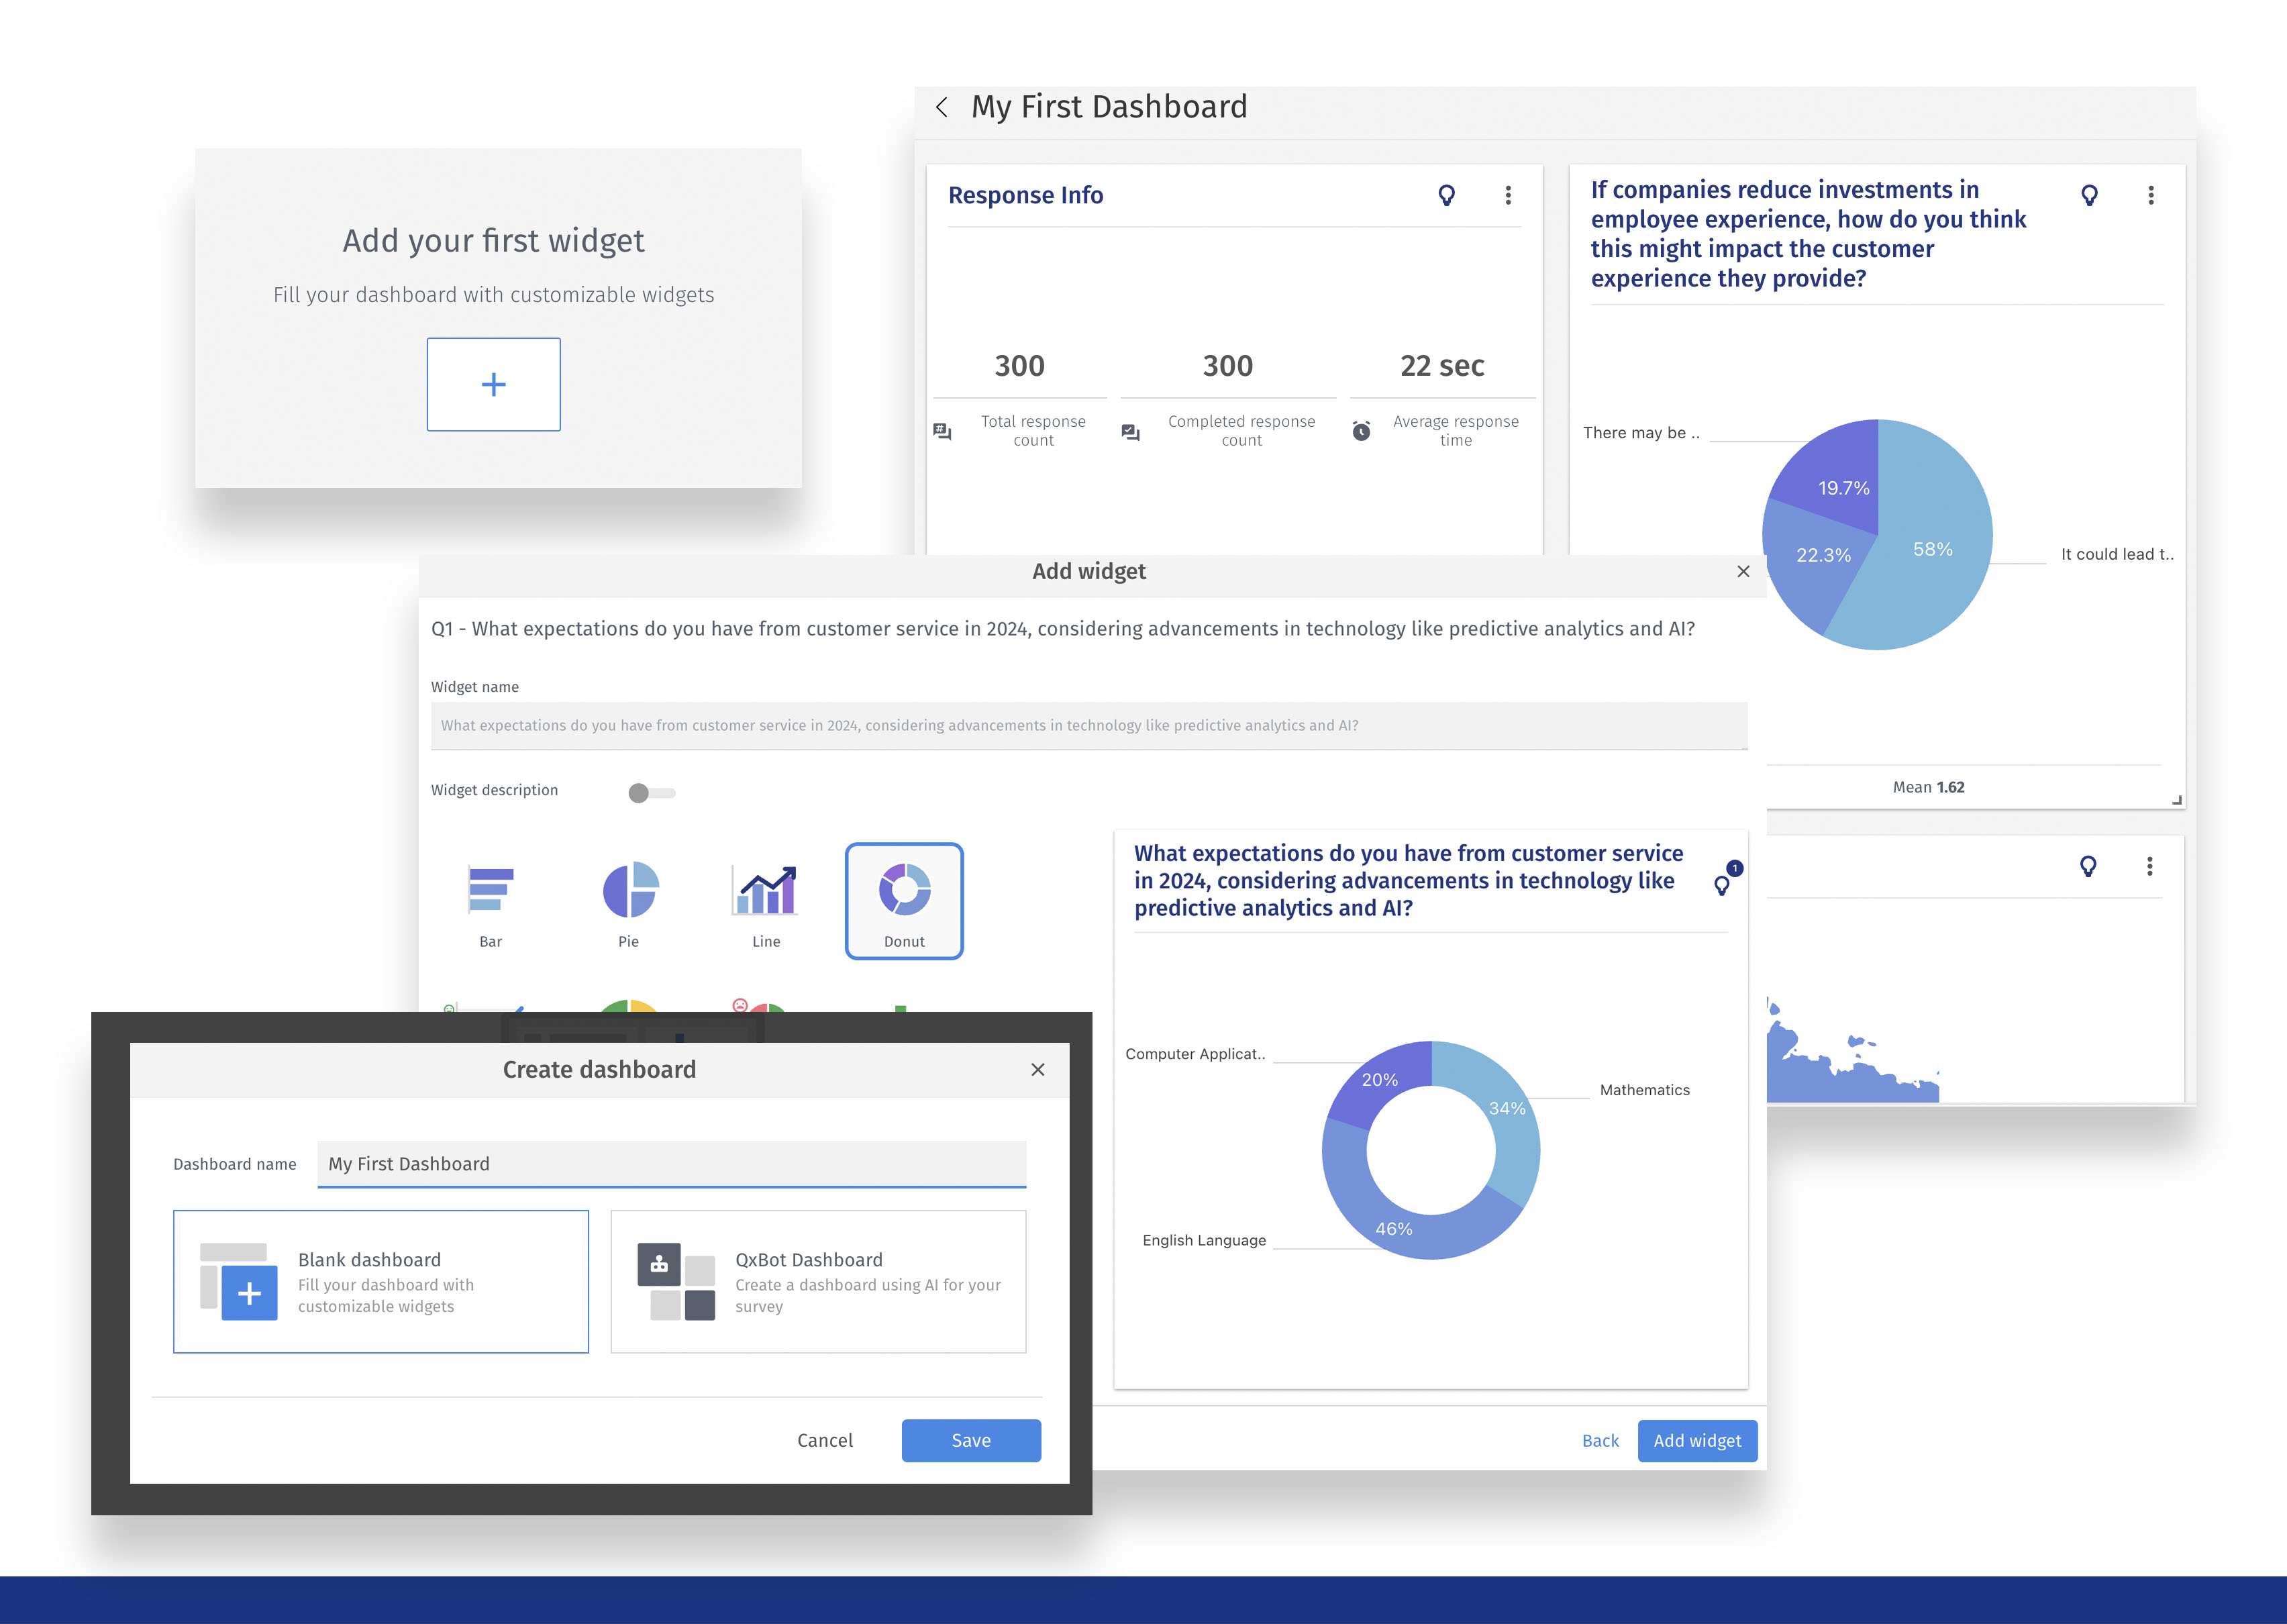
Start with a blank Dashboard or use QxBot Dashboard, our AI tool for automatically generating dashboards. From there, simply select your data sets and the widgets you need. Once your data is in place and formatted correctly, you can drag and rearrange elements and, if desired, change the color palette to align your dashboard with your brand.
QuestionPro BI is a game-changer for researchers and insights professionals looking to unlock the full potential of their survey data. QuestionPro BI empowers you to make smarter decisions and drive meaningful outcomes for your organization by enabling you to transform raw data into actionable dashboards within minutes. Experience the power of data visualization with QuestionPro BI today and take your research to the next level.
If you already have an account with QuestionPro, simply login to BI QuestionPro. It’s free for now, and you can enjoy all its benefits. If you don’t have an account with us but are interested in exploring this tool, start with a 15-day trial; no credit card is required. Get started now!


