The Super Bowl isn’t just a football game—it’s a cultural phenomenon. Millions of fans rally behind their teams each year, businesses capitalize on the event’s economic boom, and cities become hubs of electrifying energy.
Understanding fan sentiment and spending behavior helps marketers, brands, and analysts predict trends, tailor campaigns, and gauge the economic impact of major sporting events like this one.
The data obtained in Philadelphia and Kansas City reveal fascinating insights about loyalty, perception, and financial impact, as highlighted in a recent survey by QuestionPro. This study provides a deeper understanding of how both cities’ fans prepare for the big game.
Here are some fascinating insights in the face of such high-stakes matchups.
How was this data collected?
The QuestionPro Market Research Services Team conducted this survey online from December 13 to 17, 2024, with 999 U.S.-based respondents. Each participant was double-verified, and their contact information is securely stored with QuestionPro.
The study maintains a margin of error of ±3.1% at a 95% confidence level.
Key Demographics
- Total Responses: 999
- Gender: Male (37.6%), Female (61.5%)
- Age Distribution:
- 18–24: 10.3%
- 25–34: 15.9%
- 35–44: 21.6%
- 45–54: 18.2%
- 55–64: 16.3%
- 65+: 17.6%
- Employment Status:
- Full-time employed: 39.2%
- Part-time employed: 12.3%
- Self-employed: 8.4%
- Retired: 20%
- Unemployed: 20%
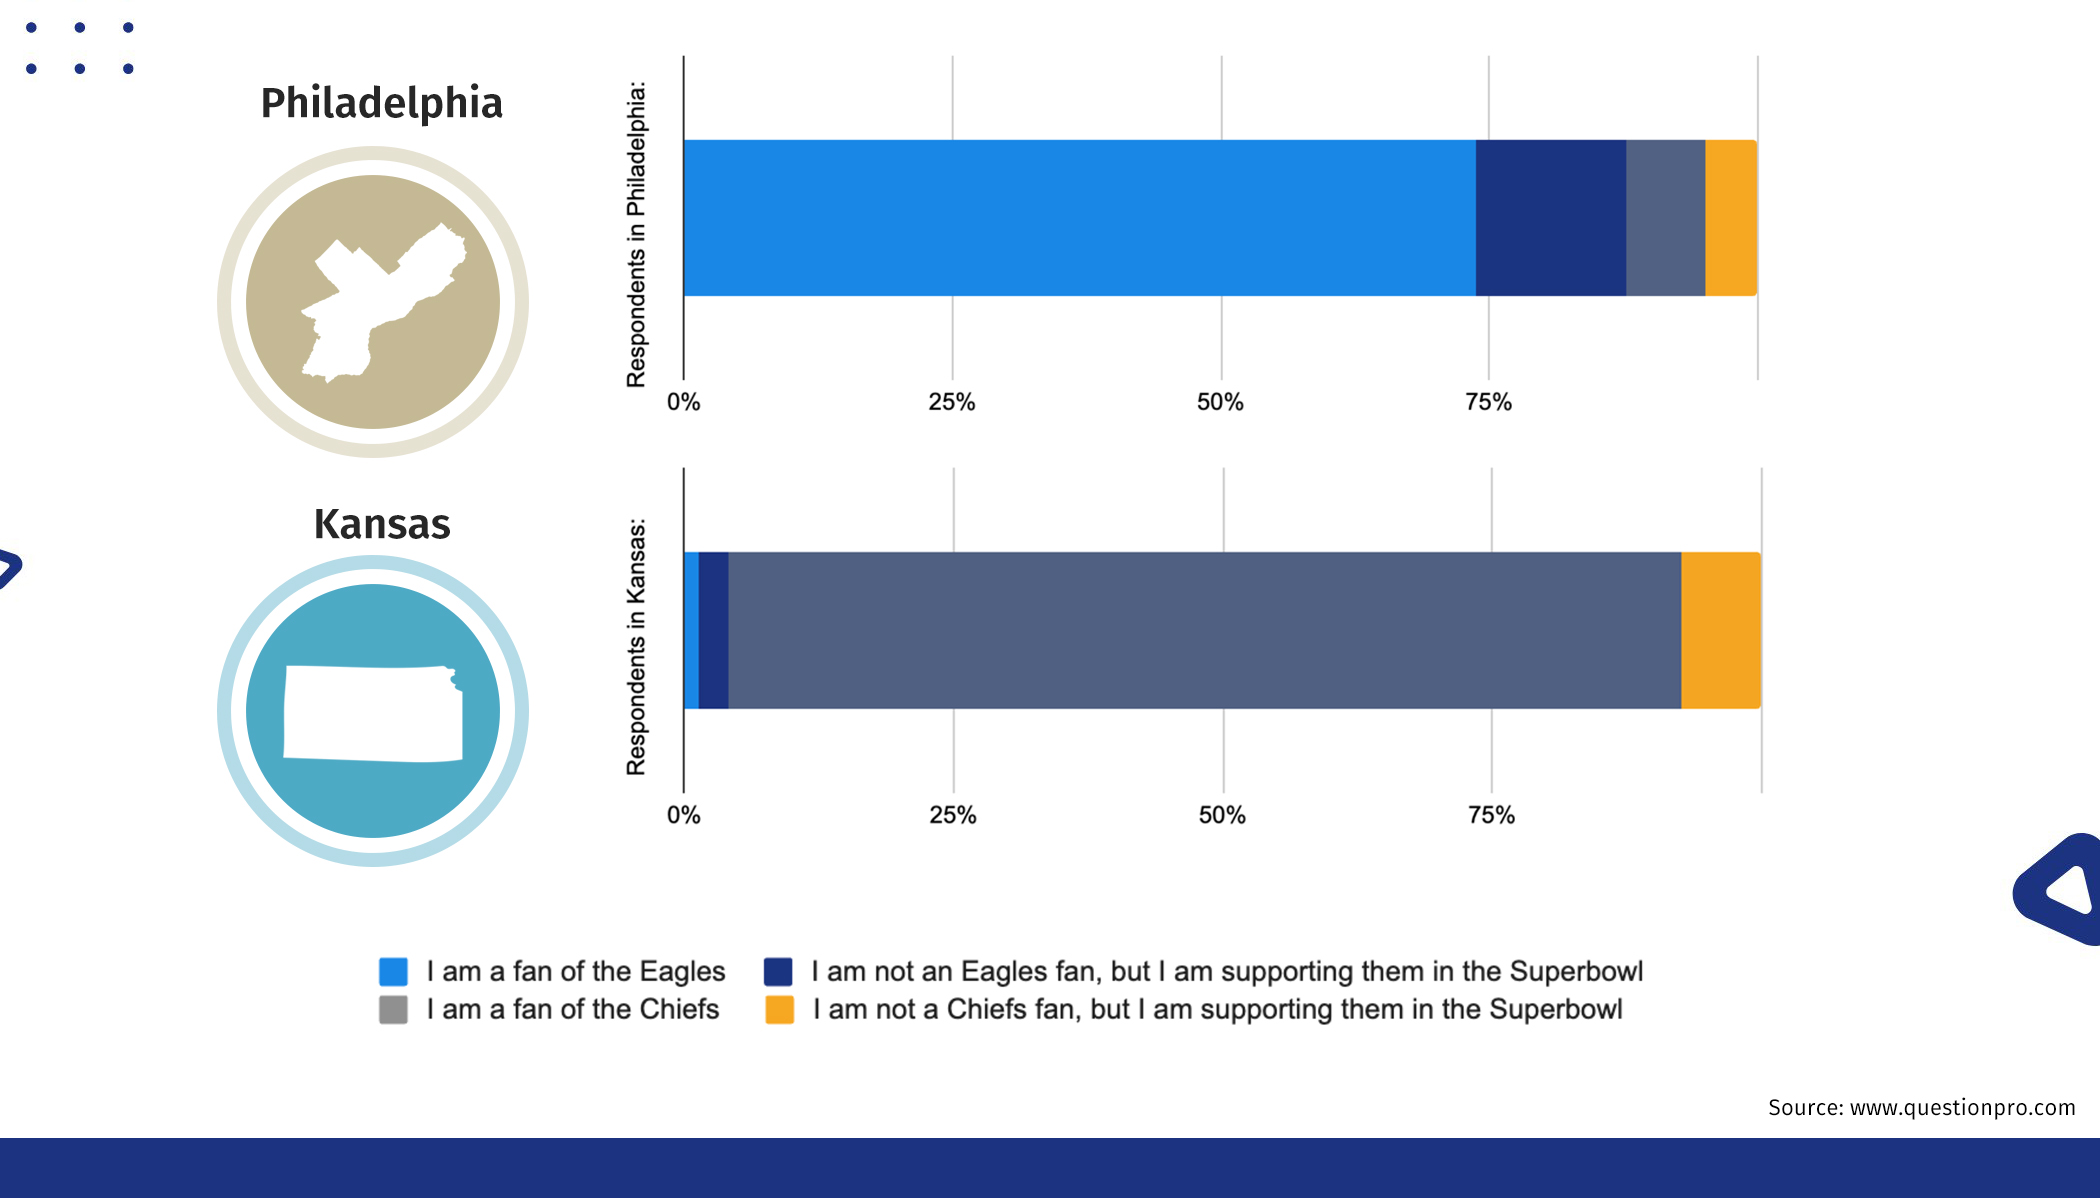
Fan Loyalty: Kansas City vs. Philadelphia
When it comes to fandom, Kansas City fans are unwavering in their support of the Chiefs. An overwhelming 96% of residents are either fans or actively supporting their team in the Super Bowl. Meanwhile, in Philadelphia, 87% of residents back the Eagles, with 12% declaring allegiance to the Chiefs.
Interestingly, Kansas City has a significantly smaller percentage (4%) of Eagles fans.
What are the primary reasons for supporting a team outside their hometown? Current players, team colors, and personal relationships play key roles.
Philadelphians supporting the Chiefs cite current players and even team colors as influencing factors, while Eagles supporters in Kansas City also list “some other reason” as a top motivator.
Super Bowl Plans and Predictions
A vast majority of respondents (94%) plan to watch the game, with most sticking to their original viewing plans despite their teams making it to New Orleans. Around 5% of fans in both cities have decided to travel to the game, while approximately a quarter have changed their local viewing locations.
| Response Option | Philadelphia Respondents | % | Kansas City Respondents | % |
| Yes, I’m now traveling to New Orleans to watch the Superbowl | 24 | 5.1% | 19 | 4.0% |
| Yes, I plan to now watch the Superbowl at a different (local) location | 118 | 25.3% | 122 | 25.9% |
| No, my Superbowl watch plans have not changed | 304 | 65.1% | 310 | 65.7% |
| I’m not sure yet | 21 | 4.5% | 21 | 4.5% |
How confident are the fans?
Predicting the game’s outcome, Kansas City fans exhibit overwhelming confidence—95% believe the Chiefs will secure a historic three-peat. Philadelphia fans, while optimistic, show slightly less certainty, with 83% believing the Eagles will claim victory.
Spending Trends: How Much Are Fans Investing in the Game?
Fans staying local for the Super Bowl budget around $175 on average for game-day essentials, including food, décor, team merchandise, and attire.
Spending increases dramatically for those traveling to New Orleans, with an average individual expense nearing $2,800, covering tickets, lodging, merchandise, and game-day outfits. When scaled up to the anticipated Superdome attendance of 79,000, this translates into a staggering $220 million in revenue from tickets, travel, and merchandise sales alone.
| Spending Category | Local Viewers ($) | Travelers to New Orleans ($) |
| Food | 69.05 | – |
| Décor | 25.90 | – |
| Super Bowl Merchandise | 51.36 | 307.78 |
| Outfit | 28.60 | 190.46 |
| Game Tickets | – | 1,382.50 |
| Travel & Lodging | – | 909.10 |
| Total Average Spend | $174.91 | $2,789.84 |
The Day After: Super Sick Monday?
Despite the hype, nearly 60% of respondents in both cities do not plan to take the Monday after the game off. However, a notable portion (22-24%) is ready to celebrate—or recover—regardless of the outcome.
| Response Option | Philadelphia Respondents | Kansas City Respondents |
| Win or lose, absolutely! | 105 (22.5%) | 115 (24.4%) |
| Only if my team wins | 77 (16.5%) | 78 (16.5%) |
| Only if my team loses | 6 (1.3%) | 5 (1.1%) |
| Absolutely not, win or lose, life goes on | 279 (59.7%) | 274 (58.1%) |
Want More Insights?
This study offers profound insights into fan behavior, spending habits, and regional differences in Super Bowl traditions. To learn the numbers behind this article, download the full report to explore all the key findings and data points that define the 2025 Super Bowl experience!