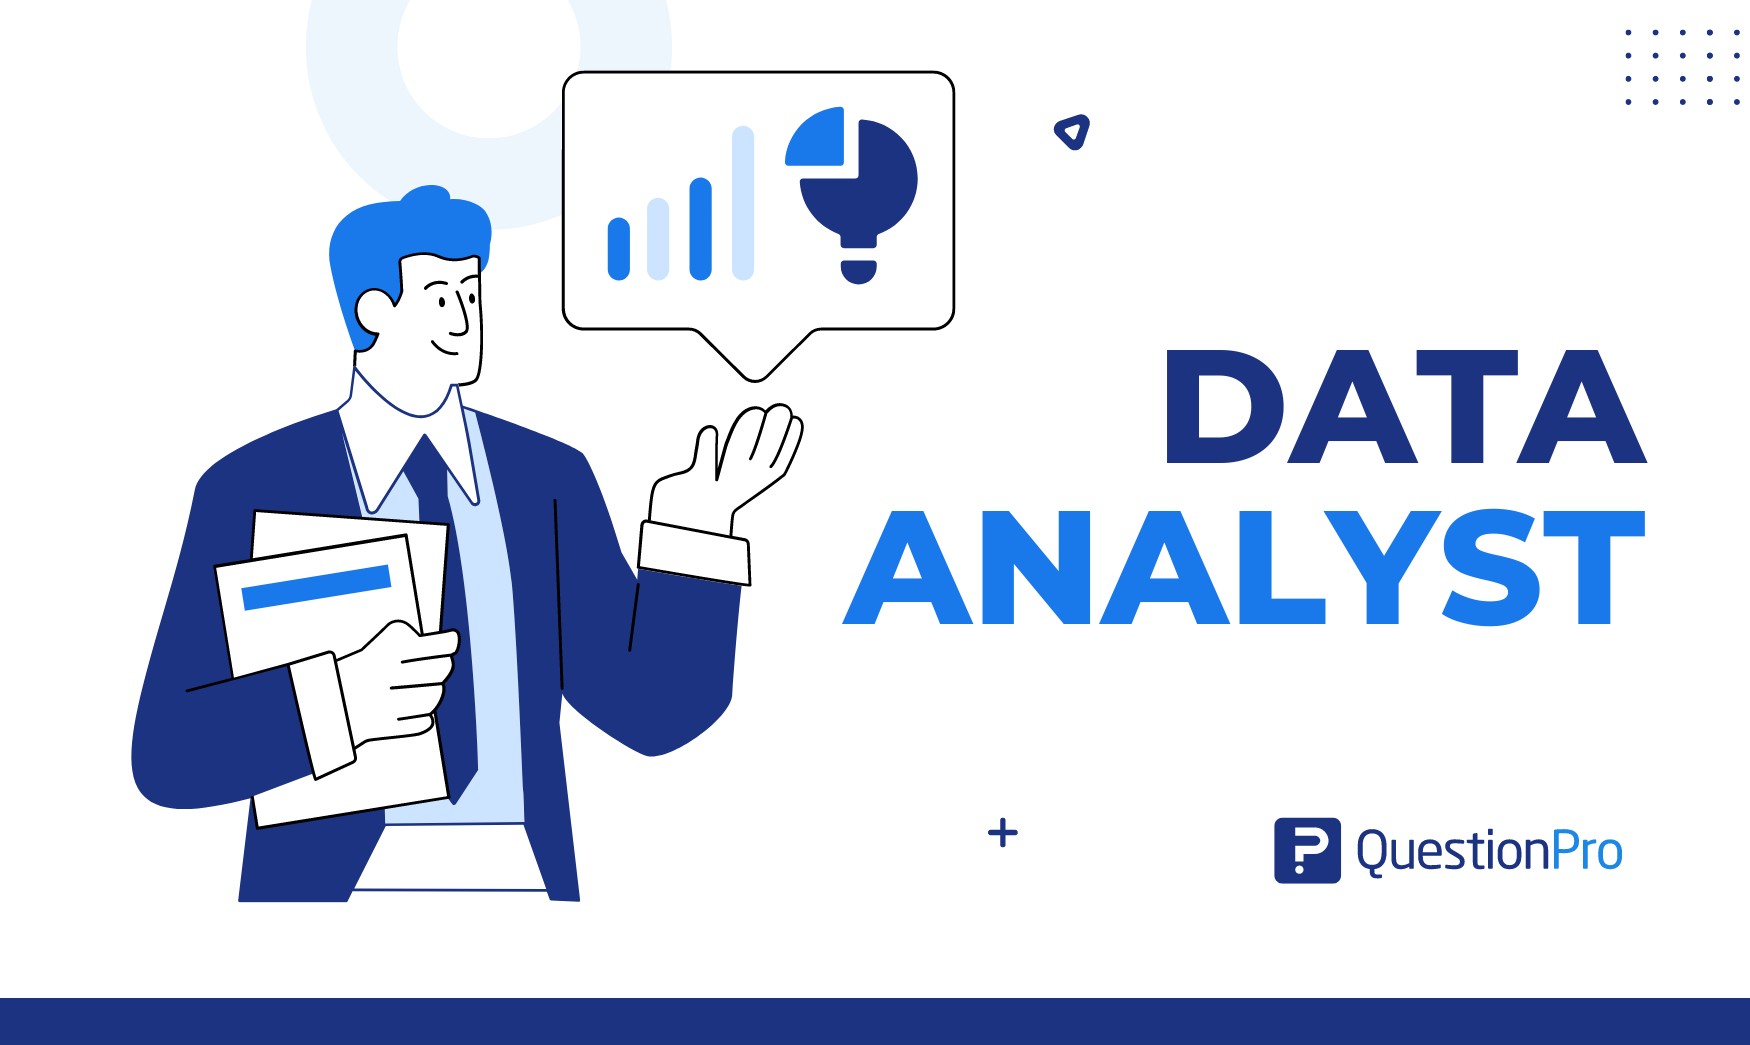
In our increasingly data-driven world, a data analyst has become essential to businesses in every industry. Like modern-day detectives, they delve into vast datasets to extract insights that guide vital strategic decisions.
They transform raw data into valuable market intelligence, enabling companies to identify trends, address challenges, and make informed, impactful choices. Whether it’s optimizing marketing strategies, improving customer experiences, or enhancing operational efficiency, data analysts are at the forefront of these initiatives.
What is Data Analytics?
Data analytics encompasses a broader scope, including the entire data lifecycle from collection to interpretation. It involves analyzing data and applying algorithms, data mining, predictive models, and other advanced techniques to forecast future outcomes and make proactive, data-driven decisions.
Data analytics can be descriptive, diagnostic, predictive, or prescriptive:
- Descriptive Analytics: What happened?
- Diagnostic Analytics: Why did it happen?
- Predictive Analytics: What will happen?
- Prescriptive Analytics: What should we do about it?
While data analysis is often a component of data analytics, data analytics goes further by using data to anticipate trends and make recommendations for future actions.
What Does a Data Analyst Do?
A data analyst is a professional who specializes in examining, interpreting, and transforming data to provide insights and support decision-making. Their role involves working with data to uncover trends, patterns, and anomalies that can report business intelligence strategies and operations.
Data analysts play a vital role in transforming raw data into actionable insights. Here’s a breakdown of their primary responsibilities:
Data Collection
Gather data from various sources, such as databases, spreadsheets, or external data providers. It involves collecting data from different platforms and ensuring that the organization’s data is comprehensive and relevant for analysis.
Data Cleaning
Provide accurate and consistent data by identifying and correcting errors, removing duplicates, and handling missing values to a data analyst. Proper data cleaning is essential to prepare the data for precise interpretation and to avoid misleading results.
Data Transformation
Prepare the data for analysis by structuring and organizing it. This may involve converting data into different formats or aggregating data from multiple sources. Effective data transformation helps make the data suitable for detailed analysis and interpretation.
Data Visualization
Create visual data presentations, such as charts, graphs, and dashboards, to make complex relevant information more accessible and understandable. Data visualization helps in communicating insights effectively and enables stakeholders to interpret data easily.
Data Analysis
Apply statistical methods and analytical techniques to explore and interpret the data. It includes creating descriptive statistics, identifying trends, and performing exploratory data analytics. Analyzing data allows data scientists and analysts to extract meaningful insights and address specific business questions.
Reporting
Compile findings into reports or presentations for stakeholders, highlighting key insights and recommendations based on the analysis. Effective reporting translates data analysis into actionable recommendations, aiding critical business decisions.
Problem Solving
Use data to address specific business questions or challenges, providing actionable insights to drive critical business decisions. Data analysts and scientists solve problems by leveraging data to uncover solutions and support strategic planning.
Tool Utilization
Utilize various data analysis tools and software (e.g., Microsoft Excel, SQL, Python, R, Tableau) to analyze data and create data visualizations. Mastery of these tools is essential for analyzing and interpreting data efficiently and effectively.
Data analysts use various tools and technologies, such as Microsoft Excel, SQL, Python, R, and data visualization software (e.g., Tableau), to perform their tasks effectively. Their work is crucial in supporting organizations in making data-driven decisions and improving overall performance.
Must Need Skills to Be A Data Analyst
To be an effective data analyst, there are several essential skills you should develop:
- Statistical Analysis: Understanding statistical methods and techniques is crucial for interpreting data and identifying trends.
- Data Manipulation: Proficiency in cleaning and preparing data using tools like Excel or programming languages such as Python and R.
- Data Visualization: Ability to create clear and informative visualizations using tools like Tableau, Power BI, or Matplotlib to present data insights effectively.
- Programming Skills: Knowledge of programming languages such as Python or R for data manipulation, analysis, and automation.
- Database Management: Familiarity with SQL for querying and managing data in relational databases.
- Excel Proficiency: Advanced skills in Excel for data analytics, including functions, pivot tables, and macros.
- Problem-Solving: Strong analytical and problem-solving skills to address complex business questions and challenges.
- Attention to Detail: Careful attention to data accuracy and integrity to ensure reliable analysis results.
Developing these skills will help you excel as a data analyst and contribute valuable insights to your organization.
What are Necessary Tools for Data Analysts?
For data analysts, several tools are essential to effectively perform various aspects of data analysis. Here are some basic tools:
1. Data Analysis and Manipulation
- Excel: Excel is widely used for its ease of use in data manipulation, analysis, and visualization through formulas, pivot tables, and charts.
- SQL: Essential for querying and managing relational databases to extract and manipulate data.
- Python: A universal programming language with libraries like Pandas, NumPy, and SciPy for data analysis and manipulation.
2. Data Visualization
- Tableau: An essential tool for creating interactive and shareable dashboards and visualizations for data analyst works.
- Power BI: Microsoft’s tool for data visualization and business intelligence that integrates with other Microsoft products.
- Matplotlib and Seaborn: Python libraries create static, animated, and interactive visualizations.
3. Data Management and Storage
- SQL Databases: MySQL, PostgreSQL, and Microsoft SQL Server for managing and querying large datasets.
- NoSQL Databases: Like MongoDB or Cassandra for handling unstructured or semi-structured data.
4. Statistical Analysis
- SPSS: A statistical software used for data management and advanced statistical analysis.
- SAS: A software used for advanced analytics, multivariate analysis, business intelligence, and data management.
5. Business Intelligence (BI)
- Looker: A BI tool for data exploration and visualization.
- QlikView/Qlik Sense: BI tools for interactive data exploration and visualization.
6. Other Useful Tools
- Git/GitHub: This is for version control and collaboration on code and analysis projects.
- Apache Hadoop: This is used to handle large-scale data processing.
- QuestionPro Research Suite: A comprehensive tool for survey creation, data collection, and analysis, providing insights into customer feedback and market research.
Familiarity with these tools will help you efficiently manage, analyze, and visualize data, making it easier to derive actionable insights and support decision-making.
How to Become a Data Analyst With Leadership Skills
Becoming a data analyst involves a combination of education, skill development, and practical experience. Here’s a step-by-step guide to help you get started:
- Education: Obtain a relevant bachelor’s degree (e.g., Data Science, Statistics) and consider certifications like Microsoft Certified: Data Analyst Associate or Google Data Analytics Professional Certificate.
- Skills Development: Learn statistical analysis, programming (Python or R), data manipulation (Excel, SQL), and data visualization (Tableau, Power BI).
- Practical Experience: Gain hands-on experience through internships, personal projects, or freelancing.
- Portfolio Building: Create a portfolio showcasing your projects and use GitHub to share your work.
- Networking: Join professional groups, attend industry events, and connect with other professionals.
- Job Application: Customize your resume and prepare for interviews by highlighting relevant skills and experience.
- Continual Learning: Stay updated with new tools and consider advanced courses or degrees to deepen your expertise.
By following these steps, you can build a solid foundation and position yourself for a successful career as a data analyst.
Tips to Become a Data Analyst
Here are some practical tips to help you become a successful data analyst:
1. Gain Practical Experience
Work on Real Projects: Engage in projects that involve real-world data to apply what you’ve learned and build a portfolio. Look for internships, freelance work, or volunteer opportunities.
Create a Portfolio: Showcase your work through a portfolio highlighting your projects, methodologies, and results. It can be a powerful tool for data analysts when applying for jobs.
2. Use the Right Tools
Familiarize Yourself with Tools: Learn how to perform data analysis tools and software, such as Excel, SQL, Tableau, Power BI, and others relevant to the industry.
Stay Updated: Technology and tools evolve rapidly, so keep your skills current by exploring new tools and updates in the field.
3. Develop Analytical Thinking
Practice Problem-Solving: Work on developing your analytical and critical thinking skills. Practice solving different types of data problems and interpreting results.
Question Assumptions: Be curious and question assumptions to ensure the validity and reliability of your analysis.
4. Enhance Communication Skills
Communicate Insights Clearly: Learn how to present your findings in a clear and concise manner, both verbally and through visualizations.
Customize Your Reports: Adapt your reports and presentations to the needs and understanding of your audience, whether technical or non-technical stakeholders.
5. Network and Seek Mentorship
Connect with Professionals: Join data science and analytics communities, attend industry events, and network with professionals to gain insights and advice.
Find a Mentor: A mentor can provide guidance, feedback, and support as you navigate your career path.
6. Stay Curious and Keep Learning
Pursue Continuous Education: Take online courses, attend workshops, or pursue additional certifications to keep your technical skills sharp and stay ahead of industry trends.
Read and Research: Stay informed about the latest trends, research, and best practices in data analysis.
By following these tips, you can build a strong foundation, gain valuable experience, and position yourself for success as a data analyst.
Data Analyst vs. Data Scientist
While related, the roles of a data analyst and data scientist have distinct focuses and responsibilities. Here’s a comparison to highlight their differences and similarities:
| Perspective | Data Analyst | Data Scientist |
| Primary Focus | Analyzing historical data to provide insights. | Building predictive models and advanced analysis. |
| Key Responsibilities | Data collectionData cleaningReportingDescriptive analysis | Data exploration and modelingMachine learningAlgorithm developmentAdvanced statistical analysis |
| Skills and Tools | SQL, ExcelBasic Python or RData visualization tools (Tableau, Power BI)QuestionPro Research Suite | Advanced Python or RMachine learning libraries (Scikit-learn, TensorFlow)Big Data tools (Hadoop, Spark)QuestionPro Research Suite |
| Typical Use Cases | Trend analysisCustomer insightsOperational efficiency | Predictive modelingRecommendation systemsAlgorithm development |
| Business Impact | Provides actionable insights for immediate decision-making. | Develops models and algorithms for long-term strategic advantages. |
Both data analysts and data scientists are crucial in the data ecosystem, with data analysts providing actionable insights from historical data and data scientists creating models to predict future trends and guide strategic business decisions.
How QuestionPro Research Suite Can Help a Data Analyst
The QuestionPro Research Suite offers significant advantages for data analysts through its comprehensive features:
1. Comprehensive Data Collection
It simplifies survey creation, allowing data analysts to design and deploy surveys with various question types and customization options. The platform supports data collection from multiple sources, including online, mobile, and offline methods, all integrated into one system.
2. Advanced-Data Analysis
- Real-Time Analytics: Analyze survey responses in real-time to gain immediate insights and track trends as they emerge.
- Statistical Analysis: Utilize built-in statistical tools to perform advanced analyses, such as cross-tabulations, correlation, and regression analysis.
3. Enhanced Data Quality
The software integrates with different tools and systems, such as CRM and data management platforms, streamlining workflows and enhancing analysis. API access further allows for programmatic management of surveys and data.
4. Powerful Data Visualization
- Dynamic Dashboards: Create interactive dashboards to visualize data trends, patterns, and key metrics, making it easier to interpret complex datasets.
- Custom Reports: Generate customizable reports with charts, graphs, and tables to communicate findings to stakeholders effectively.
5. Collaboration and Sharing
It supports team collaboration by sharing data and reports with colleagues and stakeholders. It ensures that everyone involved can access and discuss relevant insights.
By leveraging the features of QuestionPro Research Suite, data analysts can streamline their data collection processes, enhance their analysis capabilities, and communicate insights more effectively, leading to better-informed decisions and strategic outcomes.
Conclusion
A data analyst helps organizations make informed decisions, optimize processes, and drive strategic initiatives by transforming raw data into actionable insights. A successful data analyst combines technical skills, such as statistical and predictive analysis and programming, with strong problem-solving abilities and effective communication.
Embracing essential tools and technologies and continually developing technical skills through practical experience and education further enhances their ability to deliver valuable insights. As businesses increasingly depend on data to navigate complex challenges and opportunities, the high demand for skilled data analysts is set to grow, making it a dynamic and rewarding career path.


![[CX]-TCXT-closing-the-loop](https://www.questionpro.com/blog/wp-content/uploads/2025/06/CX-TCXT-closing-the-loop.jpg)