Results and Analytics: Dive Into the Insights with LivePolls
LivePolls doesn’t just engage your audience—it empowers you to understand them better. With dynamic reporting capabilities, LivePolls makes it easy to visualize and share insights, helping you analyze participation trends, evaluate outcomes, and celebrate top performers. Here's how you can make the most of our analytics features, including a new seamless sharing option!
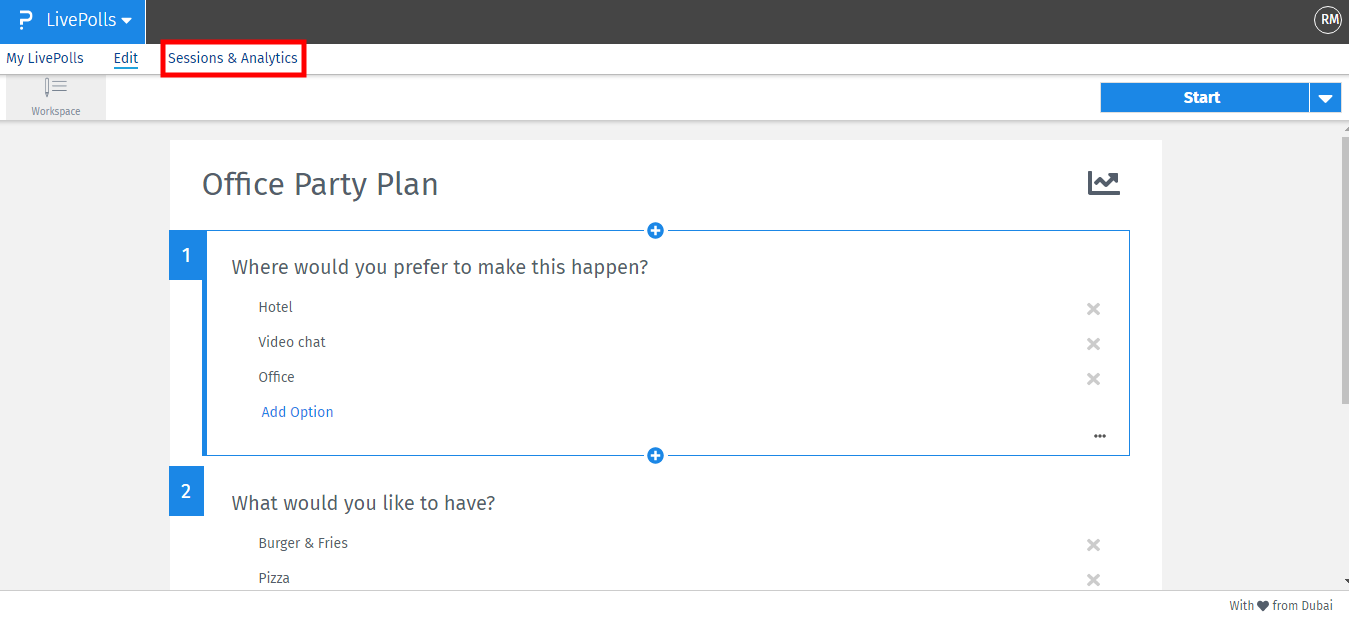
To access that information Go to: Login » LivePolls (Select poll) » Sessions and Analytics

Then find and select the session you want to analyze

This will deploy the report view of the selected session.

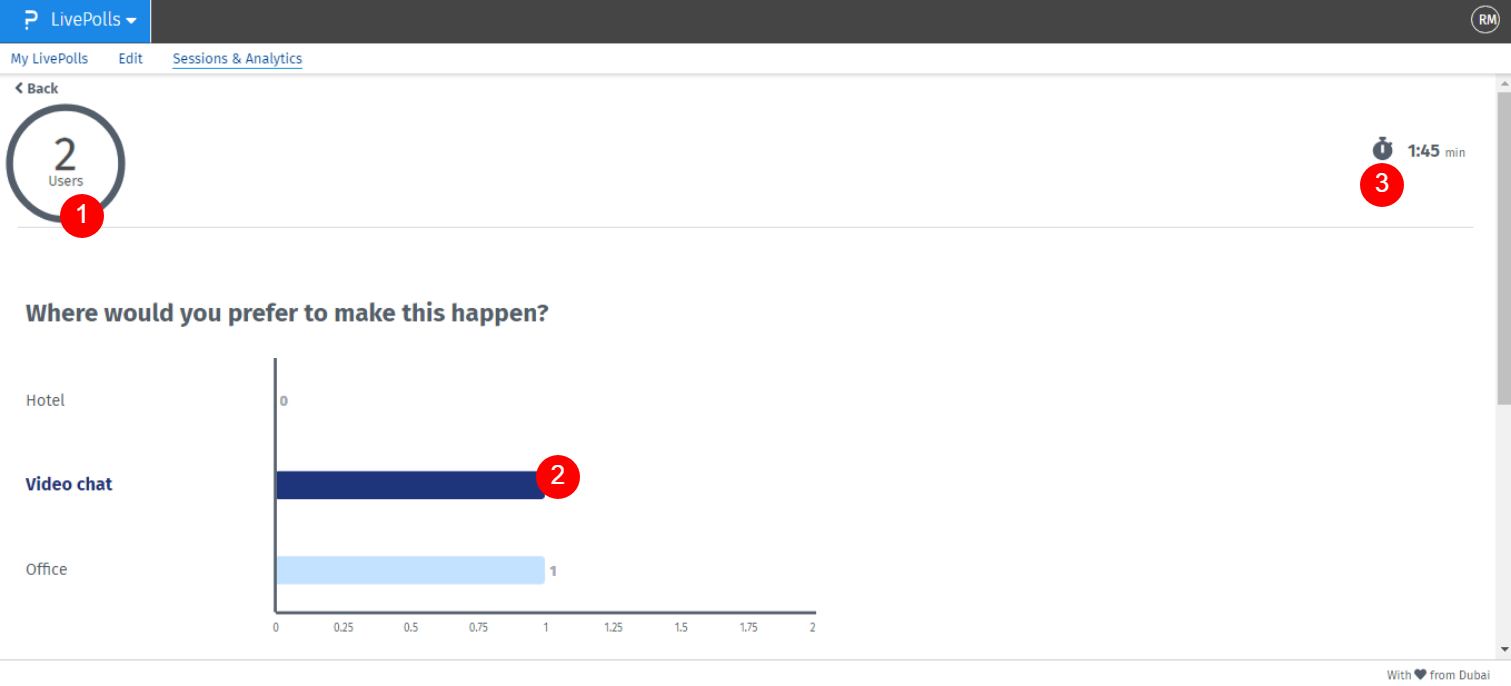
- Respondent count: Displays the total number of participants in the current session.
- Top voted: Highlights the top voted answer option.
- Session time: Displays the total time from the moment the host starts the session until the completion of the poll.

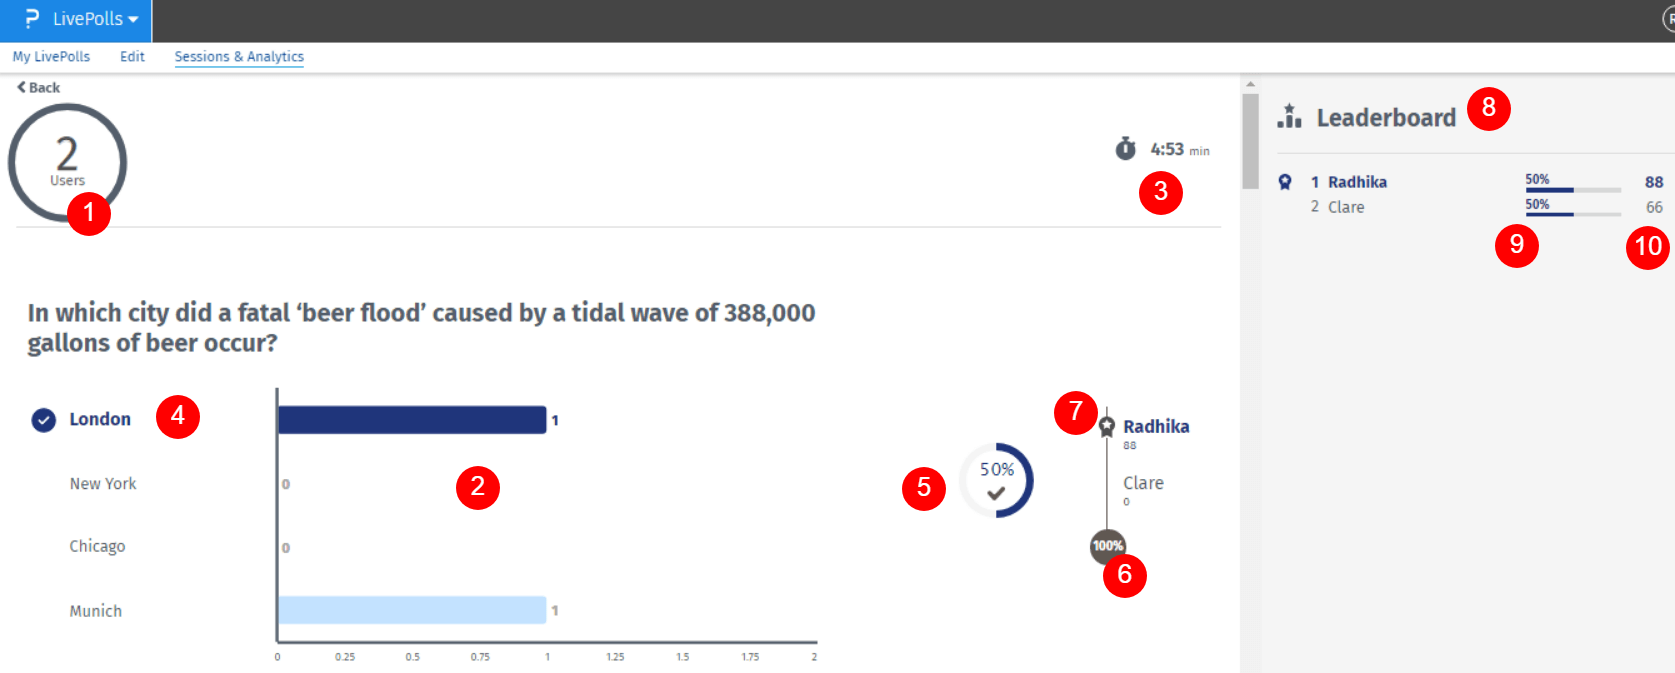
- Respondent count: Displays the total number of participants in the current session.
- Results chart: Shows the spread of the audience responses to each question.
- Session time: Displays the total time from the moment the host starts the session and until the finish has been reached.
- Correct answer: Highlights the correct answer option and how many users chose it.
- Accuracy rate: Displays the percentage of right answers among the total of responses for that question.
- Response rate: Displays the percentage of answers, either wrong or right, out of the total number of participants.
- Top respondents: Provides a shortlist of the top 3 respondents for that specific question.
- Leaderboard: Lists top 20 participants with the highest scores.
- User accuracy rate: Shows the rate of right answers the user has achieved.
- Score: It’s the sum of all points a user gets on each right answer.
This feature is available with the following licenses :

