What is a crosstab?
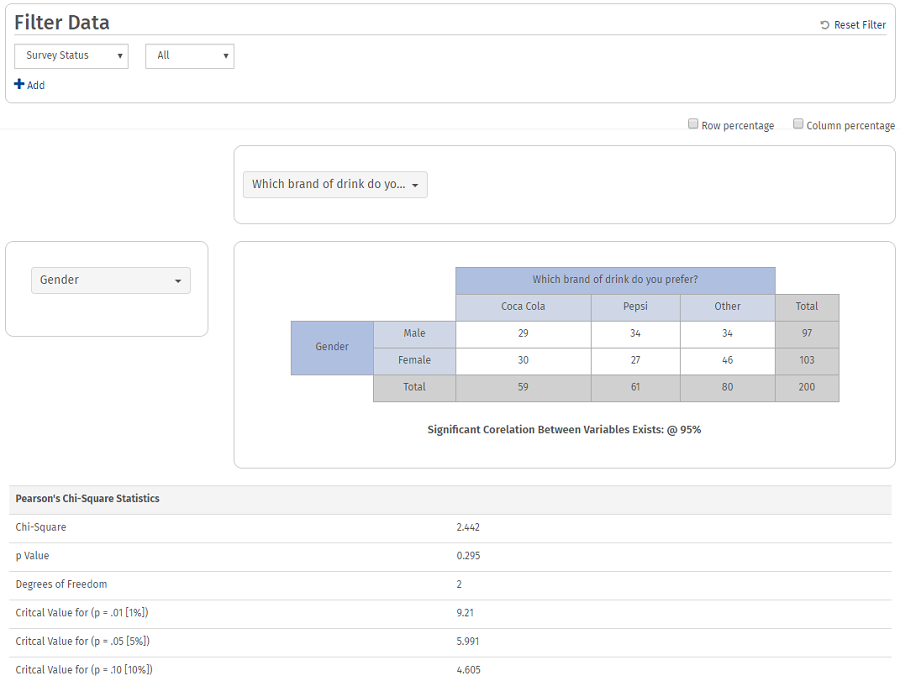
The cross-tabulation tool allows you to measure the interaction between two questions (variables). The table will only show respondents that answered both of the questions, meaning the frequencies shown may differ from a standard frequency table. The cross-tab report will also show Pearson’s Chi-Square Statistics, which shows the level of correlation between the variables using the chi-square, p-value, and degrees of freedom.
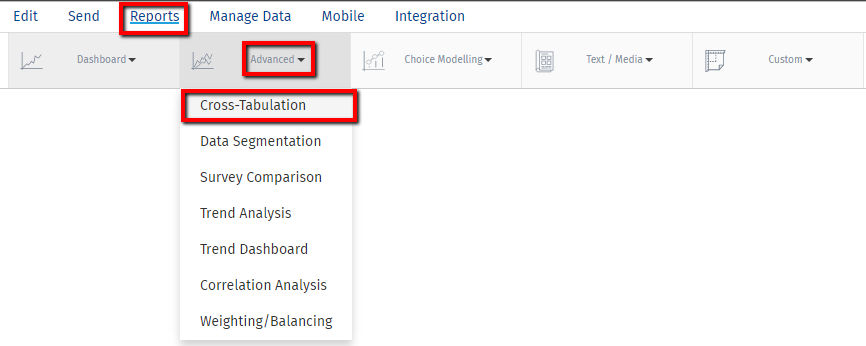
- Login » Surveys » Reports » Advanced » Cross-Tabulation
- Click on Cross-Tabulation under Advanced
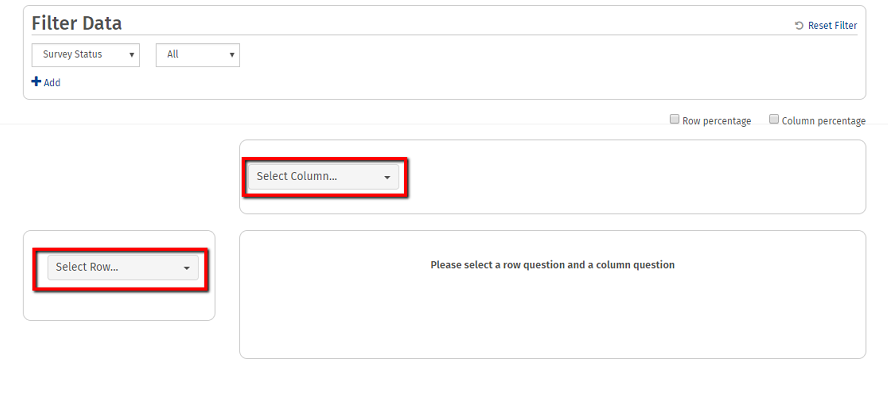
- Select a row question and a column question from the respective dropdowns.

- The cross-tab table will be generated, along with Pearson’s Chi-Square Statistics and a Frequency Analysis for both questions.
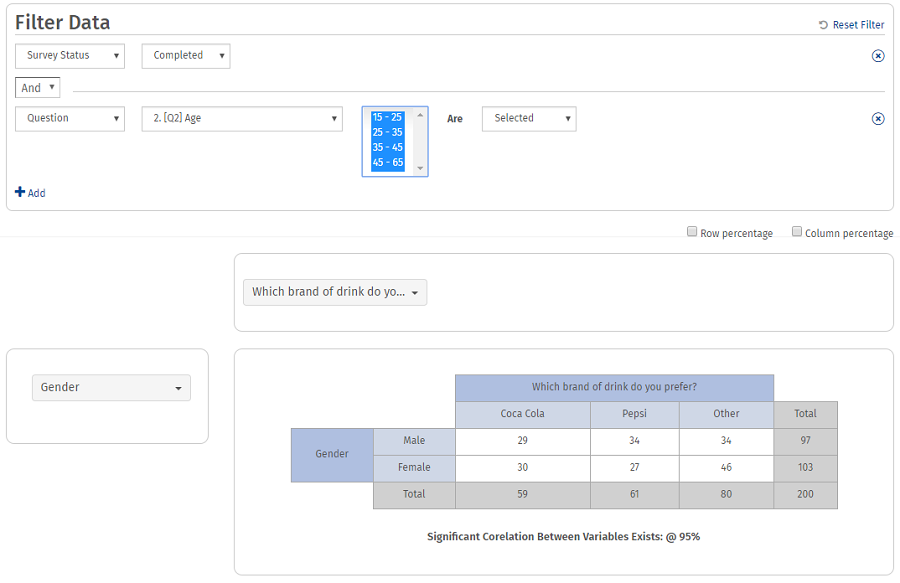
You can filter the data based on the following:
- Survey Status
- Responses to Questions
- System Variables
- Geo Location
- Email List Codes
- Device Type
- Date
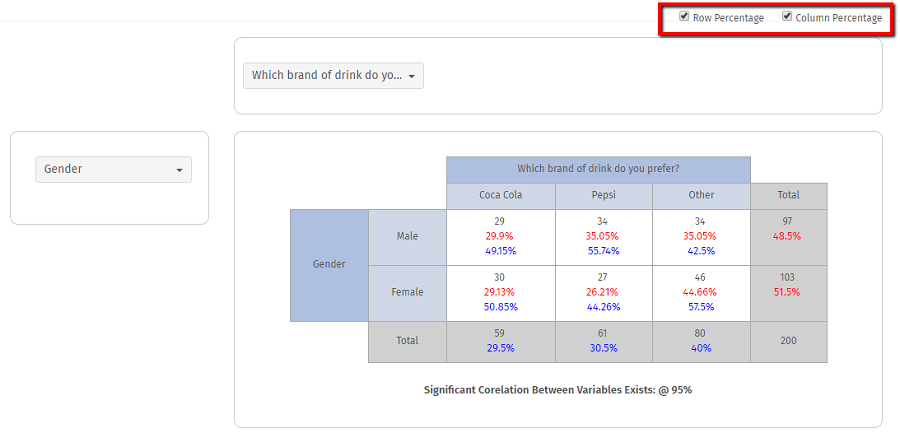
What are row and column percentages?
- Row Percents: The percent of the row total that each cell represents.
- Column Percents: The percent of the column total that each cell represents.
What does the Pearson’s Chi-Square Statistics table mean?
Pearson’s chi-square statistic is used to determine the goodness of fit between the two questions being correlated. In order to measure this, we need a null hypothesis. The null hypothesis measured using the cross-tab tool is that the two questions included in the cross-tab are correlated.
If the Chi-Square value listed in the table is higher than any of the critical values for any of the significance levels (p=.01, p=.05, or p=.1), then we can reject the null hypothesis established. In other words, if the Chi Square value that is listed in the table is higher than any of the other values shown for the 1%, 5%, or 10% significance levels, then the two questions being measured are not highly correlated. The p Value listed under the Chi-Square value in the table (second row) is the level at which the two questions are considered highly correlated. The degrees of freedom is the reference point for a chi-square table. This is determined by calculating the number of observed responses versus the number of expected responses, then subtracting 1 from that value.
The general standard confidence level used is p=.05, or the 95% confidence level. The cross-tab tool gives values at the 99% confidence level (p=.01), 95% confidence level (p=.05), and the 90% confidence level (p=.1). There are times when the chi-square is less than or equal to the critical value at the 99% confidence level but not at the 95% confidence level. It is generally stronger to use the value at the 90% or 95% confidence level.
Chi-square analysis should only be used for categorical values which typically include nominal or ordinal data.
- Nominal: names, labels. Examples include days of the week, colors, and geographic area names. These are difficult to analyze using most statistical methods. Basically, you are limited to count, or frequency of distribution.
- Ordinal: order of items, but no measurable difference in numbers between the items in the list. Examples include satisfaction ratings and importance ratings. Analysis includes median (midpoint of distribution, rather than the average distribution) and count.
 Survey Software
Easy to use and accessible for everyone. Design, send and analyze online surveys.
Survey Software
Easy to use and accessible for everyone. Design, send and analyze online surveys.
 Research Suite
A suite of enterprise-grade research tools for market research professionals.
Research Suite
A suite of enterprise-grade research tools for market research professionals.
 Customer Experience
Experiences change the world. Deliver the best with our CX management software.
Customer Experience
Experiences change the world. Deliver the best with our CX management software.
 Employee Experience
Create the best employee experience and act on real-time data from end to end.
Employee Experience
Create the best employee experience and act on real-time data from end to end.