 Automatic Reporting, Chart, Graphs |
|
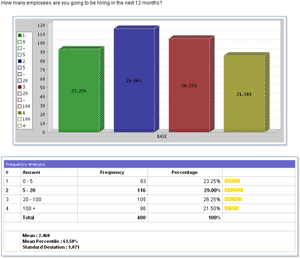
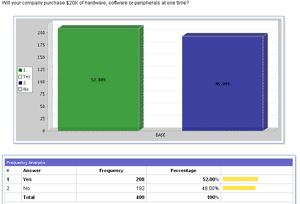
Charts and Graphs are automatically generated for your convenience. Every component of the chart can be customized -- Title, Legend, Chart Type (Bar/Line/Pie) etc. Standard statistical calculations like the Mean and Std. Dev. are also provided.
|
Automatic Charts and Graphs
|
|
|
Integrated Results Portal
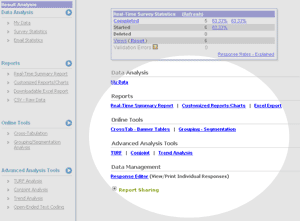
The Result Portal gives you full access to your data along with a host of analytical tools for slicing and dicing your data. The data is available real-time while users are taking the survey.
|
|
|
Excel Data Download
|
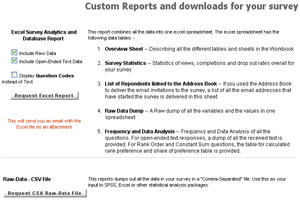
Downloadable Excel Report
|
|
Integrated Cross-Tabulation Tool
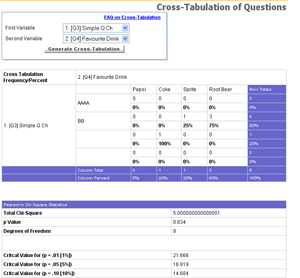
Cross-Tabulation between questions allows you to co-relate data within your survey. For example you can find out how males responded to a question vs. how females did. This allows you to do in-depth interaction analysis.
|
|
|
Segmentation and Grouping Analysis
You can create segments or groups of data for comparison. For example you can create a segment of "highly satisfied" customers and compare them to the rest of the data. The segmentation logic can include multiple critera -- Highly Satisfied AND Living in Seattle etc.
|
|
|
Time based Grouping Analysis
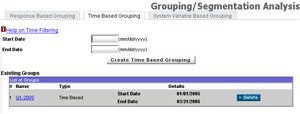
Create data-segments based on time. See how your survey results change over time.
|
|
|
Integrated TURF (Total Unduplicated Reach and Frequency) Analysis
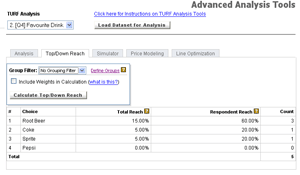
Using any Multiple-Choice question you can perform 1-Click TURF analysis. TURF analysis gives you the ability to see the "reach" of the individual options.
|
|
|
Integrated Conjoint Analysis
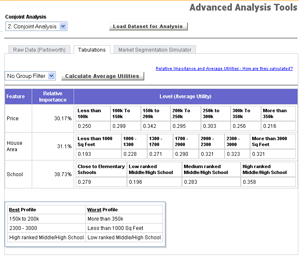
Conjoint analysis can be included as part of any survey. Conjoint allows you to find out optimal product pricing and an integrated market-share simulator is also available.
|
|
|
Survey Software Easy to use and accessible for everyone. Design, send and analyze online surveys.
Research Suite A suite of enterprise-grade research tools for market research professionals.
Customer Experience Experiences change the world. Deliver the best with our CX management software.
Employee Experience Create the best employee experience and act on real-time data from end to end.
