
Pictorial Graph for your widget
A picture graph, or pictograph, is a graph used to display information that uses images or symbols to represent data. Althoiugh this does not give you any additional data points, it adds a bit of life to your dashboard.
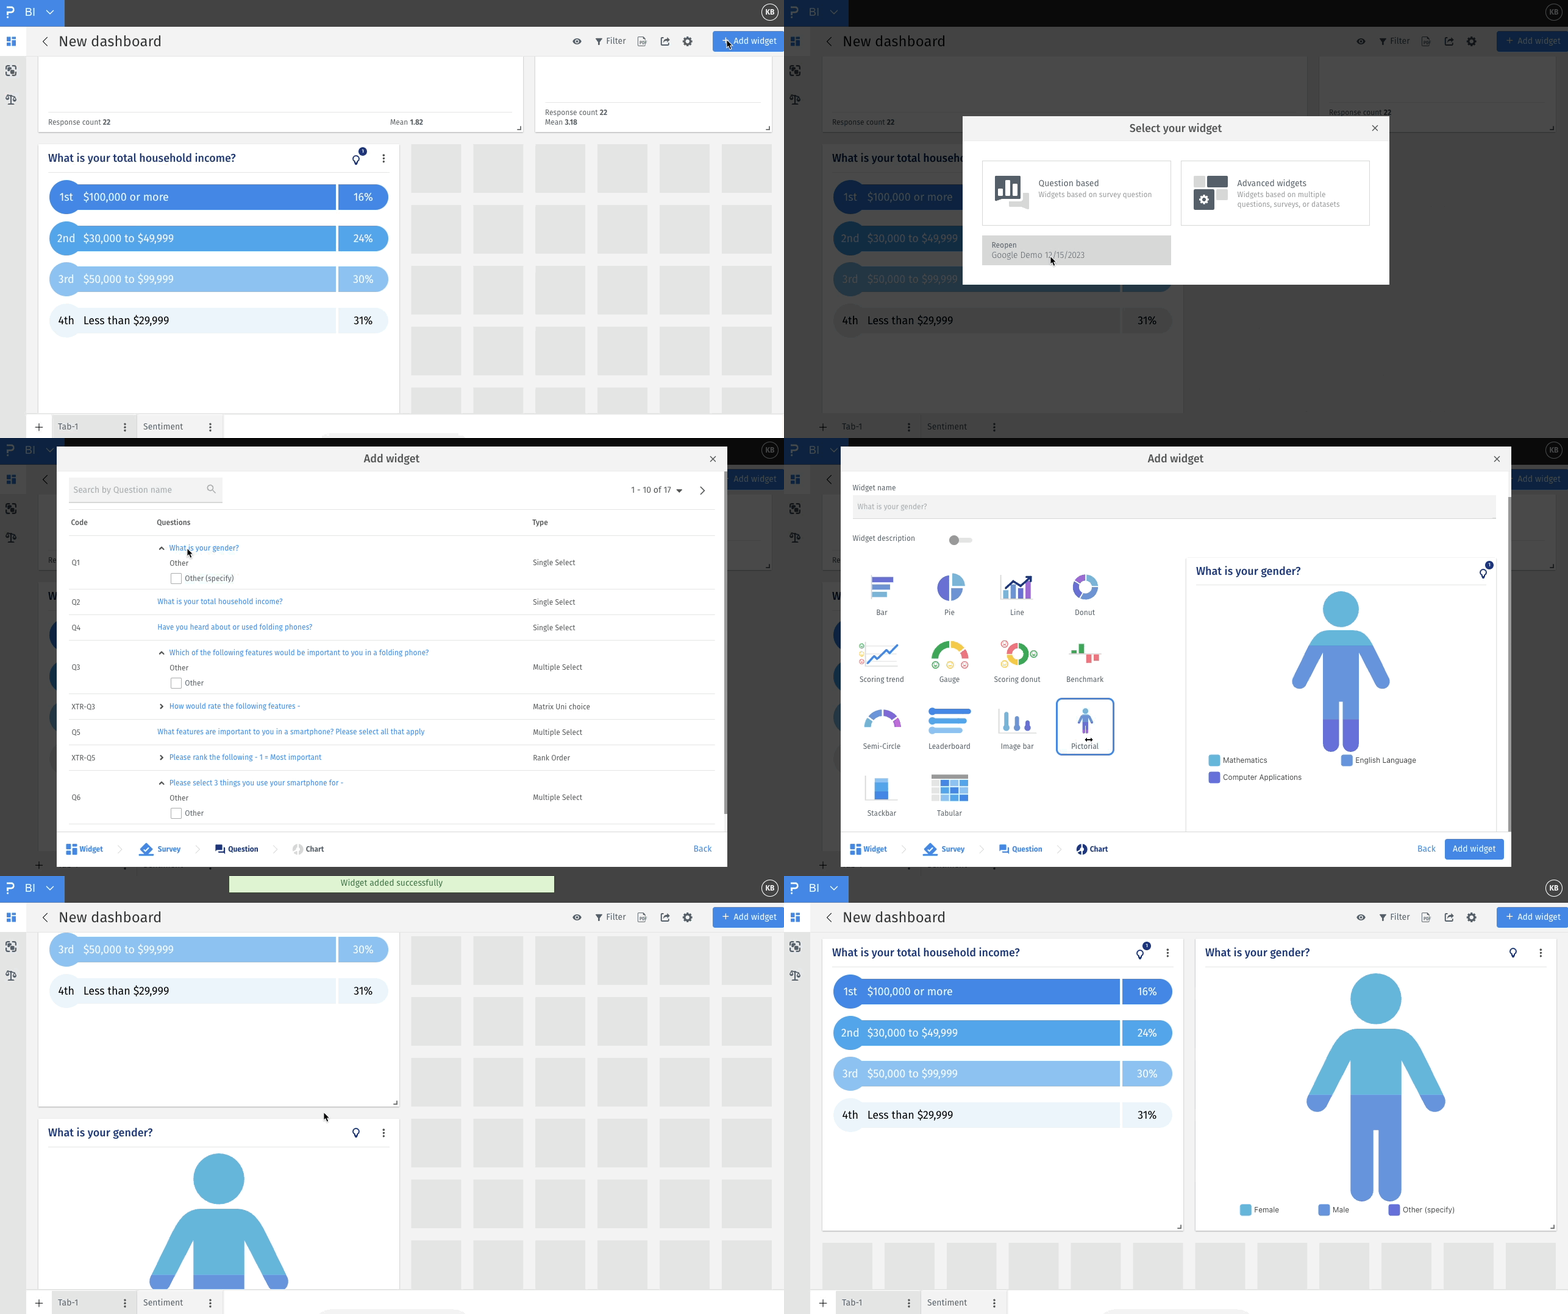
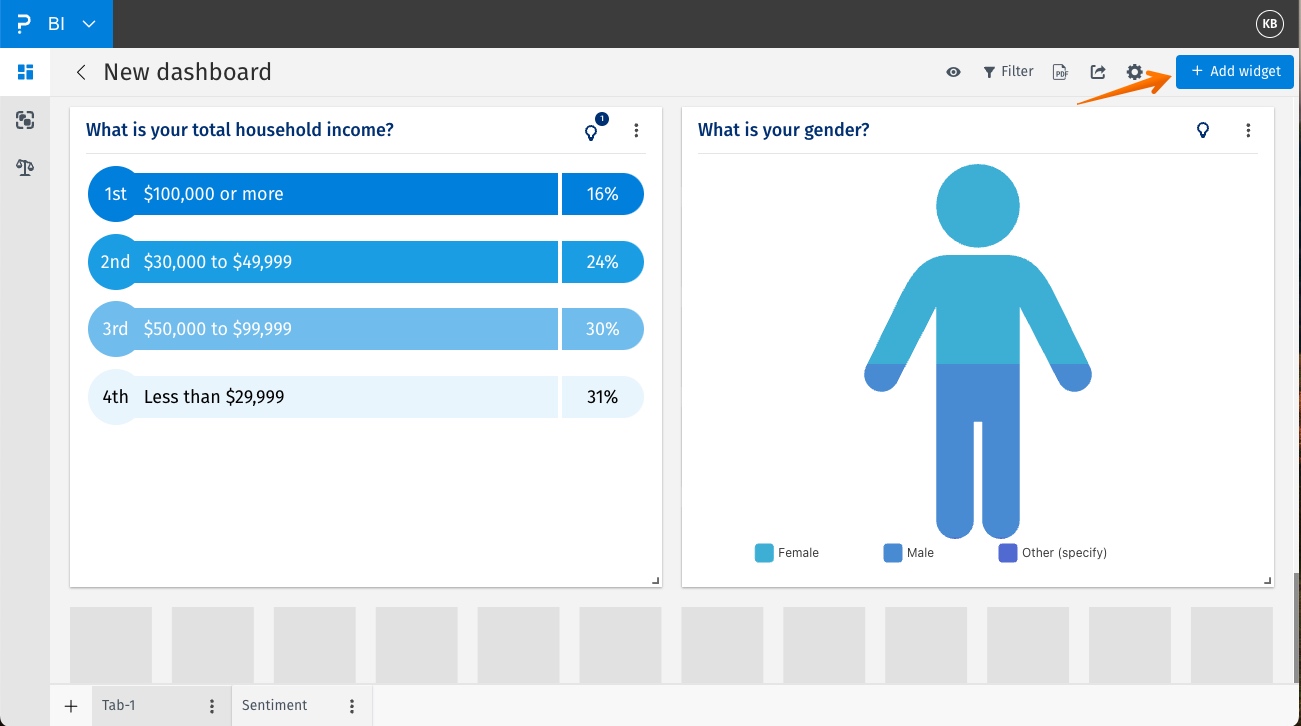
Go to: Login » Select dashboard » Add widget » Question based or continue using this survey » Select question or part of a question » Select the Pictorial chart type » Add Widget
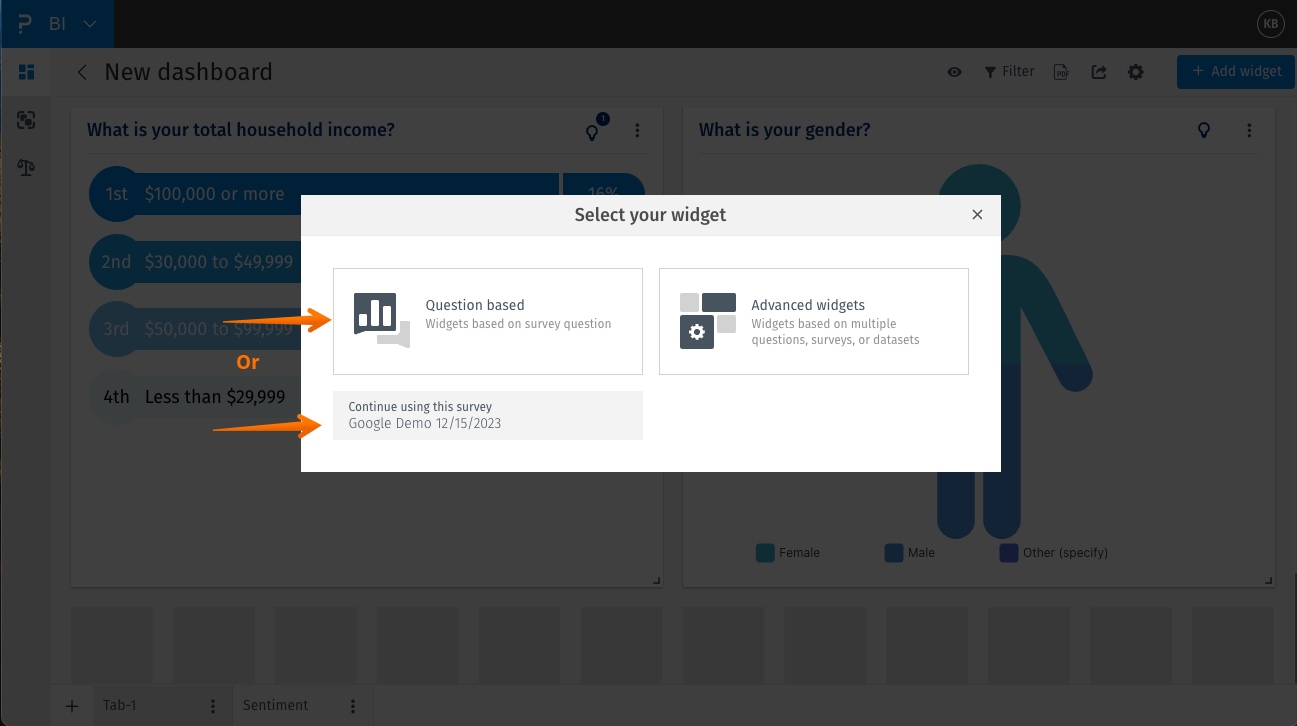
 Step 2: Click on question based or continue using this survey
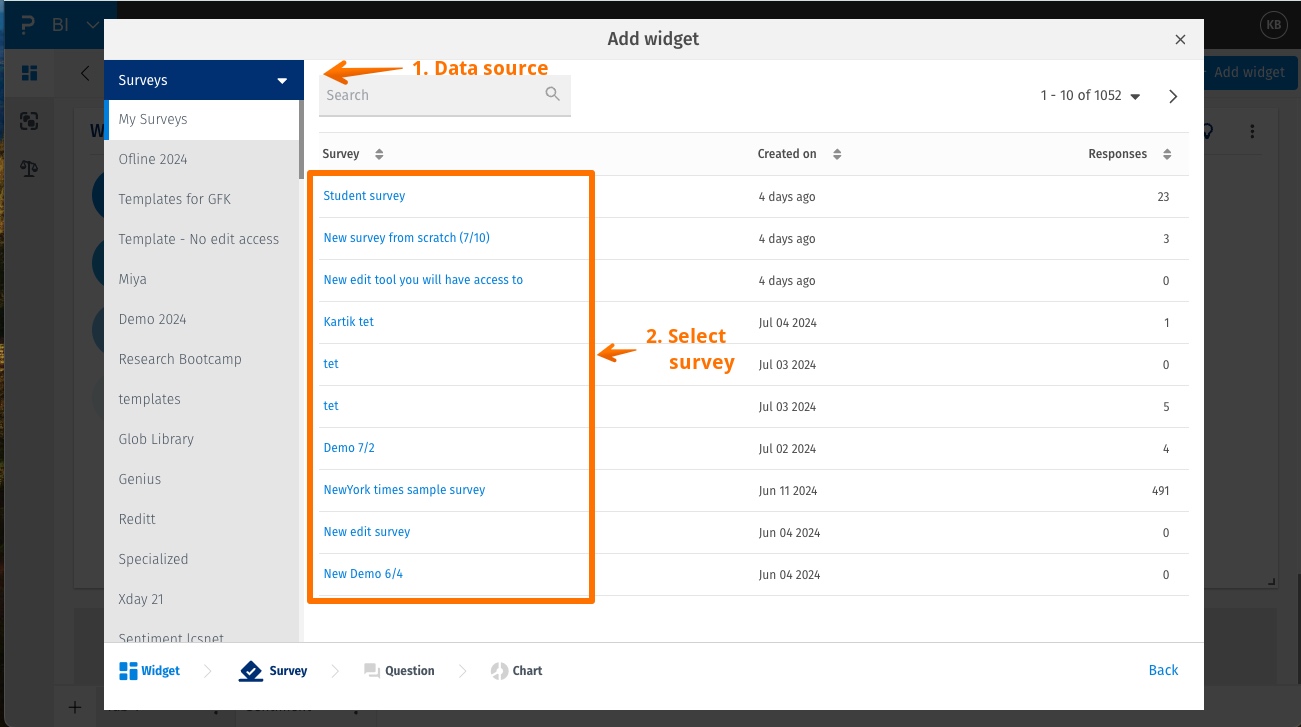
Step 3: Select the data source and survey -
Step 4: Give a name » slect pictorial » add widget
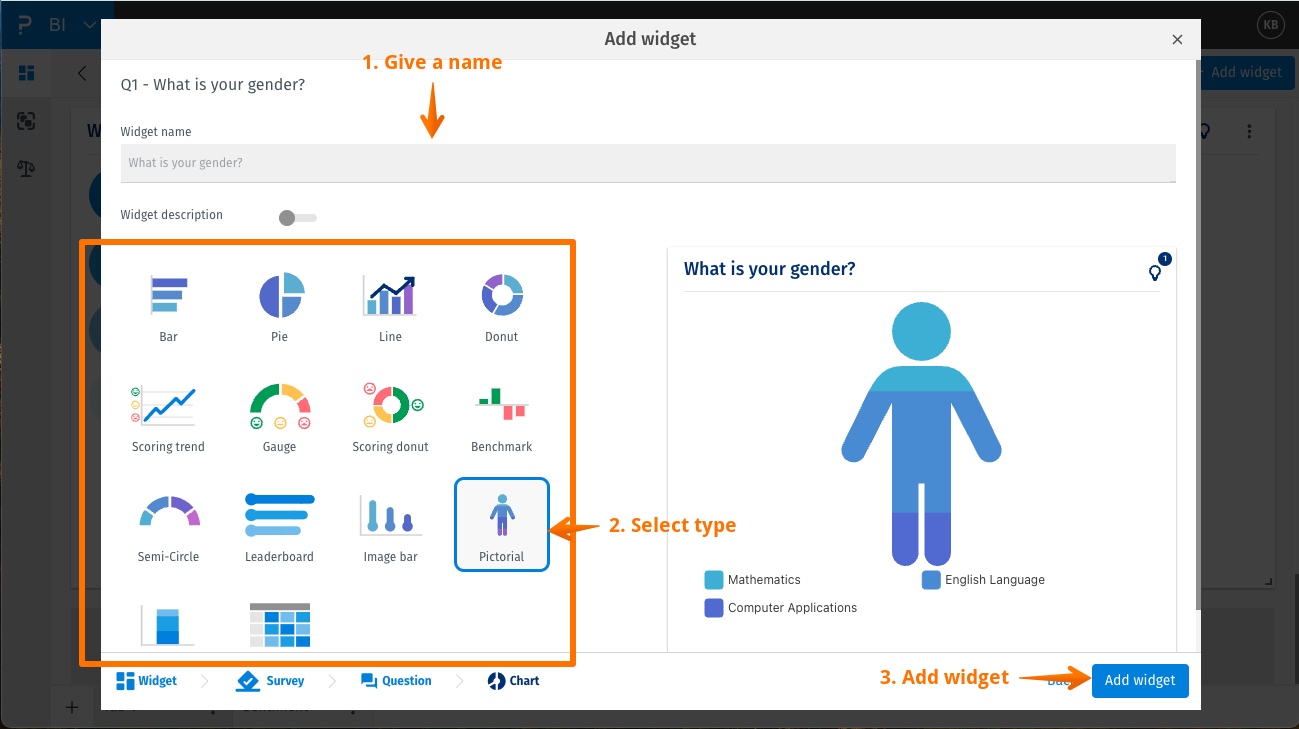
You can select from over 30 different graph / icon types.
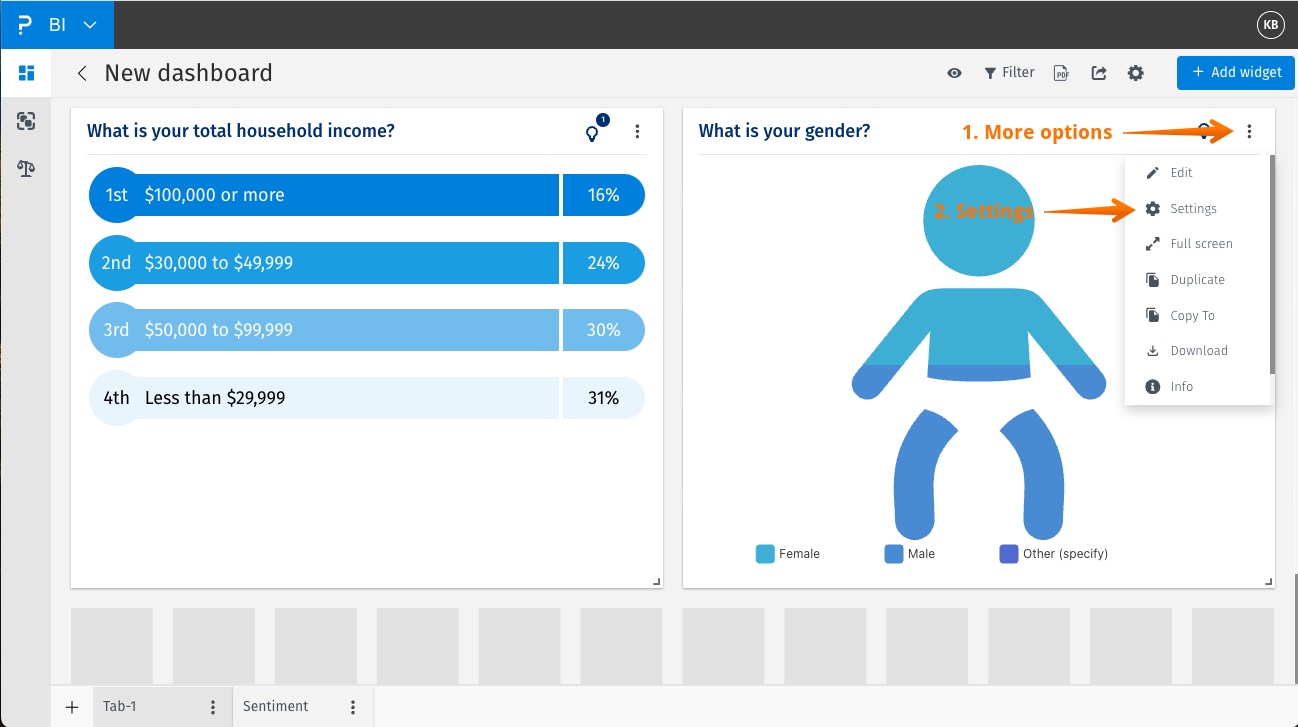
Click on more options » Settings » Labels » Select icon from the dropdown
![]()
Step 1: More options » Settings
Step 2: Labels » select icon from the dropdpwn
![]()
This feature is available with the following licenses :
Team Edition Research Edition Communities Customer Experience Workforce

