
Scoring trend widget
A scoring trend is a line graph that shows you a score or a value over time. It can be any score or vale like a mean, NPS, CSAT, customer effort score, etc.
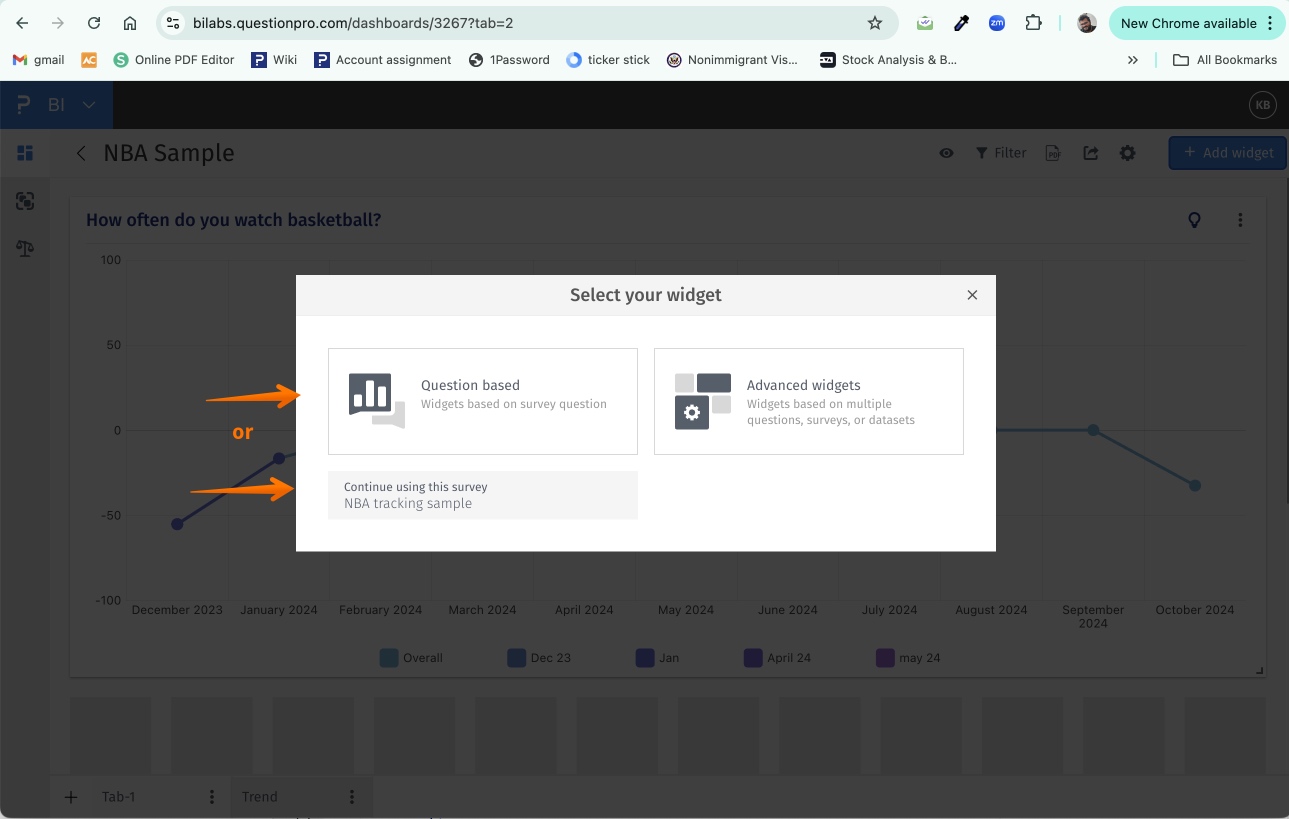
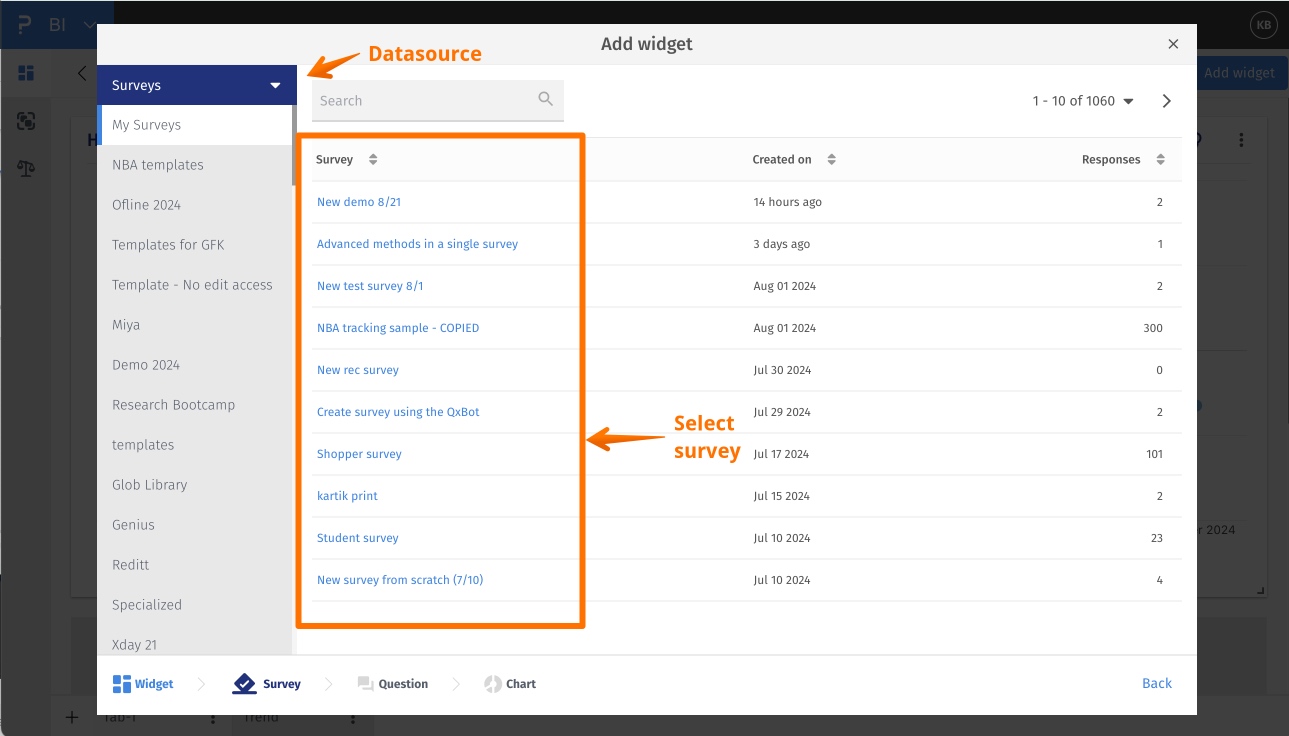
Go to: Login » Select dashboard » Add widget » Question based or continue using this survey » Select question or part of a question » Select the scoring trend chart type » Add Widget
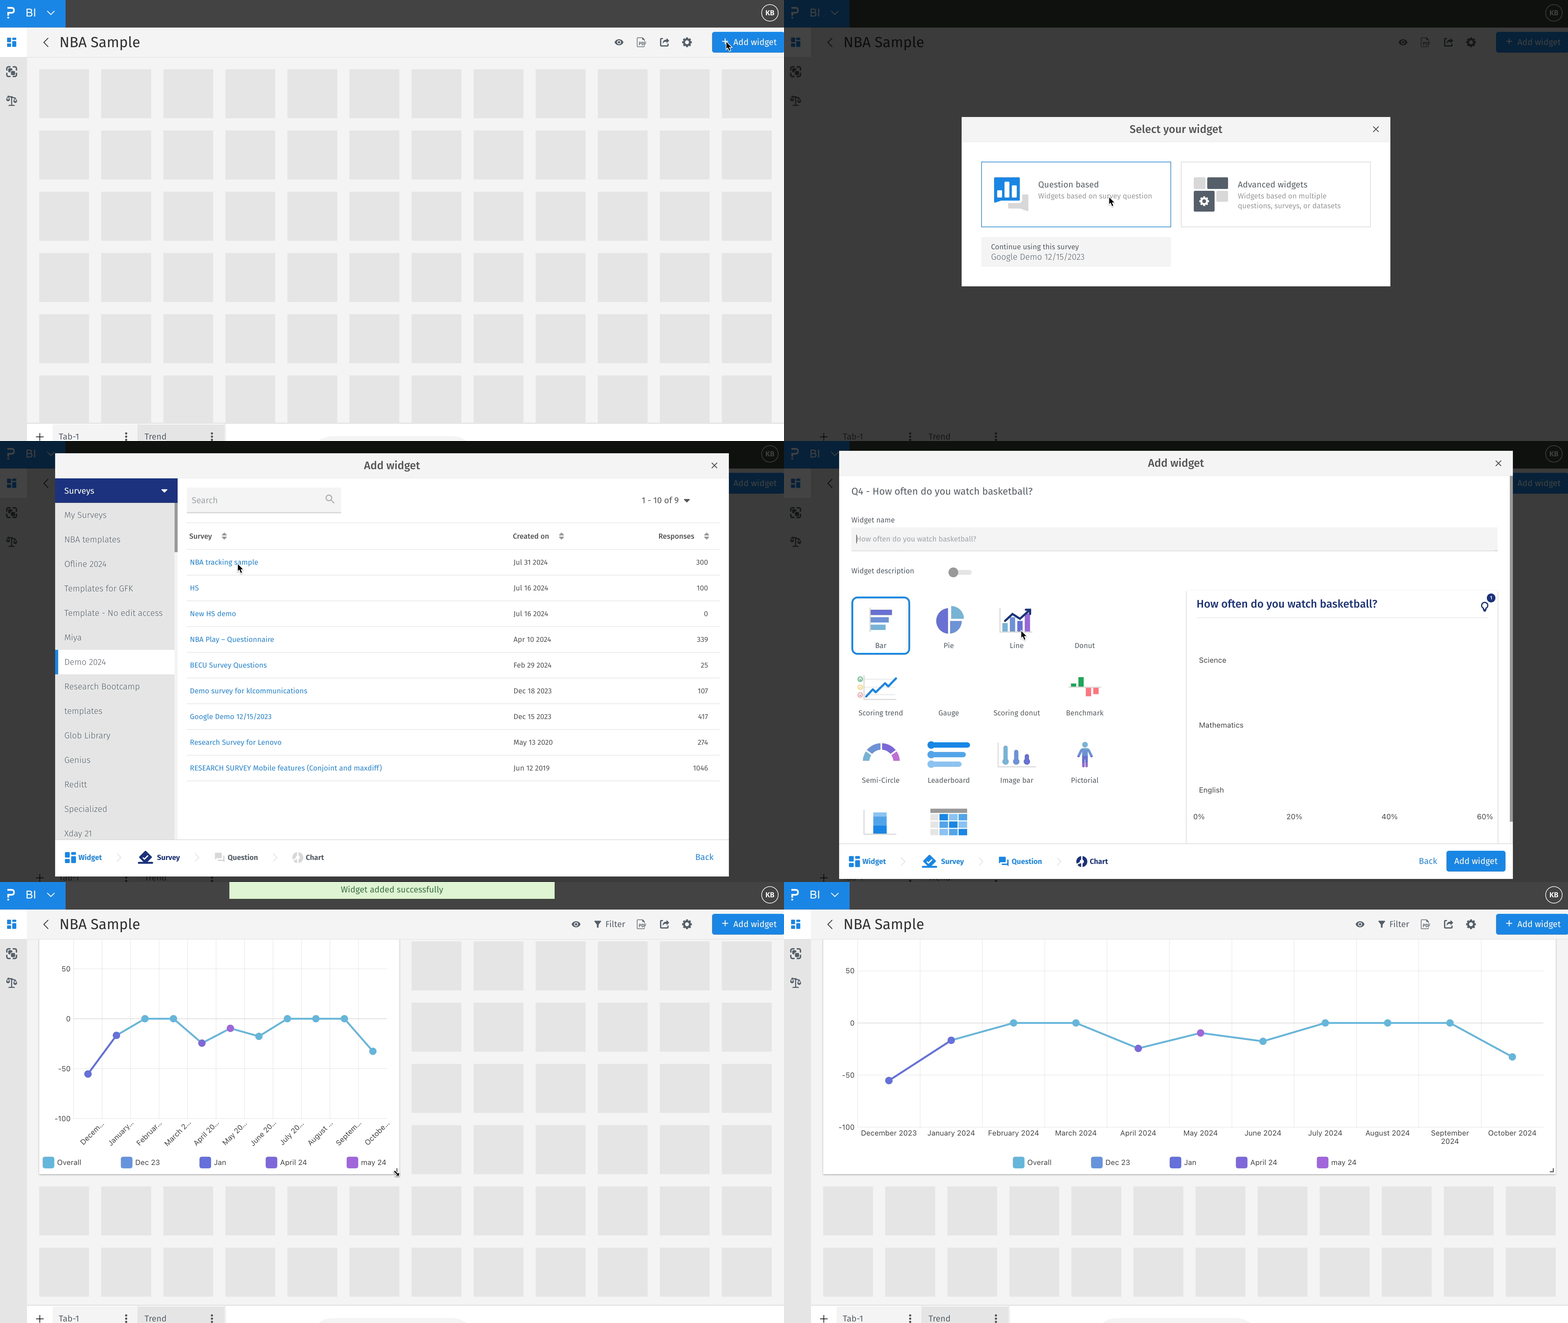
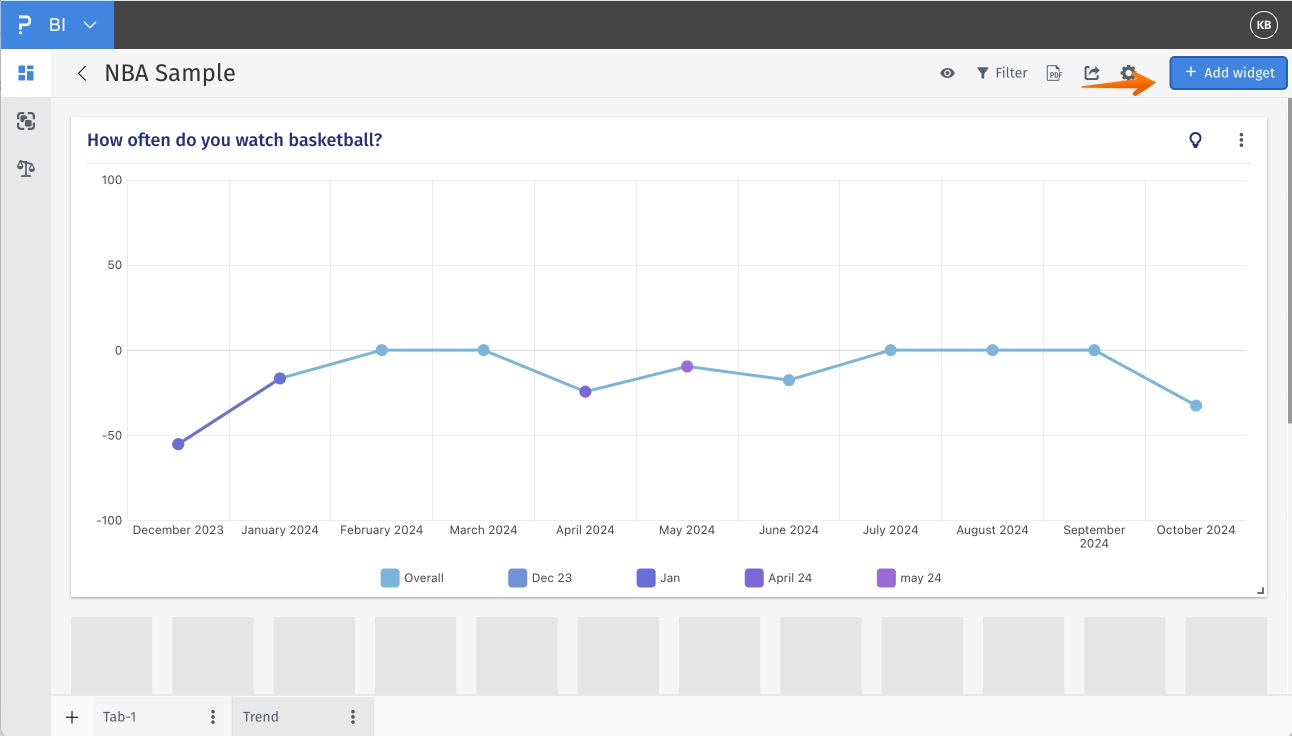 Step 2: Click on question based or continue using this survey
Step 3: Select the data source and survey -
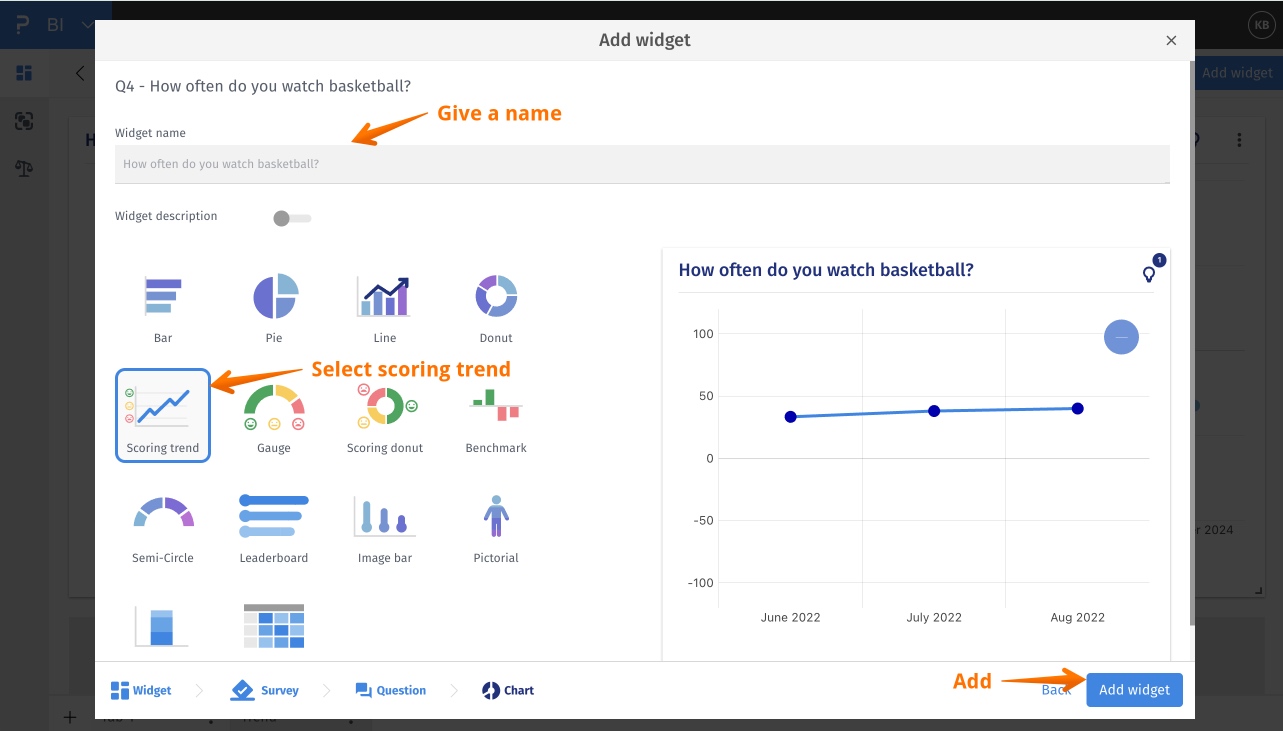
Step 4: Give a name » select scoring trend » add widget
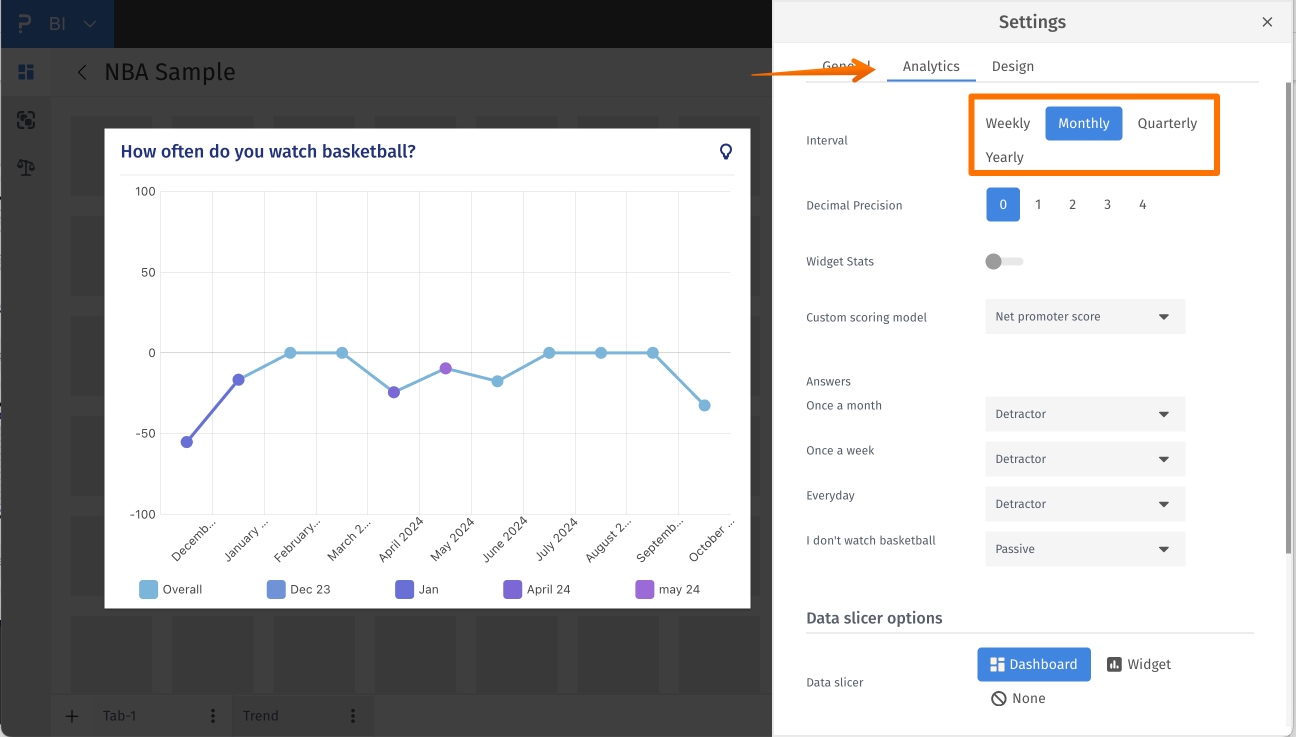
You can select between weekly, monthly, quarterly and yearly. You will find this under widget settings » Analytics
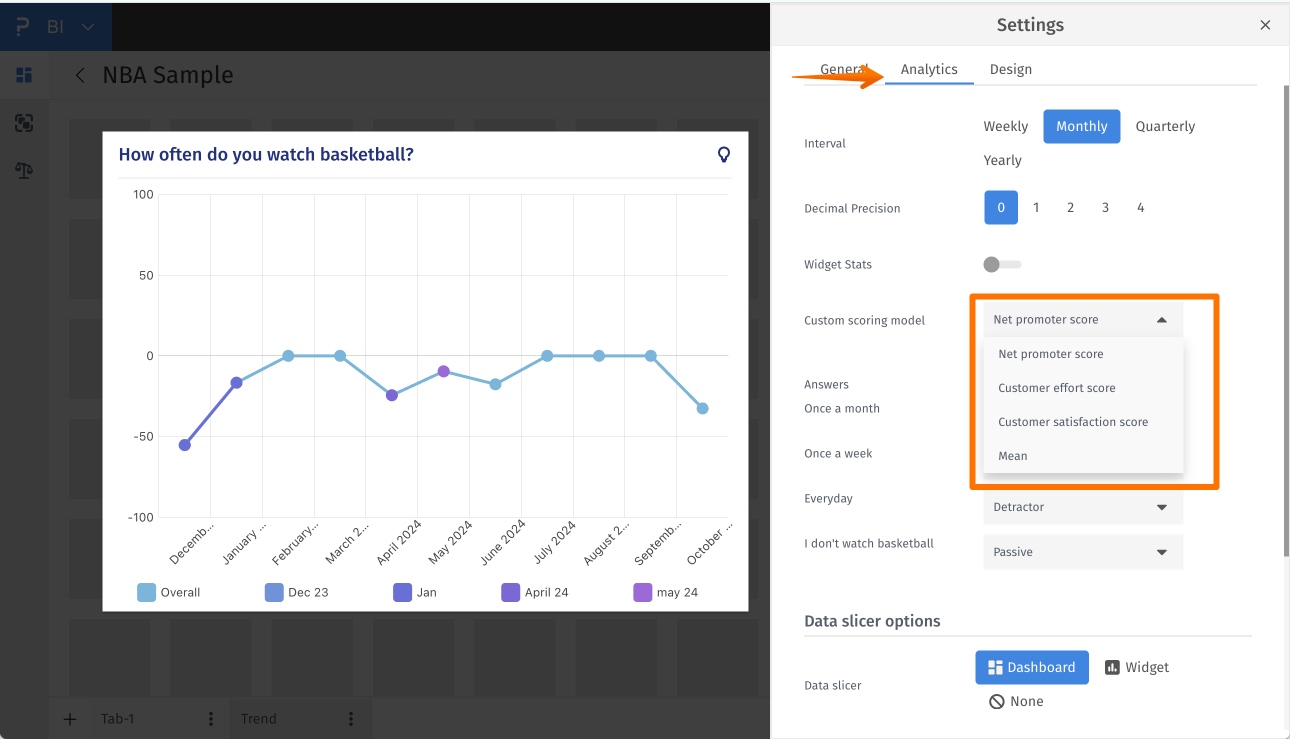
You can select between Net promoter score, customer effort score, customer satisfaction score and mean or custom mean. You will find this under widget settings » Analytics
This feature is available with the following licenses :
Team Edition Research Edition Communities Customer Experience Workforce

