


Histogram
Histogram is a powerful data visualization tool used to represent the distribution of numerical data. It works by grouping data values into intervals, or "bins", and then displaying the frequency of occurrences within each bin using vertical bars. The height of each bar corresponds to the number of data points that fall within its associated bin.
Histograms are particularly valuable for understanding the shape, center, and spread of data. They can reveal patterns, such as symmetry, skewness, and the presence of outliers. Additionally, histograms help identify the mode and provide insights into the range and variability of the data.
In survey data, histograms can visualize responses to numerical questions like age, satisfaction ratings, or income levels, helping researchers understand the sample's characteristics.
- Visual representation of data distribution
- Identification of patterns and trends
- Estimation of central tendency and dispersion
- Comparison of data sets
- Detection of outliers
Coming Soon>
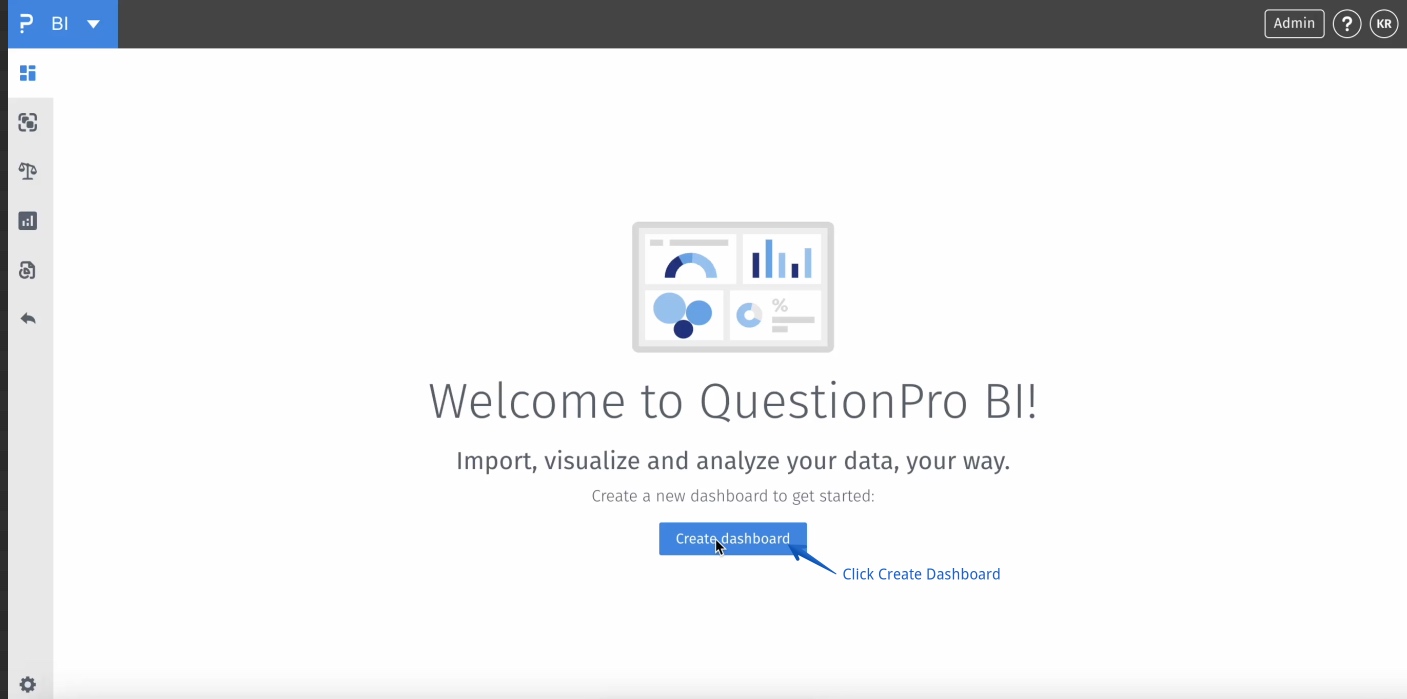
BI -> Create Dashboard
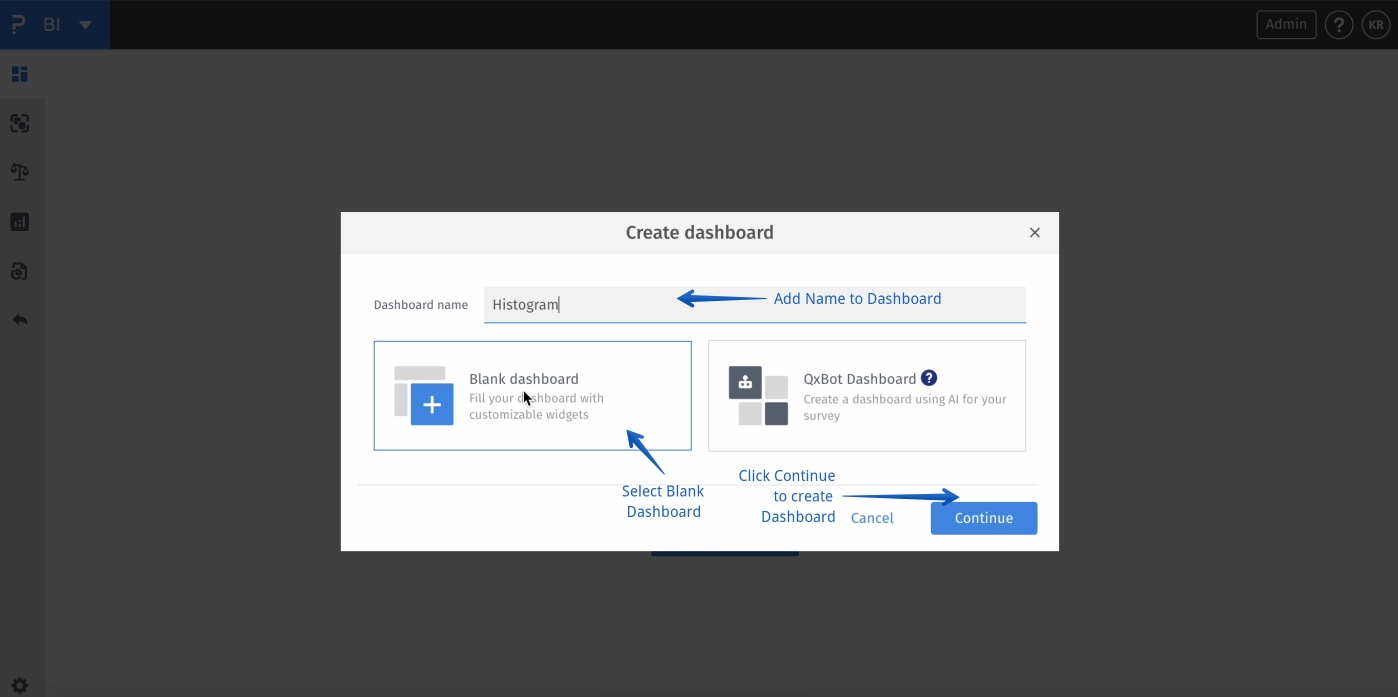
BI -> Create Dashboard -> Blank Dashboard -> Continue
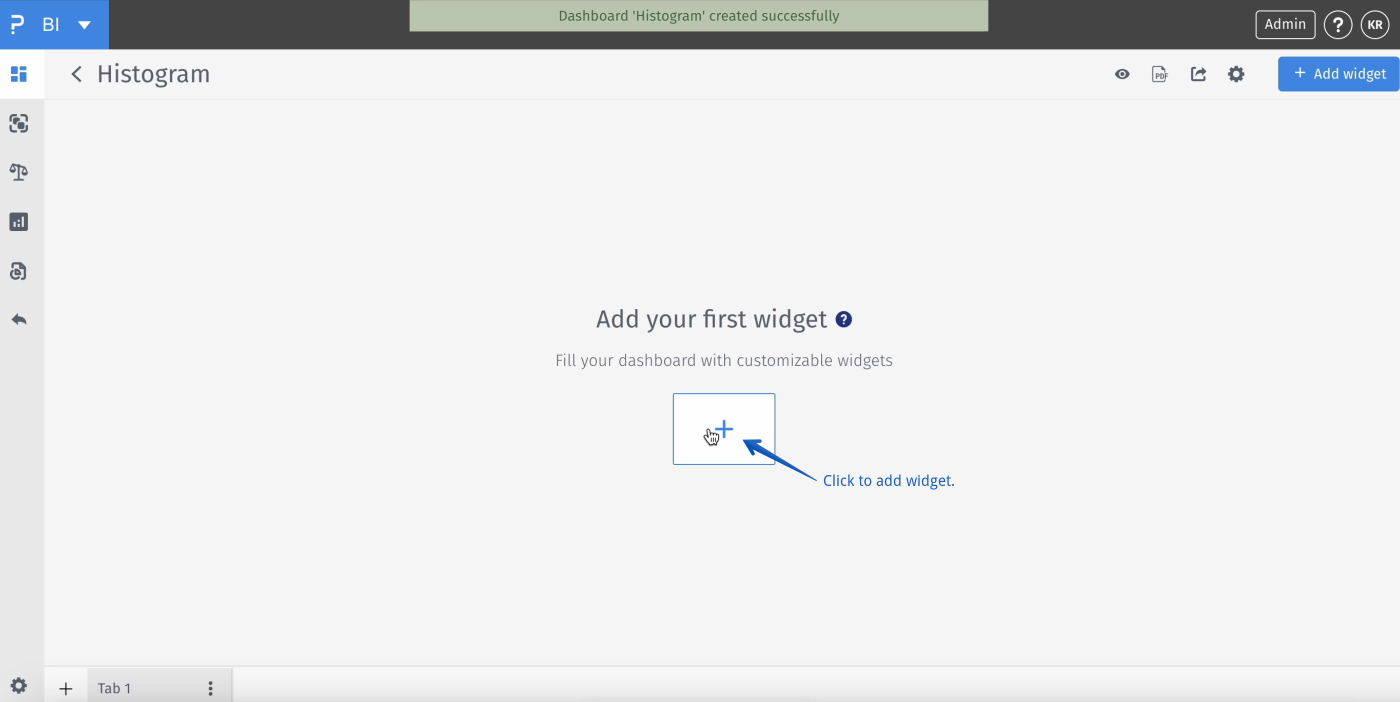
BI -> Create Dashboard -> Blank Dashboard -> Continue -> Add Widget
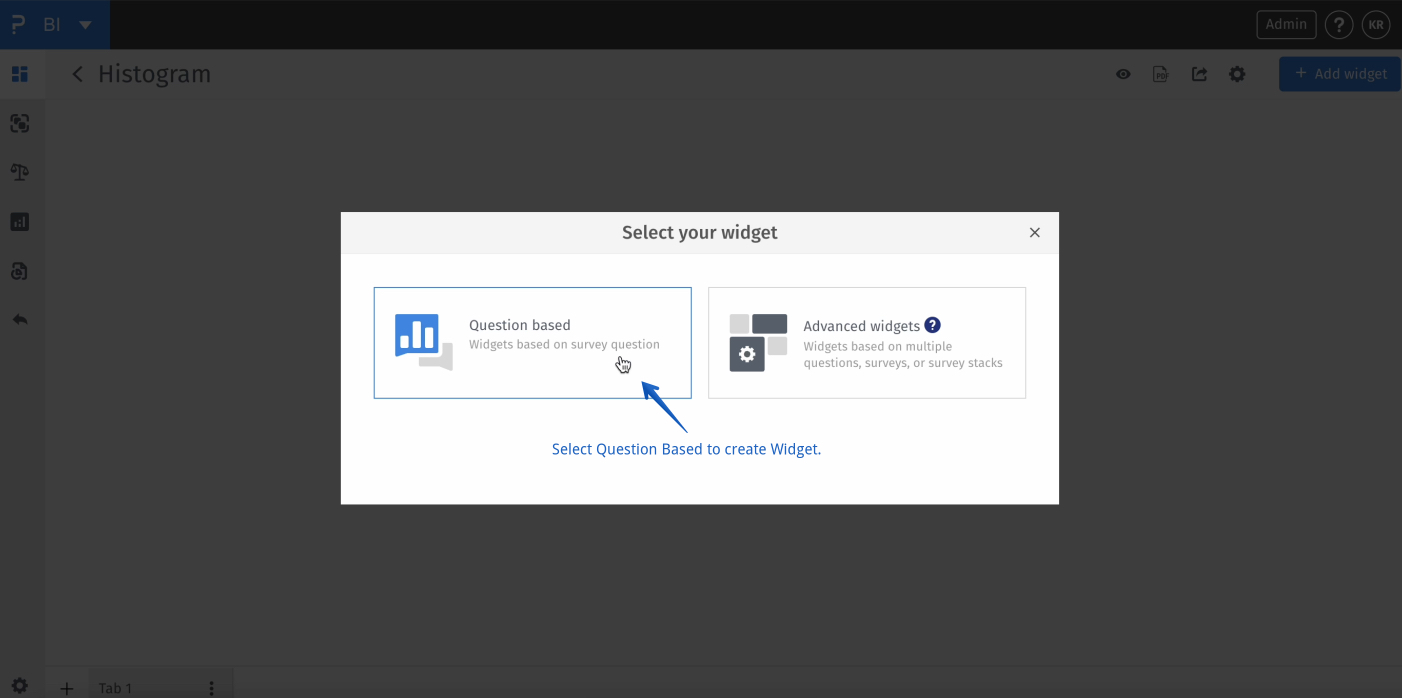
BI -> Create Dashboard -> Blank Dashboard -> Continue -> Add Widget -> Question Based
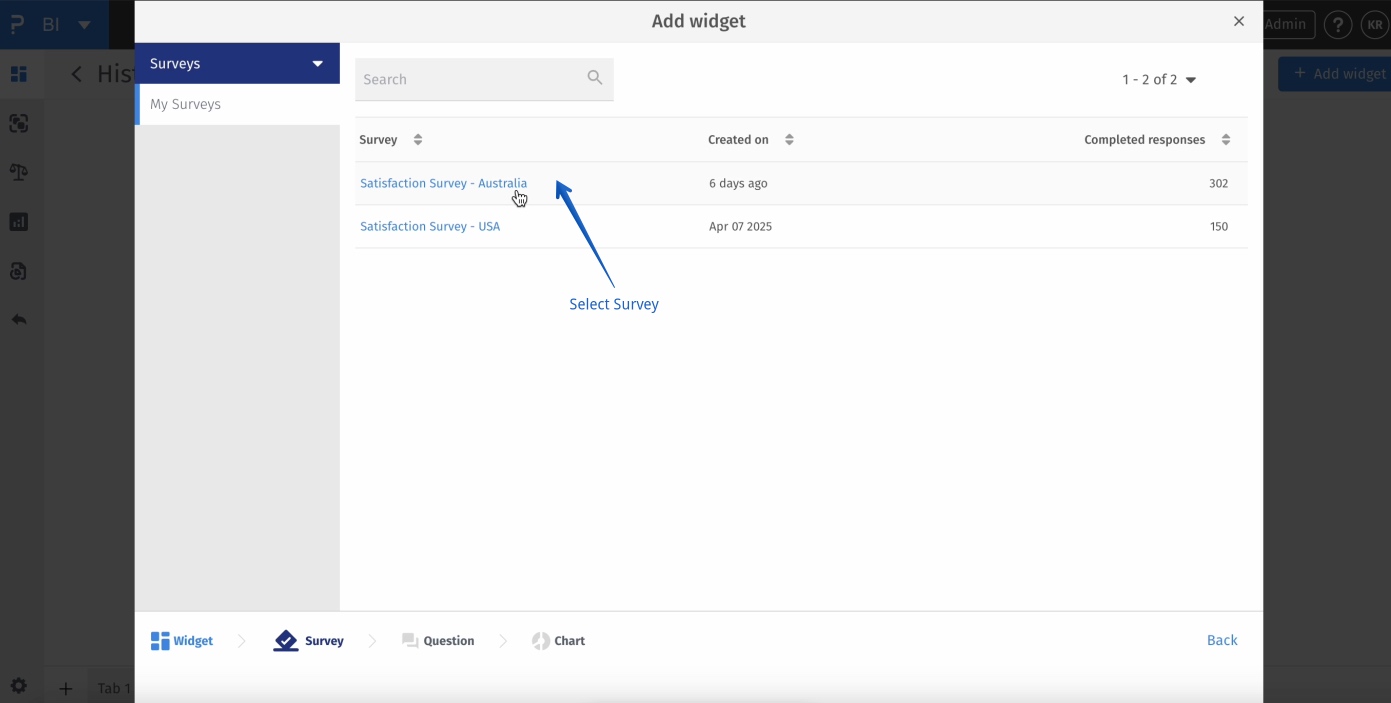
BI -> Create Dashboard -> Blank Dashboard -> Continue -> Add Widget -> Question Based -> Select Survey
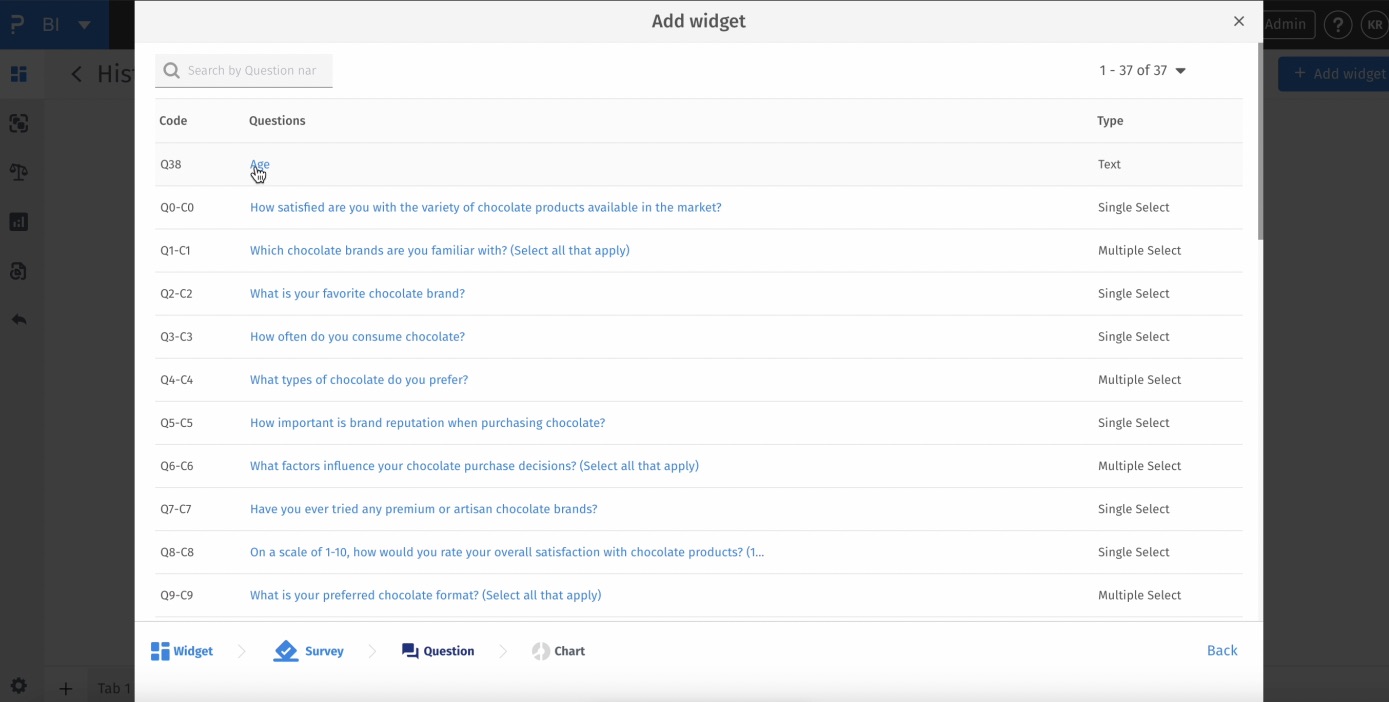
BI -> Create Dashboard -> Blank Dashboard -> Continue -> Add Widget -> Question Based -> Select Survey -> Select Numeric Question
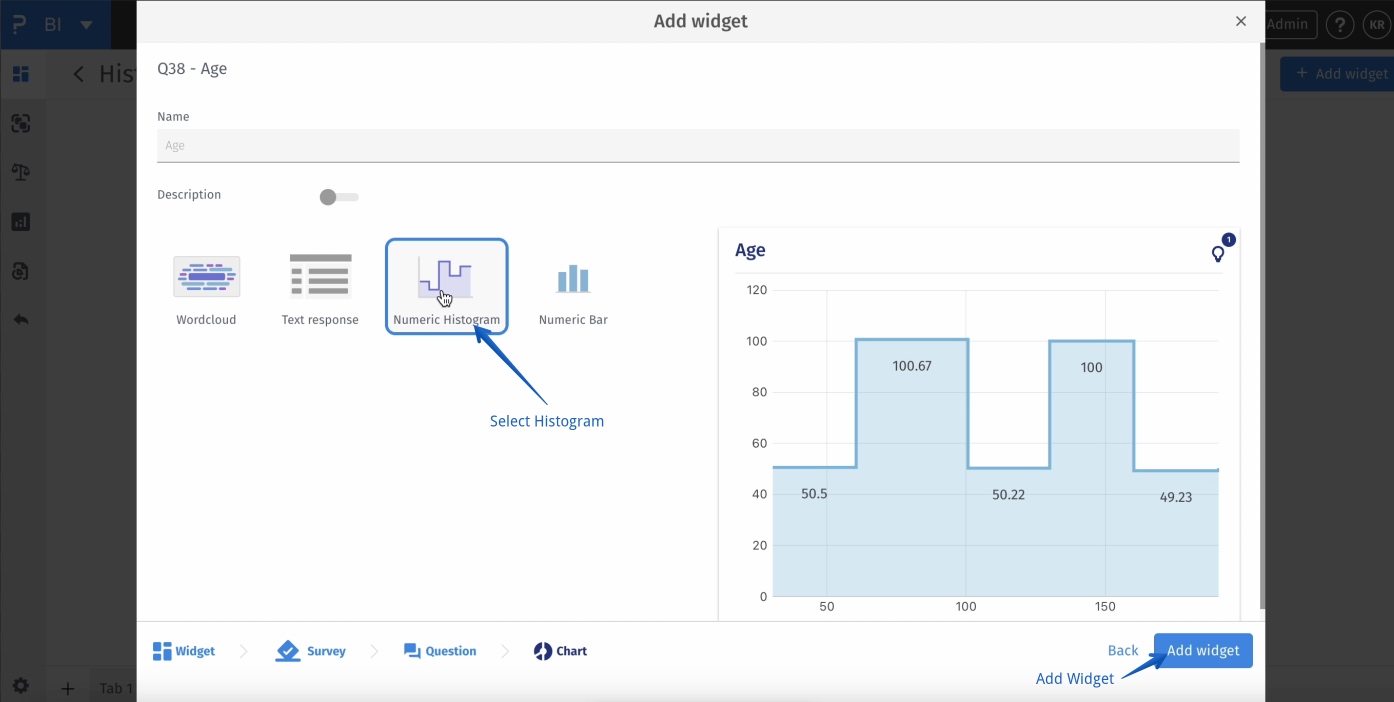
BI -> Create Dashboard -> Blank Dashboard -> Continue -> Add Widget -> Question Based -> Select Survey -> Select Numeric Question -> Select Numeric Histogram -> Add Widget
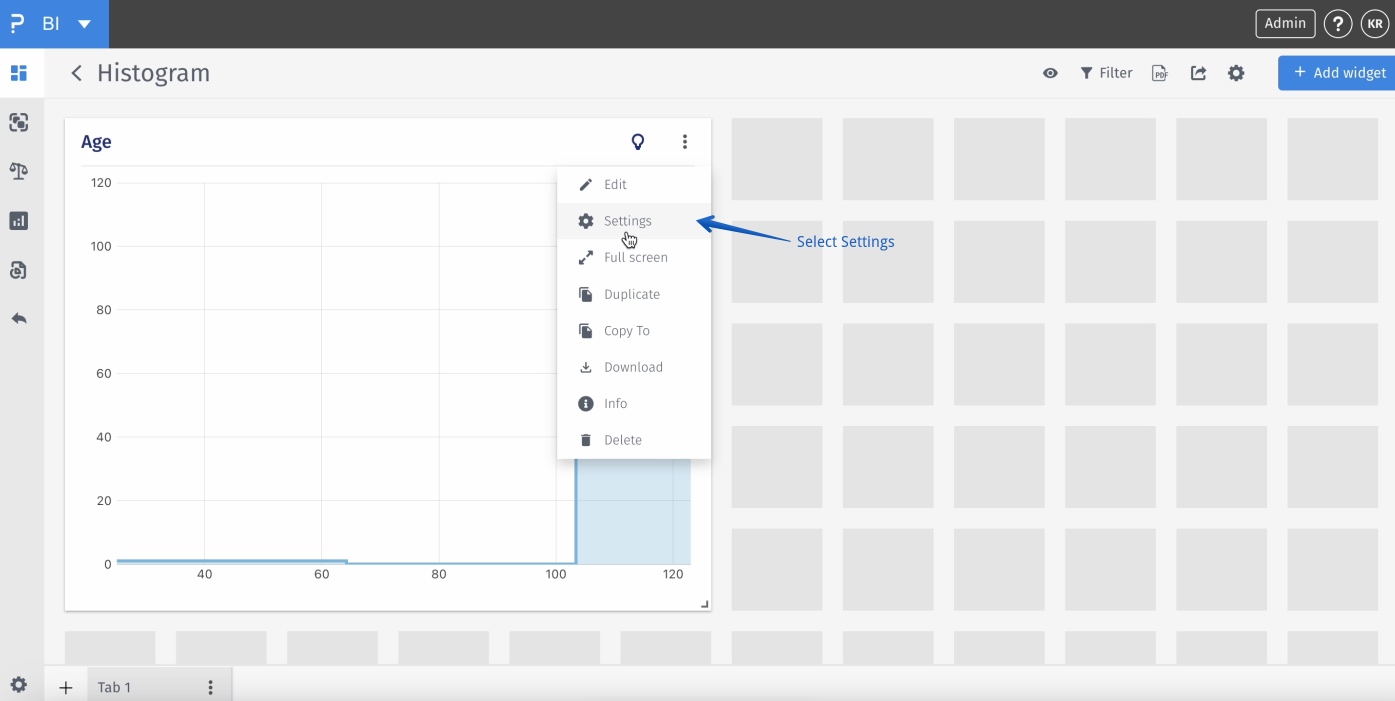
BI -> 3 dots
BI -> 3 dots -> Settings
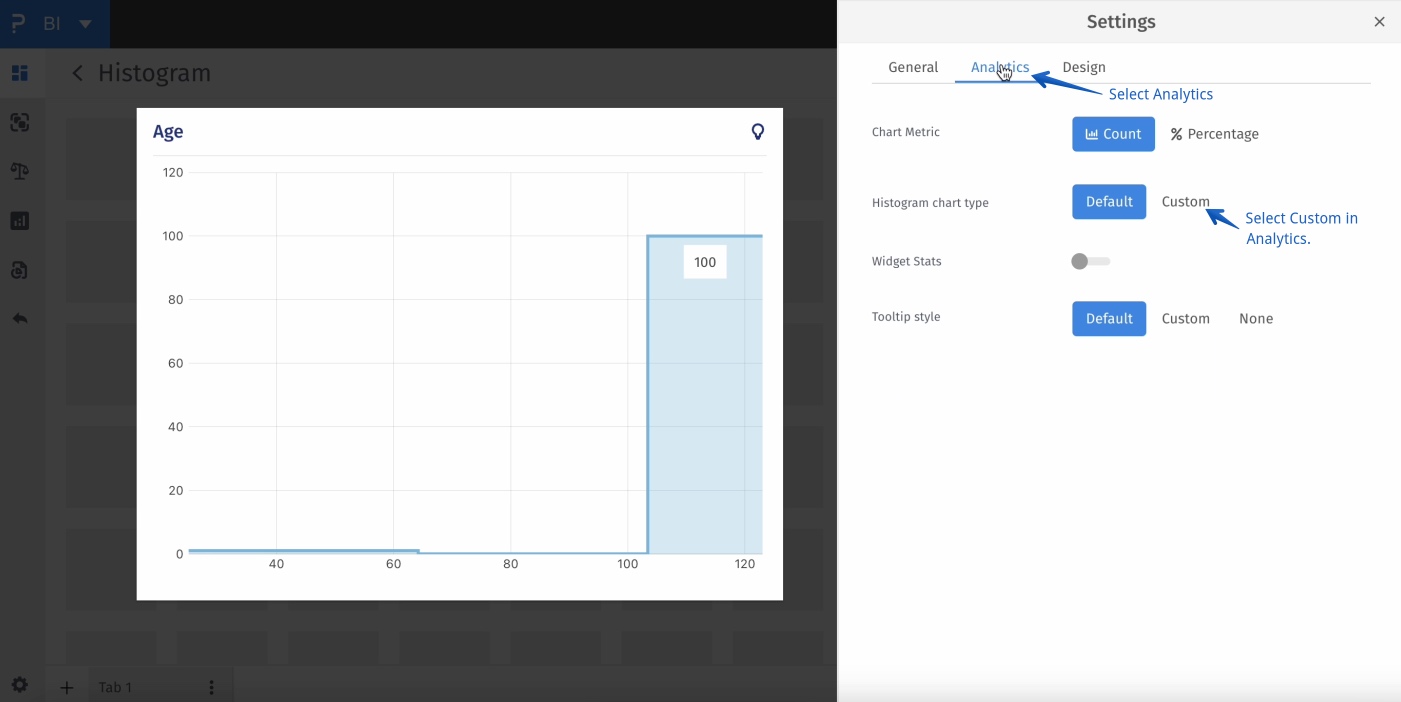
BI -> 3 dots -> Settings -> Analytics -> Custom
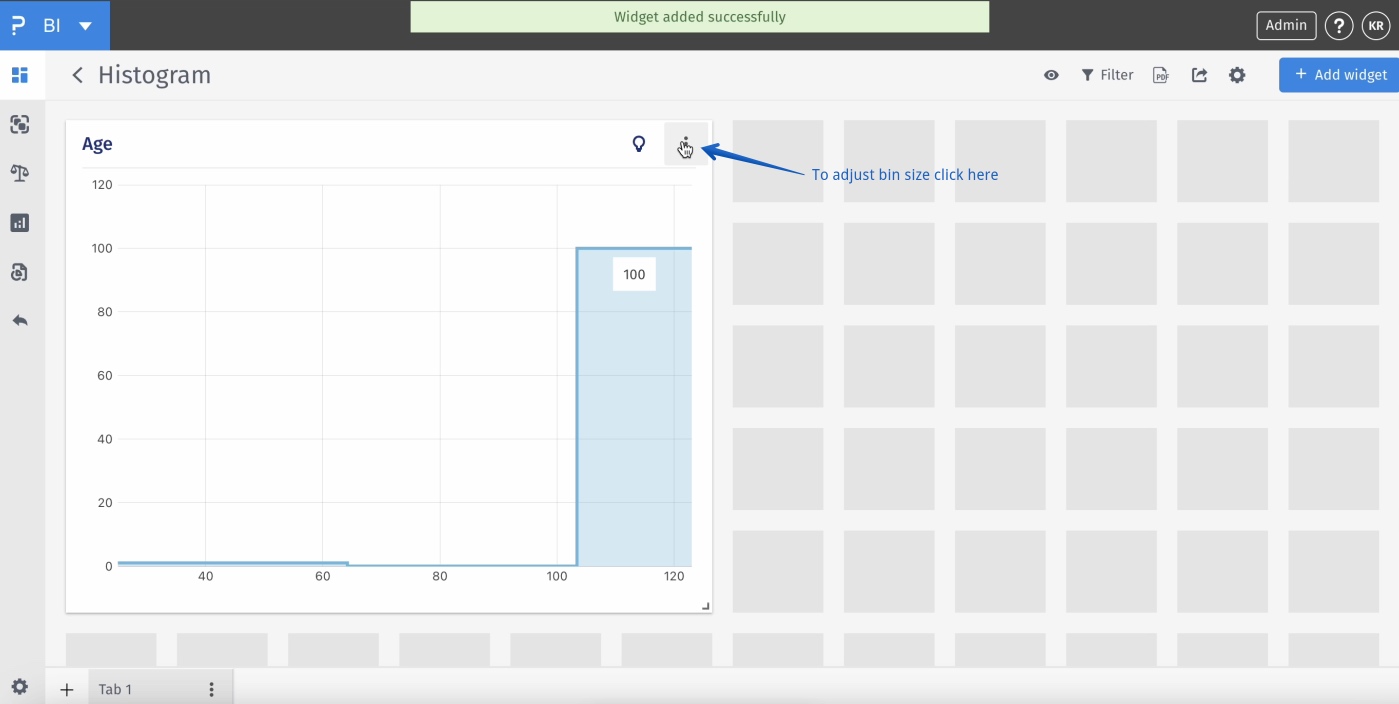
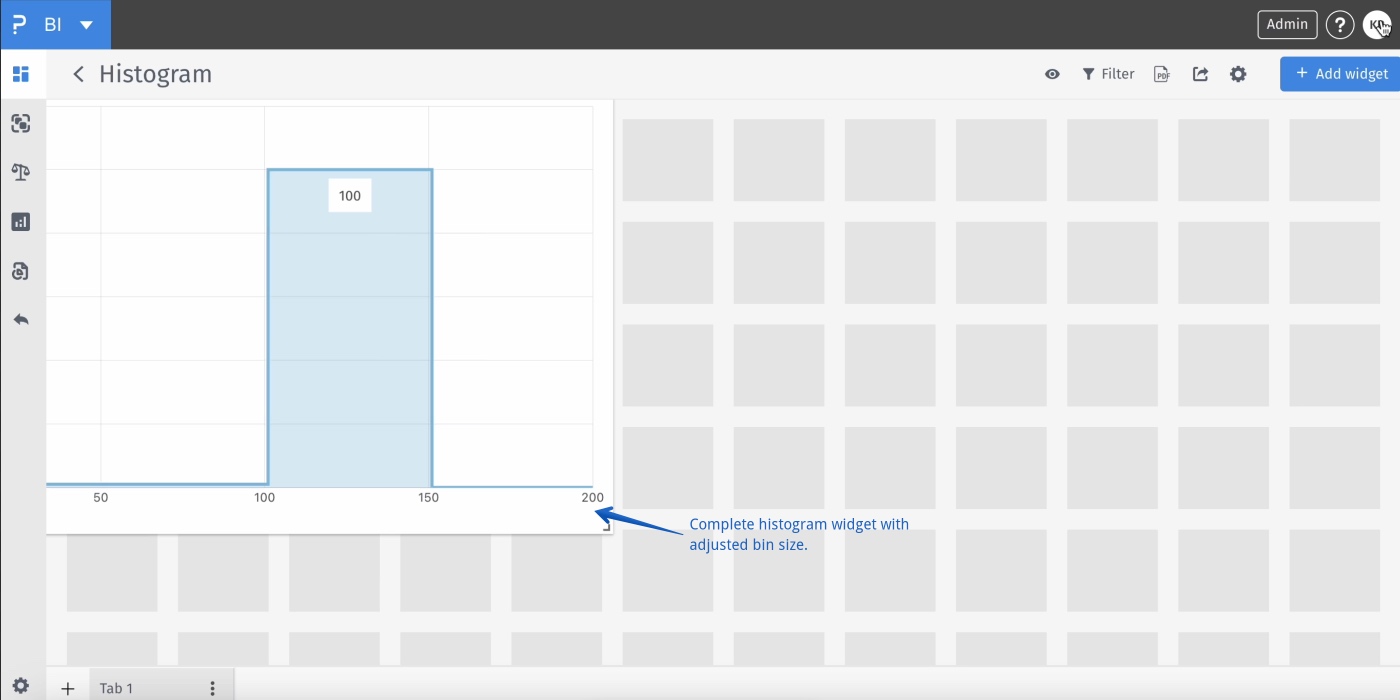
BI -> 3 dots -> Settings -> Analytics -> Custom -> Change Bin size

BI -> 3 dots -> Settings -> Analytics -> Custom -> Change Bin size -> Histogram widget
- Field Selector: Supports numeric data only, including integers.
- Bin Control:
- Manual Binning: Define custom bin ranges.
- Auto Binning: Automatically creates bins based on distribution and bin width.
- Bin Width: Sets the size of each bin (e.g., 5-unit intervals).
- Chart Display:
- Dynamic updates as settings change.
- Hover tooltips showing bin range and frequency.
- Customization Panel: Modify title, axis labels, number of bins, and color scheme.
Bin: A range or interval grouping data points; forms the base of histogram bars. Choosing the right bin width balances detail with readability.
Frequency: Count of data points within a bin; bar height in a histogram represents frequency.
Cumulative Histogram: Displays cumulative frequencies, showing running totals and aiding percentile/quantile estimation.
Normalized: Frequencies expressed as percentages of total data, allowing comparison between different-sized samples.
This feature is available with the following licenses :
Team Edition Research Edition Communities Customer Experience Workforce University - Research Edition