


Scoring Donut Widget
The Scoring Donut is a sleek, intuitive data visualization component designed to showcase scoring metrics such as averages, satisfaction scores, or performance ratings in a circular, donut-style chart. It excels at showcasing scoring metrics like averages, satisfaction scores, and performance ratings. This makes it ideal for dashboards, reports, and presentations where conveying overall performance at a glance is crucial.
The donut chart's key strength lies in its ability to represent numeric scores within a circular format. This allows for intuitive interpretation, as the viewer can quickly gauge the score's position relative to the full range of possible values. Additionally, the central hole can be utilized to display the actual score or other relevant information, further enhancing the chart's informational value.
By leveraging the Scoring Donut's visual impact and clarity, users can effectively communicate complex scoring data to a wide audience, regardless of their technical expertise. This makes it a valuable tool for data-driven decision-making and performance tracking across various industries and applications.
Purpose and Benefits- Compact and Visually Appealing: Scoring Donut charts efficiently display critical metrics in a visually engaging and concise manner, making them easy to understand at a glance.
- Instant Clarity: The circular design provides immediate comprehension of scores and performance levels, enhancing the effectiveness of dashboards and reports.
- Versatility: Gauge charts can be customized to suit diverse applications, including:
- Survey Data Visualization: Displaying survey response scores, such as customer satisfaction ratings or employee engagement levels
- Performance Tracking: Visualizing team or individual performance metrics, such as sales targets or key performance indicators (KPIs)
- Customizability: Scoring Donut charts offer flexibility in terms of colors and labels, allowing for adaptation to specific requirements and branding guidelines.
Score Representation
- Displays numeric scores (e.g., 75 out of 100) at the center of the donut.
- Supports multiple scoring formats: percentage, 5-point scale, 10-point scale, etc.
- The colored arc around the center represents the score proportionally.
- Customizable colors based on thresholds or scoring tiers (e.g., green for high scores, red for low).
- Scores update in real time when underlying data changes.
- Ideal for interactive dashboards where user inputs or filters affect the displayed score.
Coming Soon
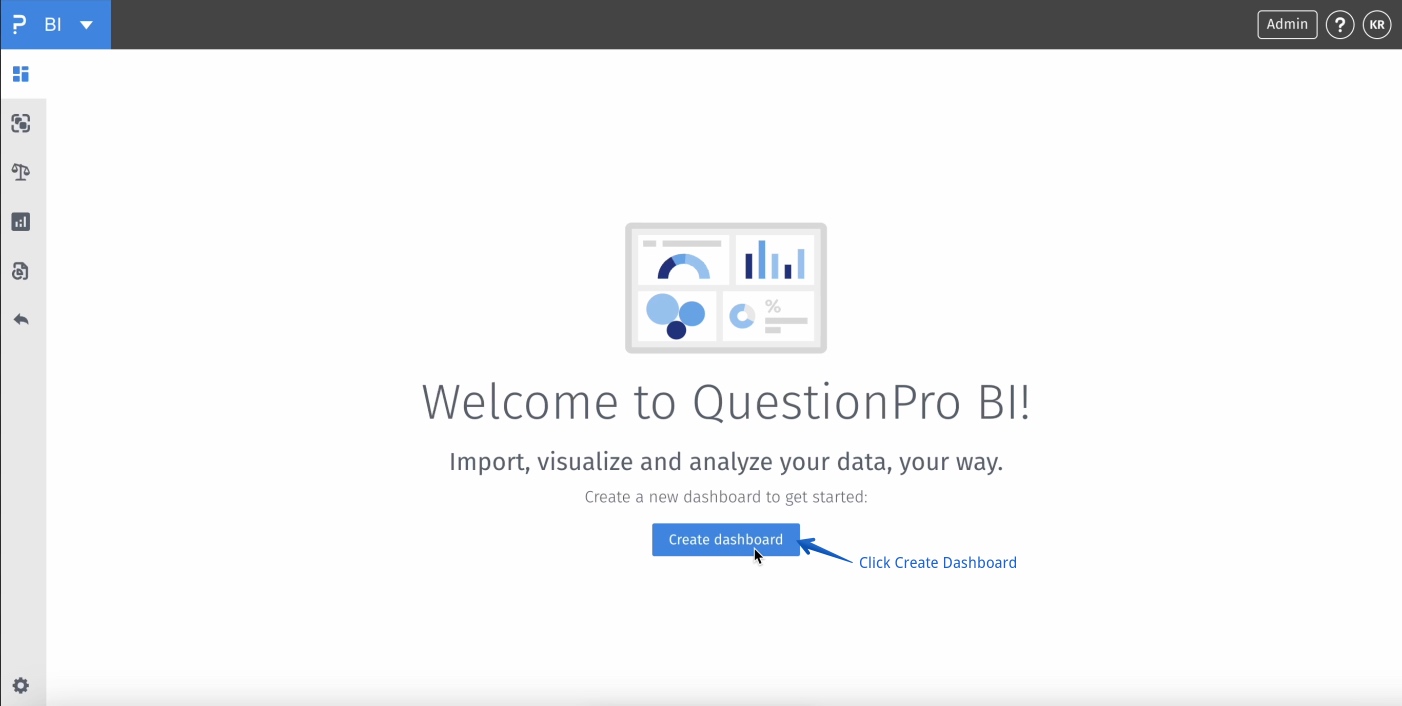
BI -> Create dashboard
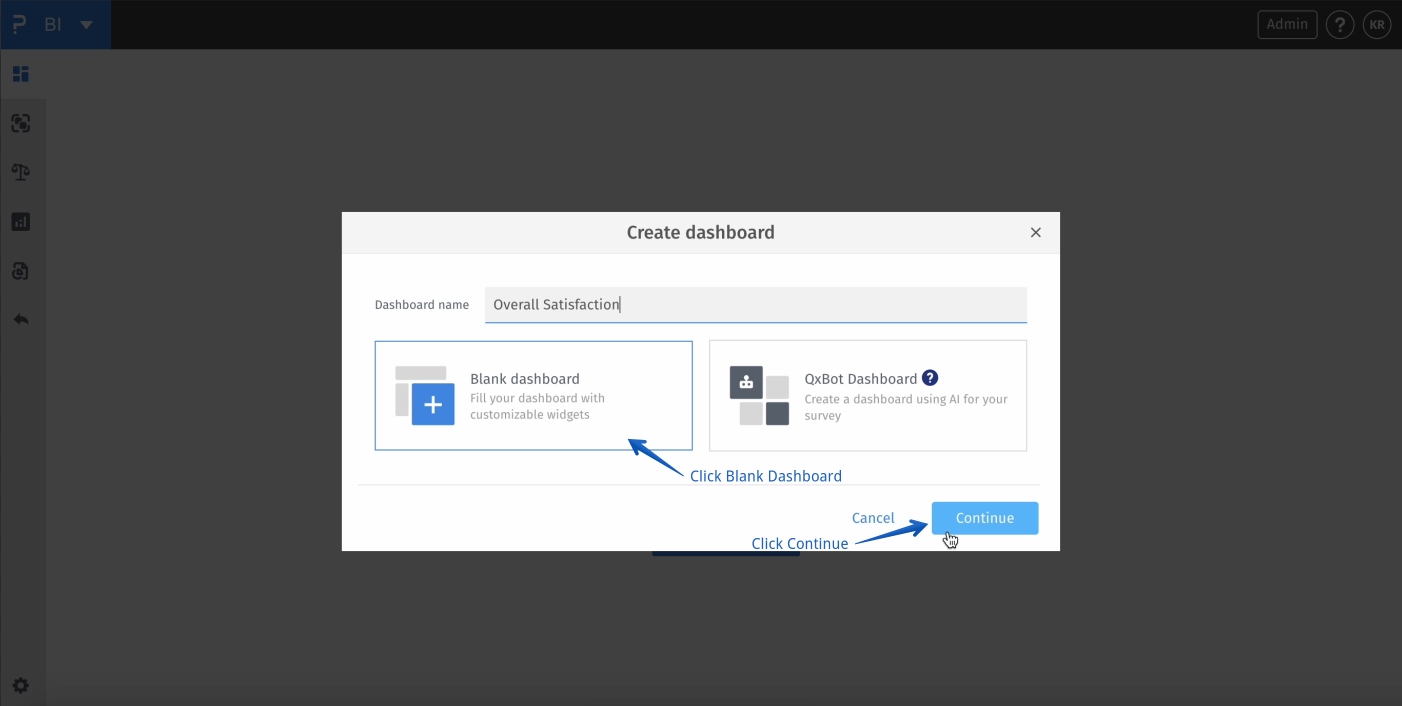
BI -> Create dashboard -> Blank Dahboard -> Continue
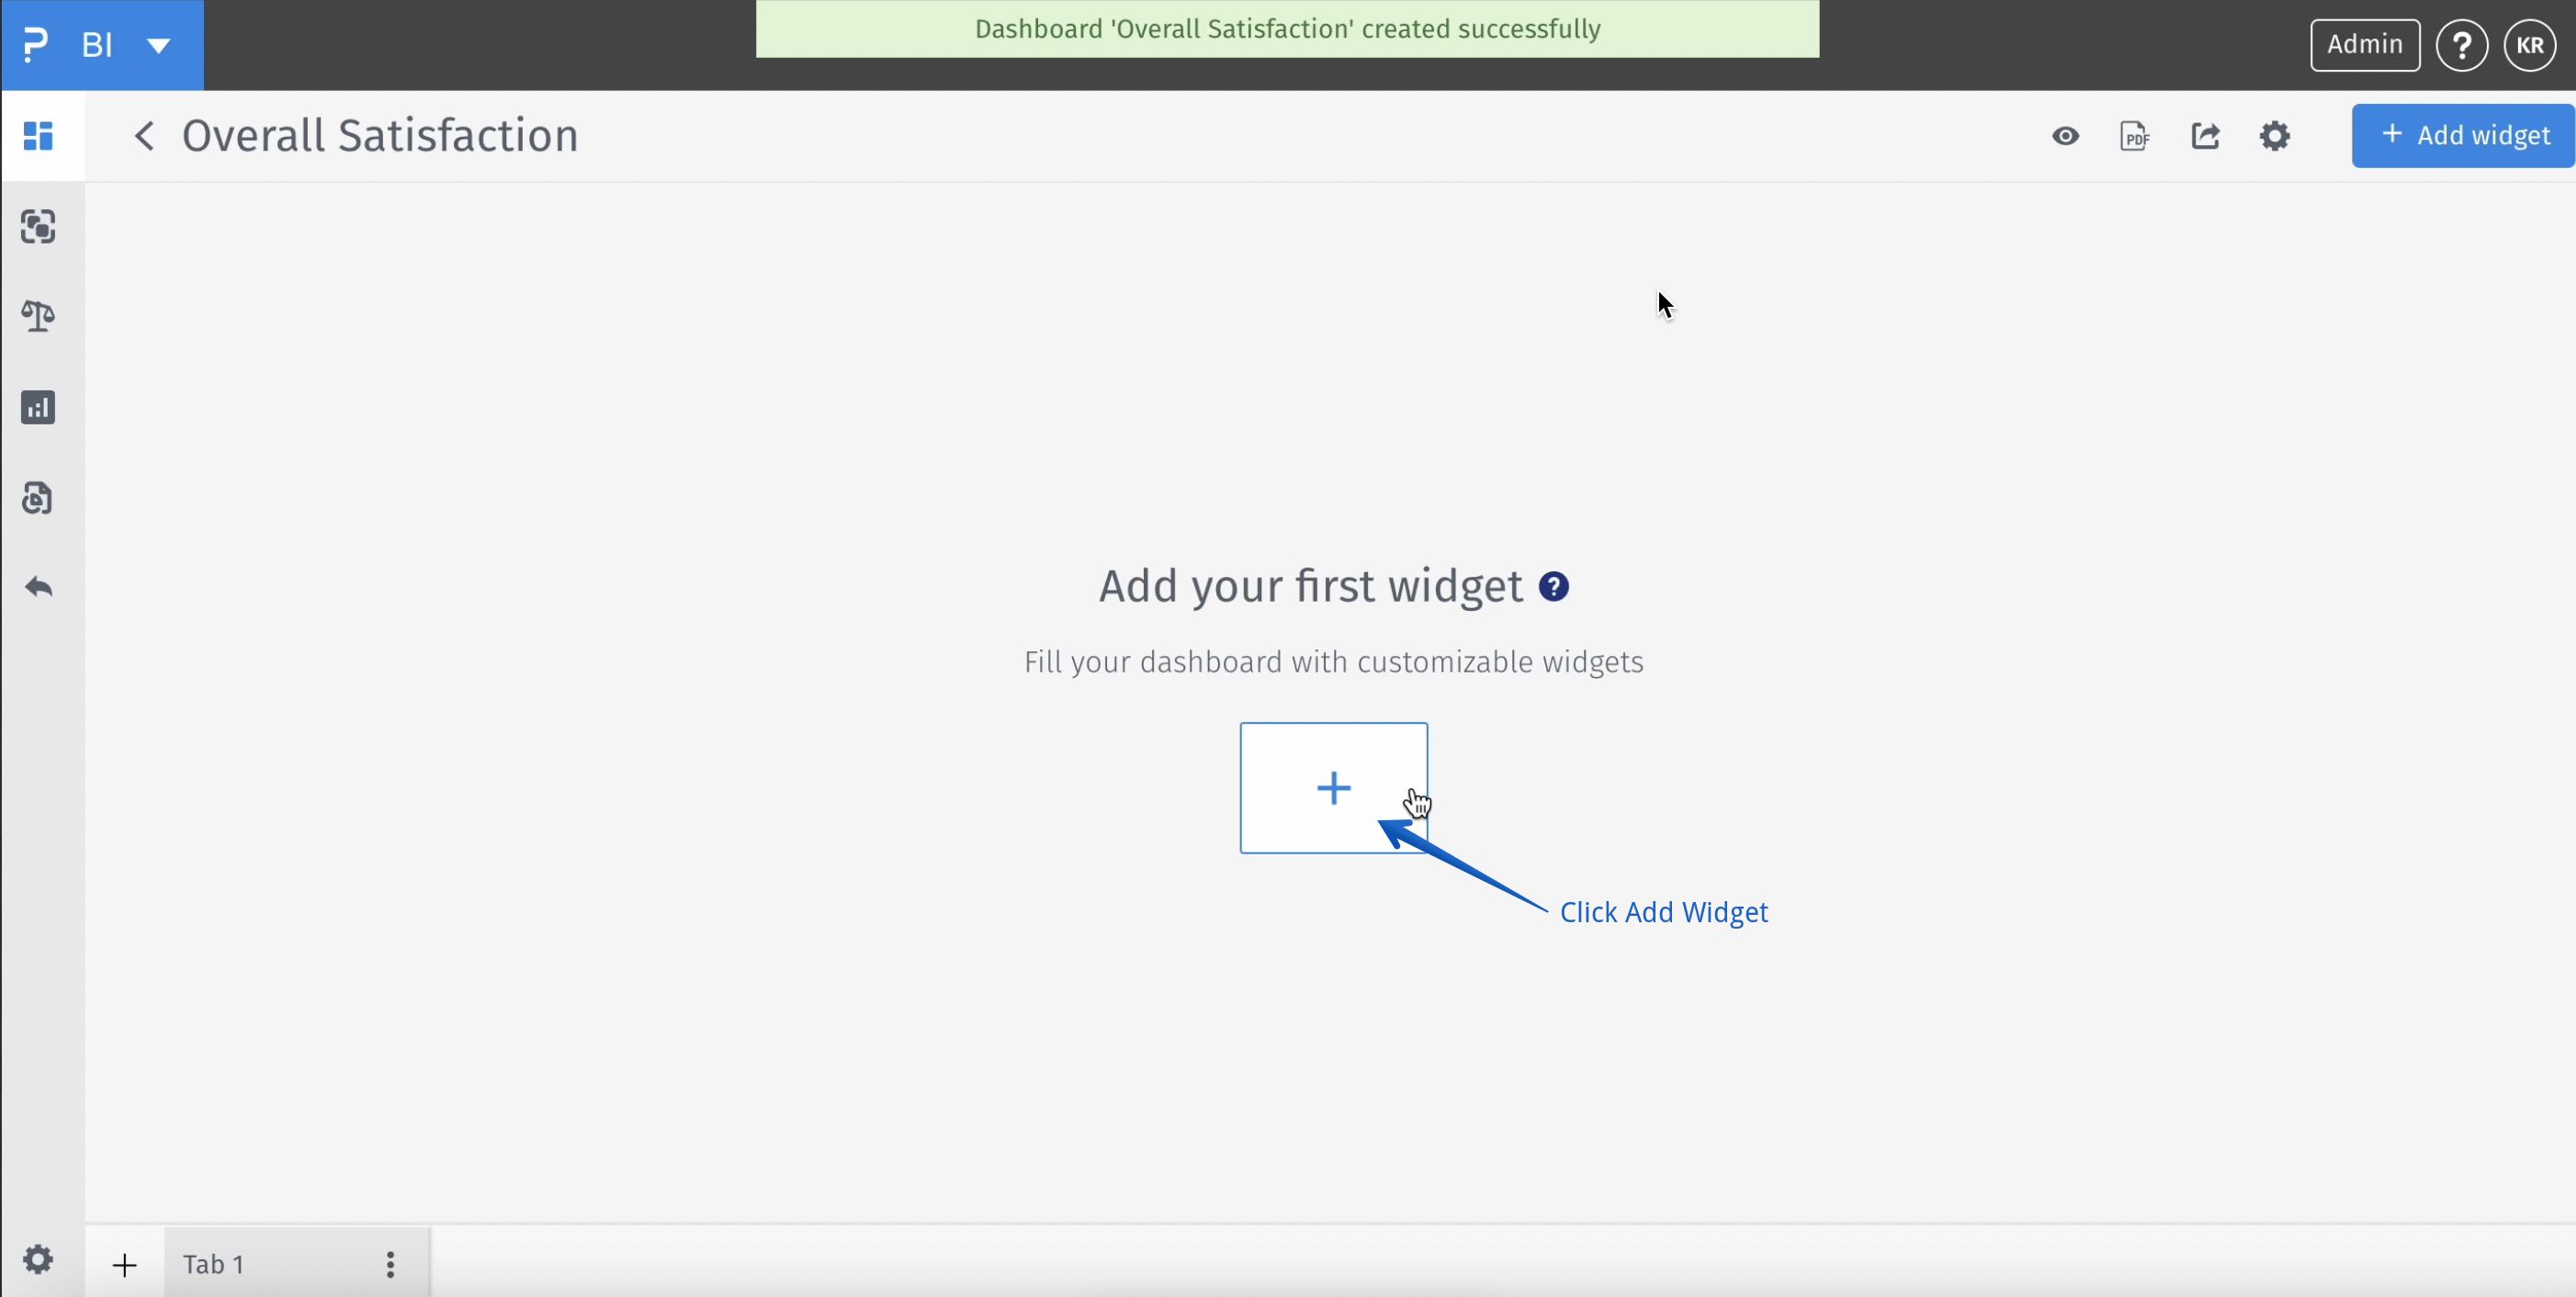
BI -> Create dashboard -> Blank Dahboard -> Continue -> Add Widget
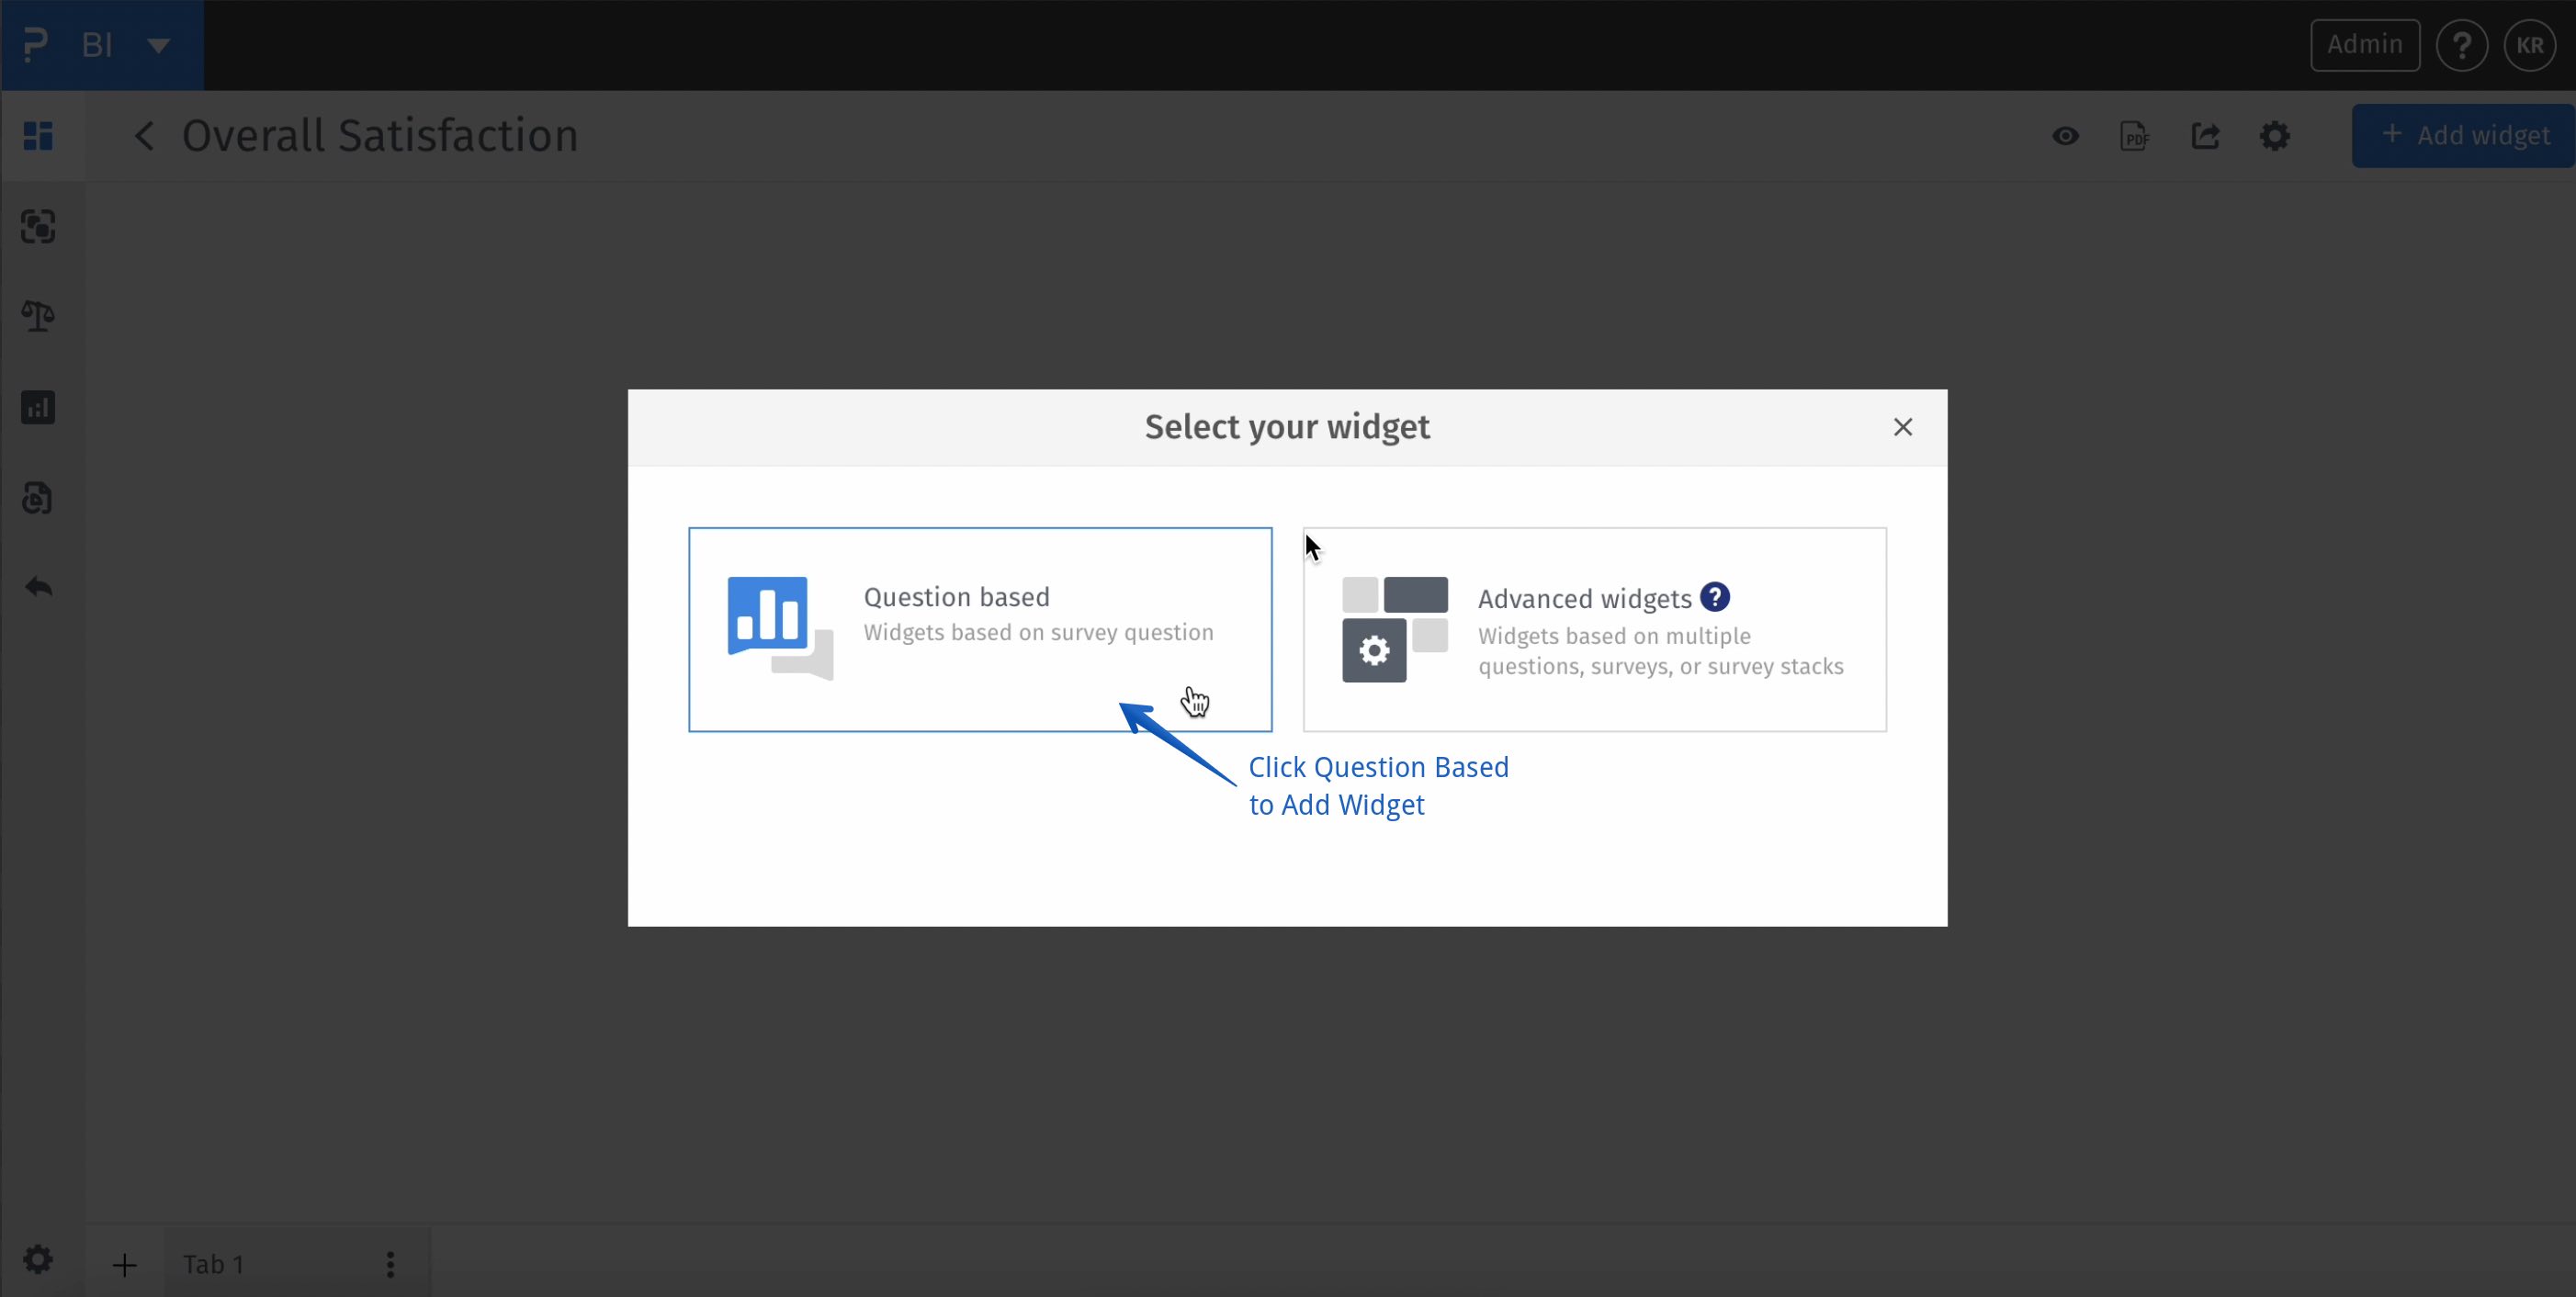
BI -> Create dashboard -> Blank Dahboard -> Continue -> Add Widget -> Question Based
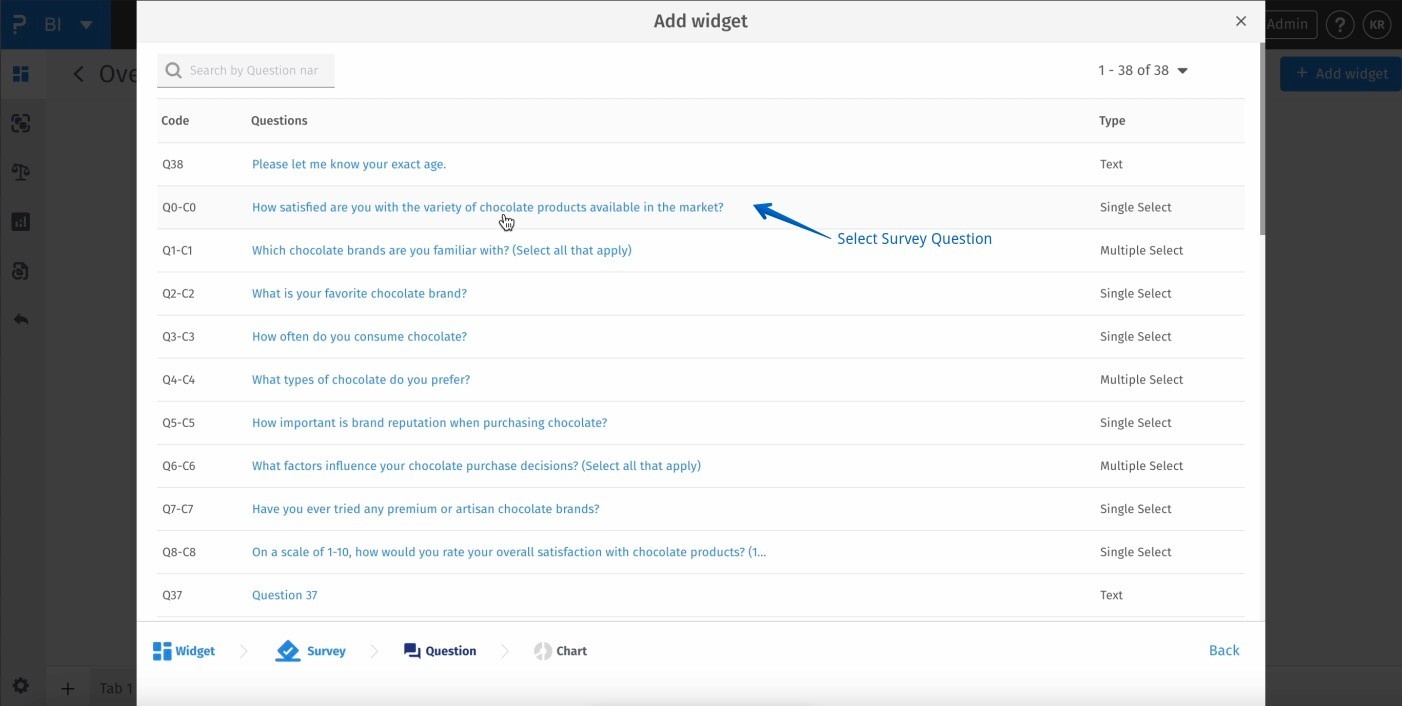
BI -> Create dashboard -> Blank Dahboard -> Continue -> Add Widget -> Question Based -> Select Survey
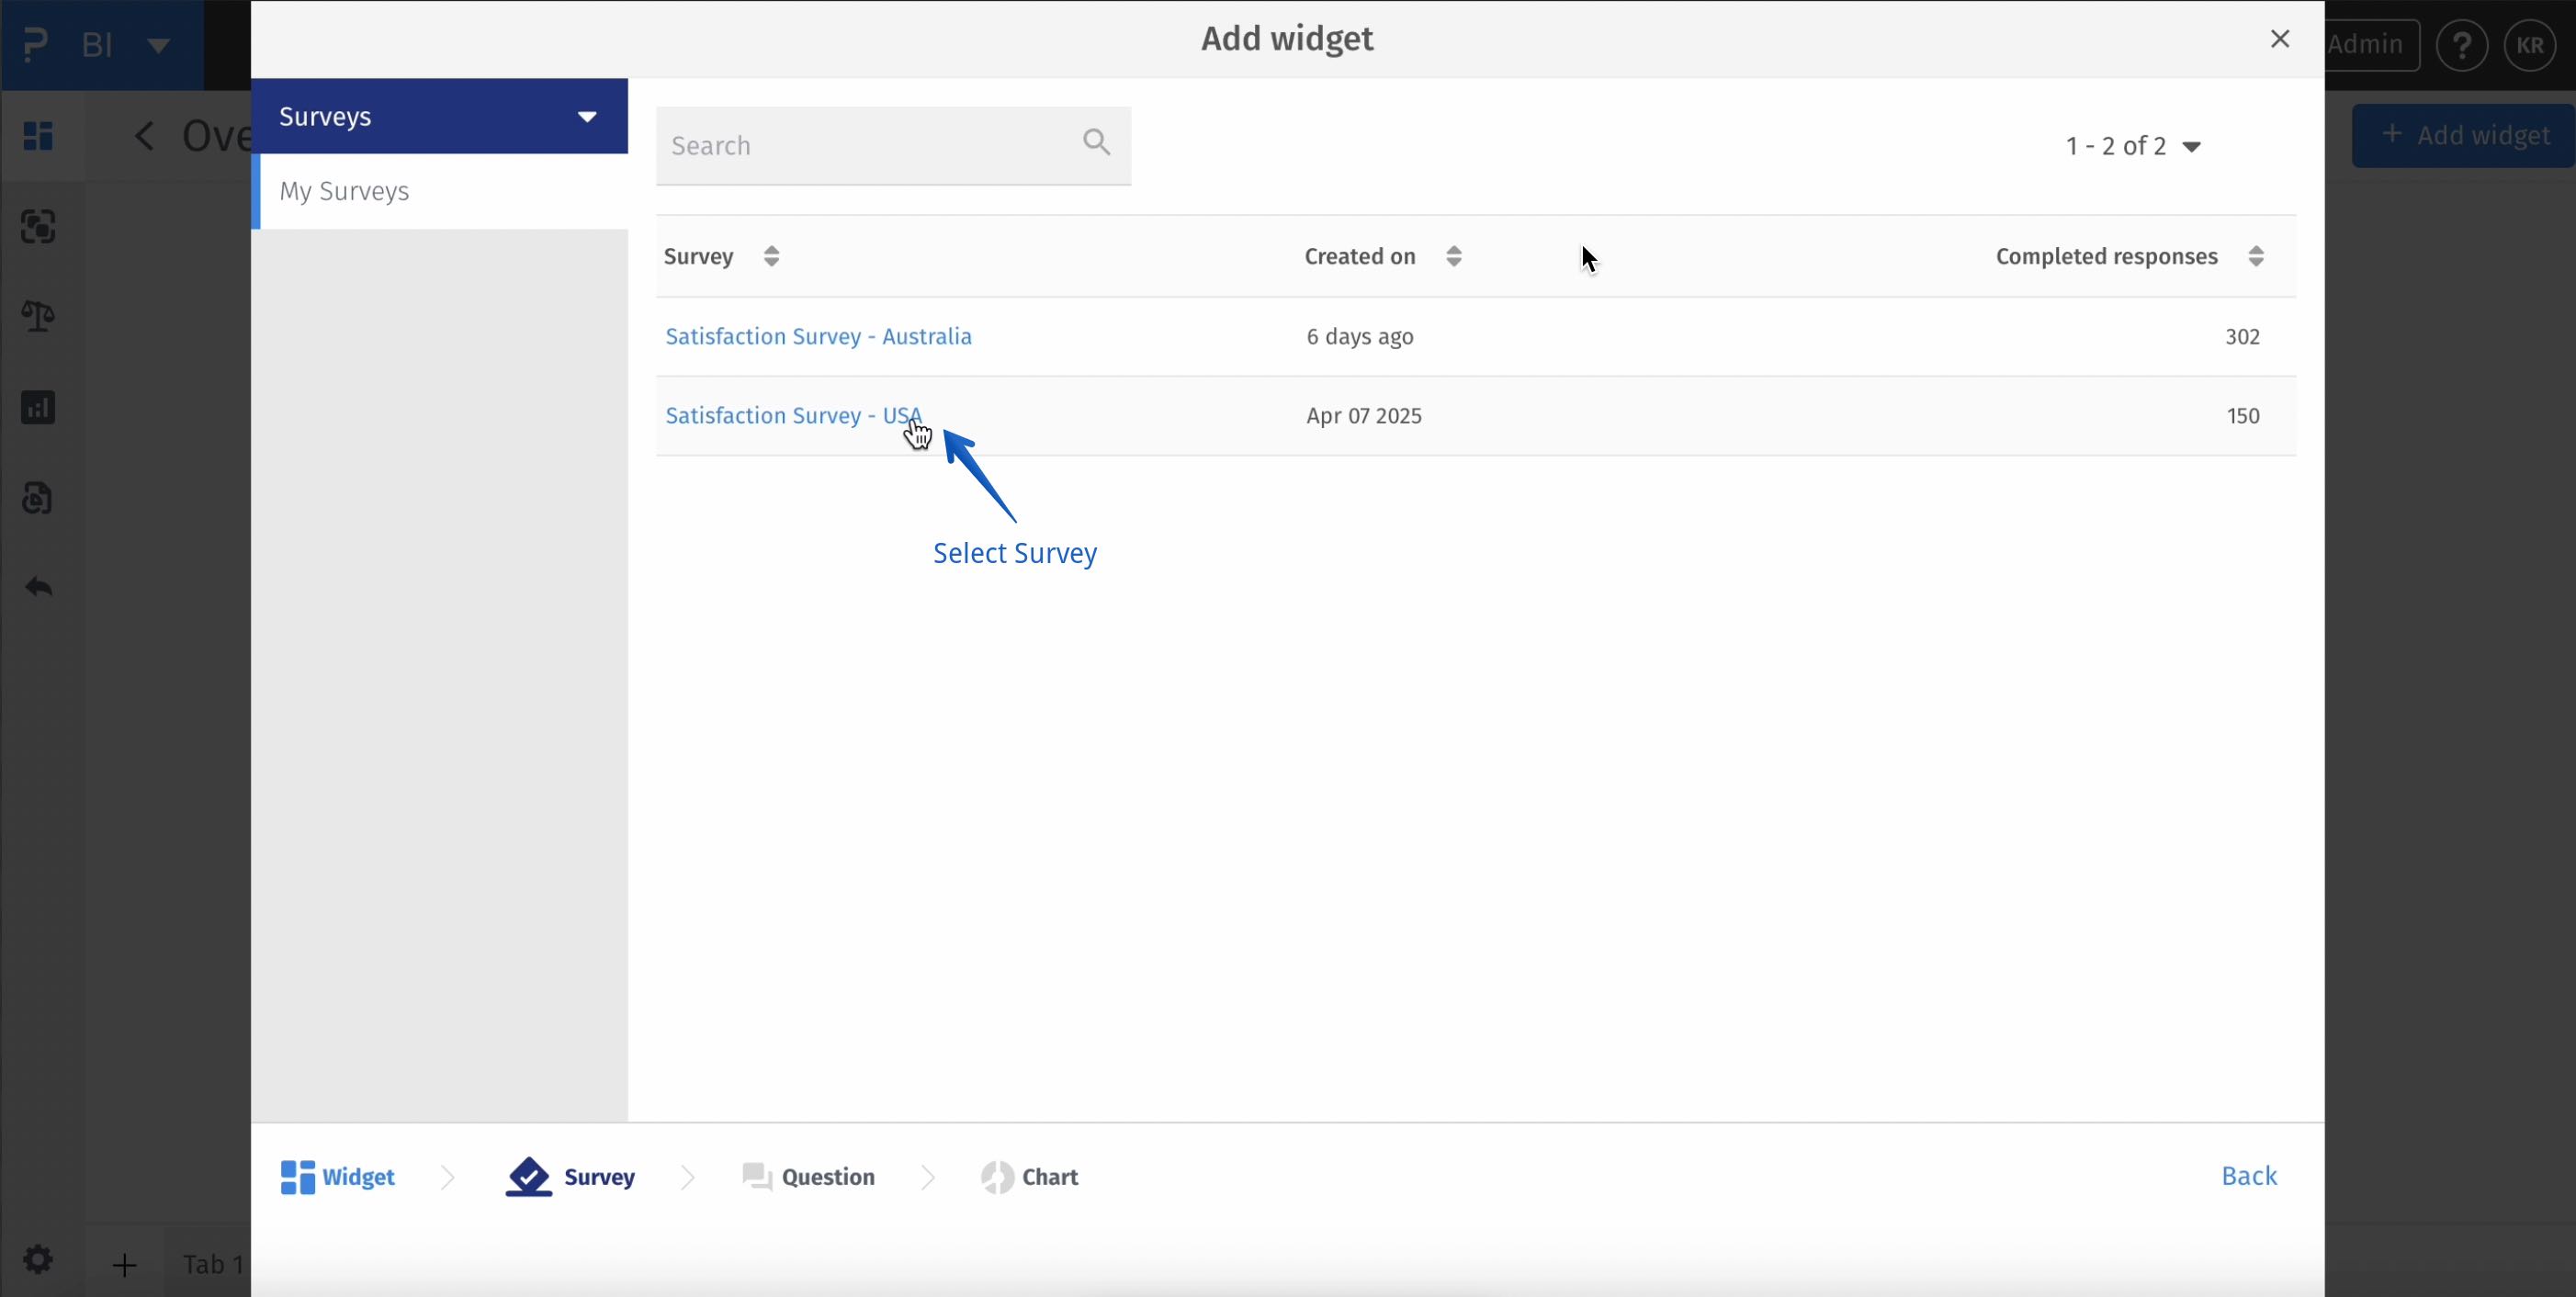
BI -> Create dashboard -> Blank Dahboard -> Continue -> Add Widget -> Question Based -> Select Survey
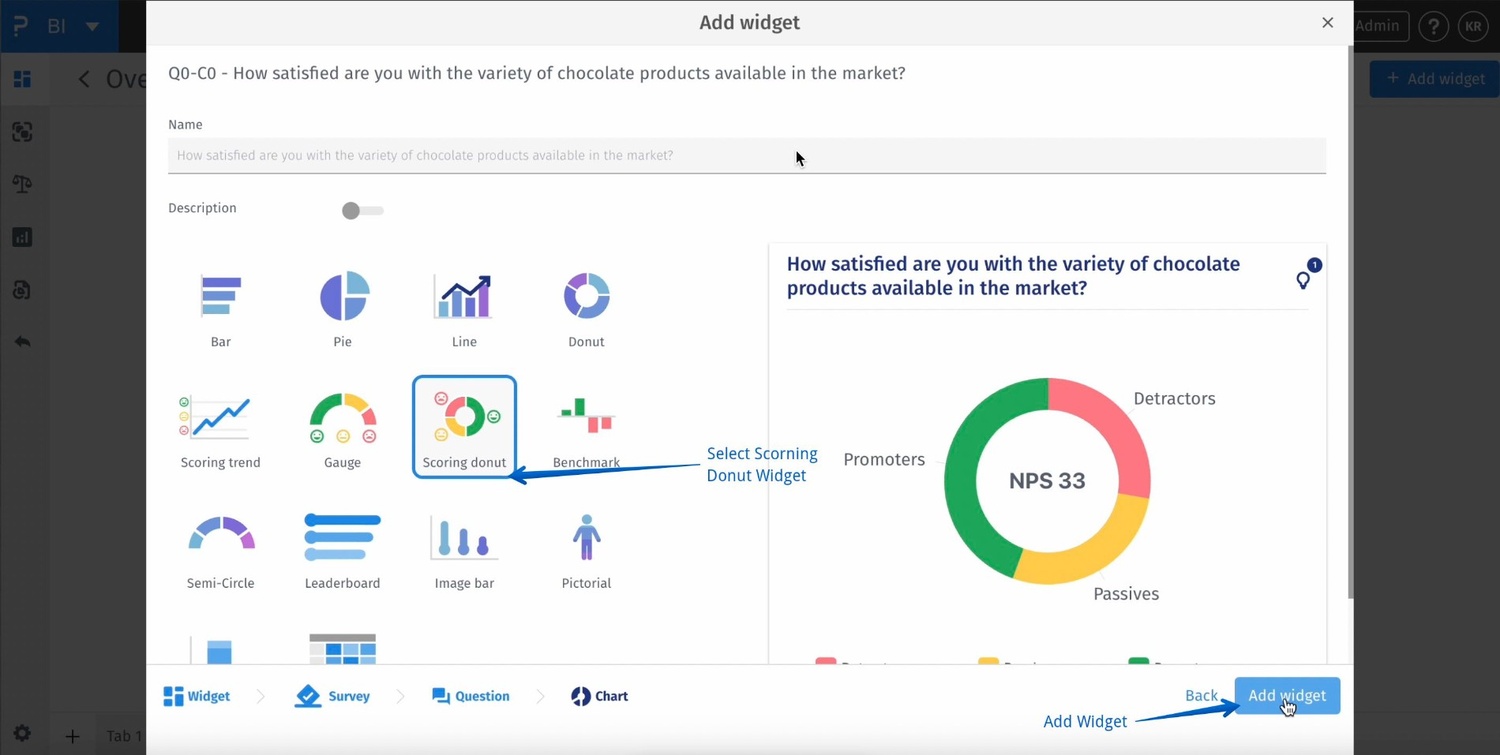
BI -> Create dashboard -> Blank Dahboard -> Continue -> Add Widget -> Question Based -> Select Survey -> Scorning Donut Widget -> Add Widget
BI -> Scorning Donut Widget -> 3 dots -> Settings
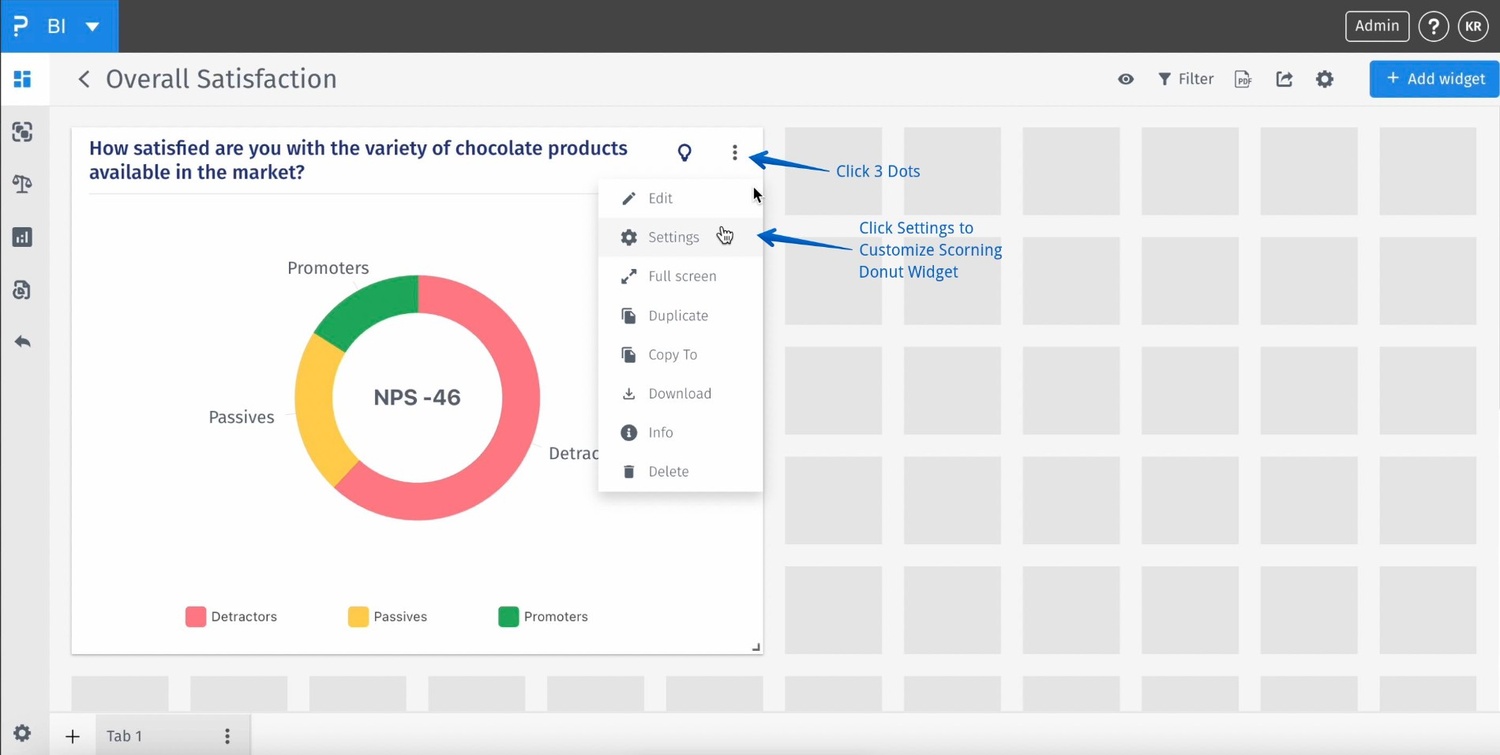
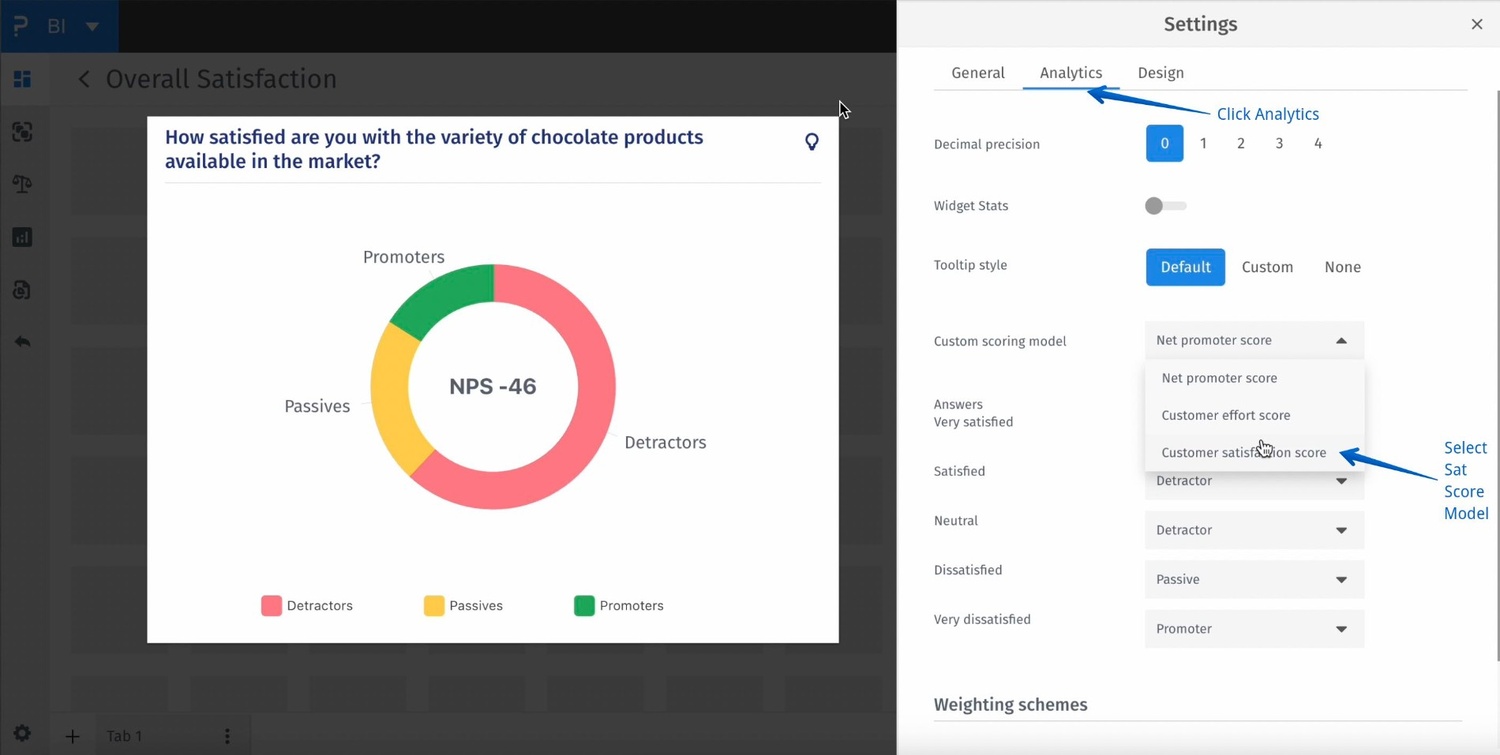
BI -> Scorning Donut Widget -> 3 dots -> Settings -> Analytics -> Customs Scorning Model
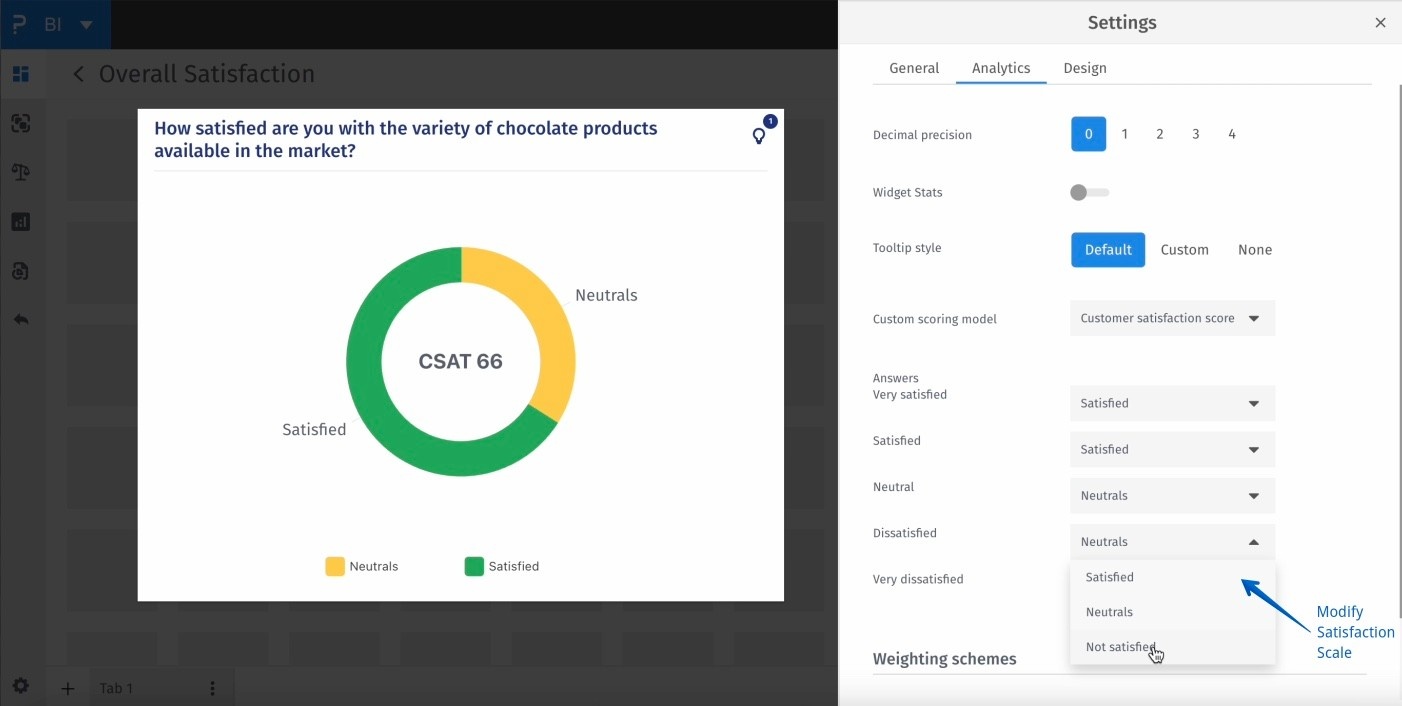
BI -> Scorning Donut Widget -> 3 dots -> Settings -> Analytics -> Scale Modification
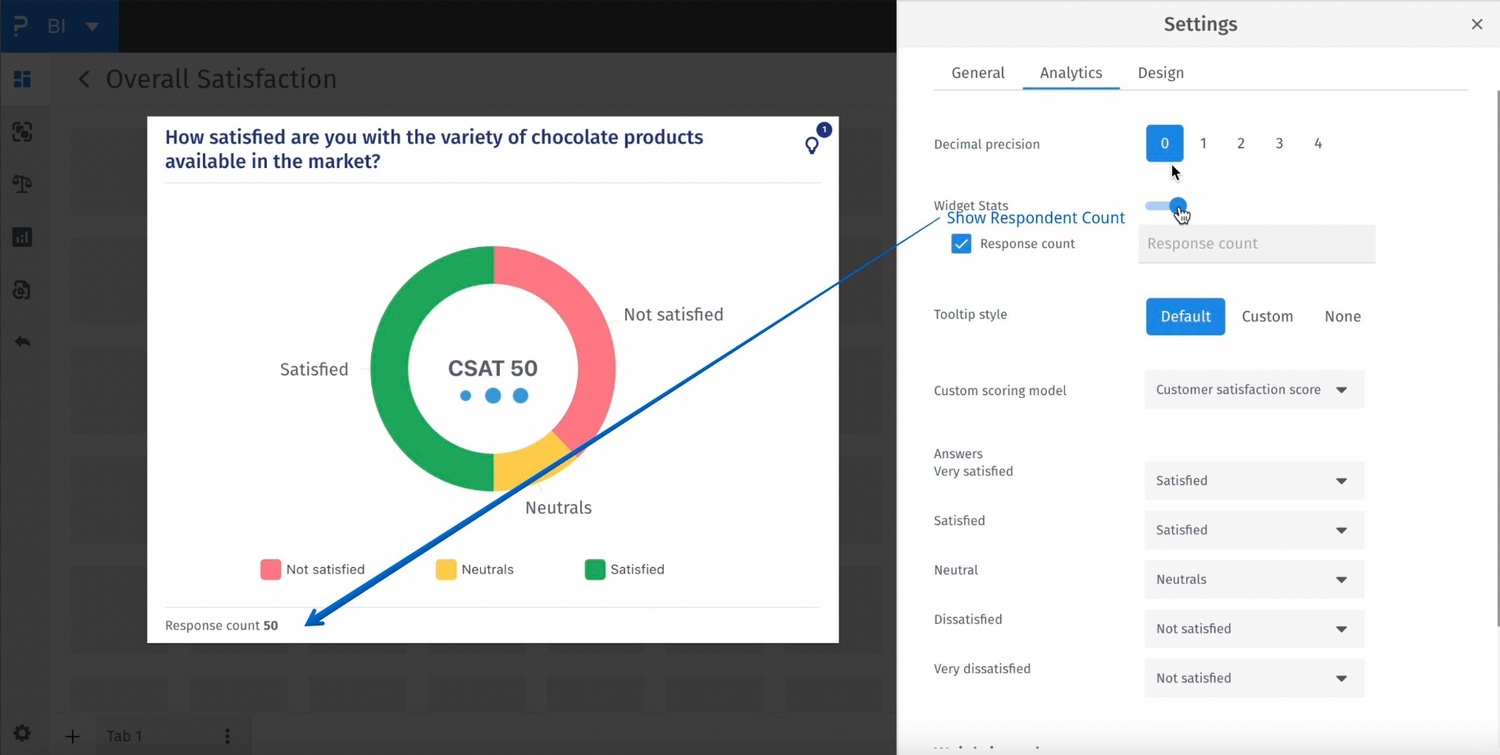
BI -> Scorning Donut Widget -> 3 dots -> Settings -> Analytics -> Widget Stats (Respondent Count)
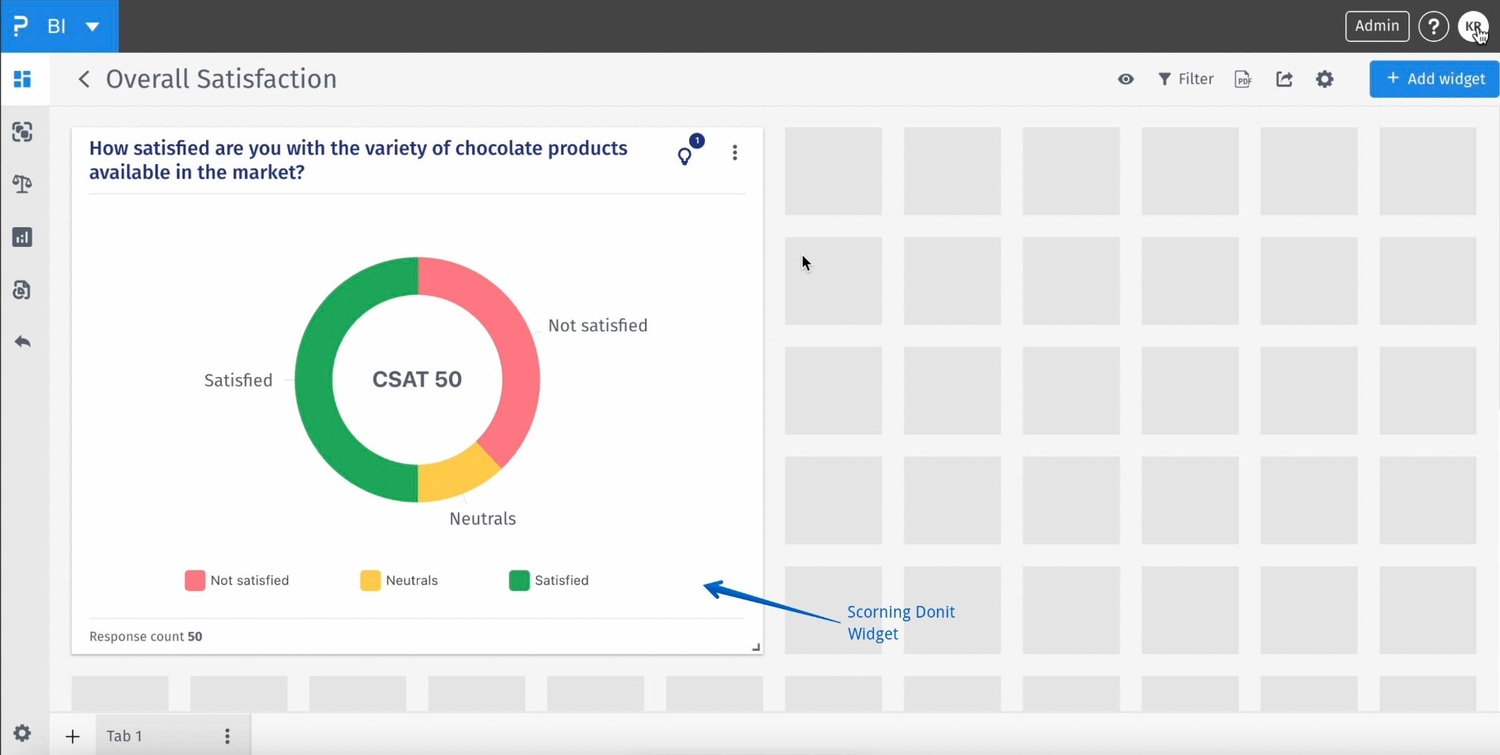
BI -> Scorning Donut Widget
- Donut Chart: A circular graph where the data value is represented in a ring shape.
- Tooltip: Small popup that appears when hovering over a chart element, providing additional data.