


Stacked Bar
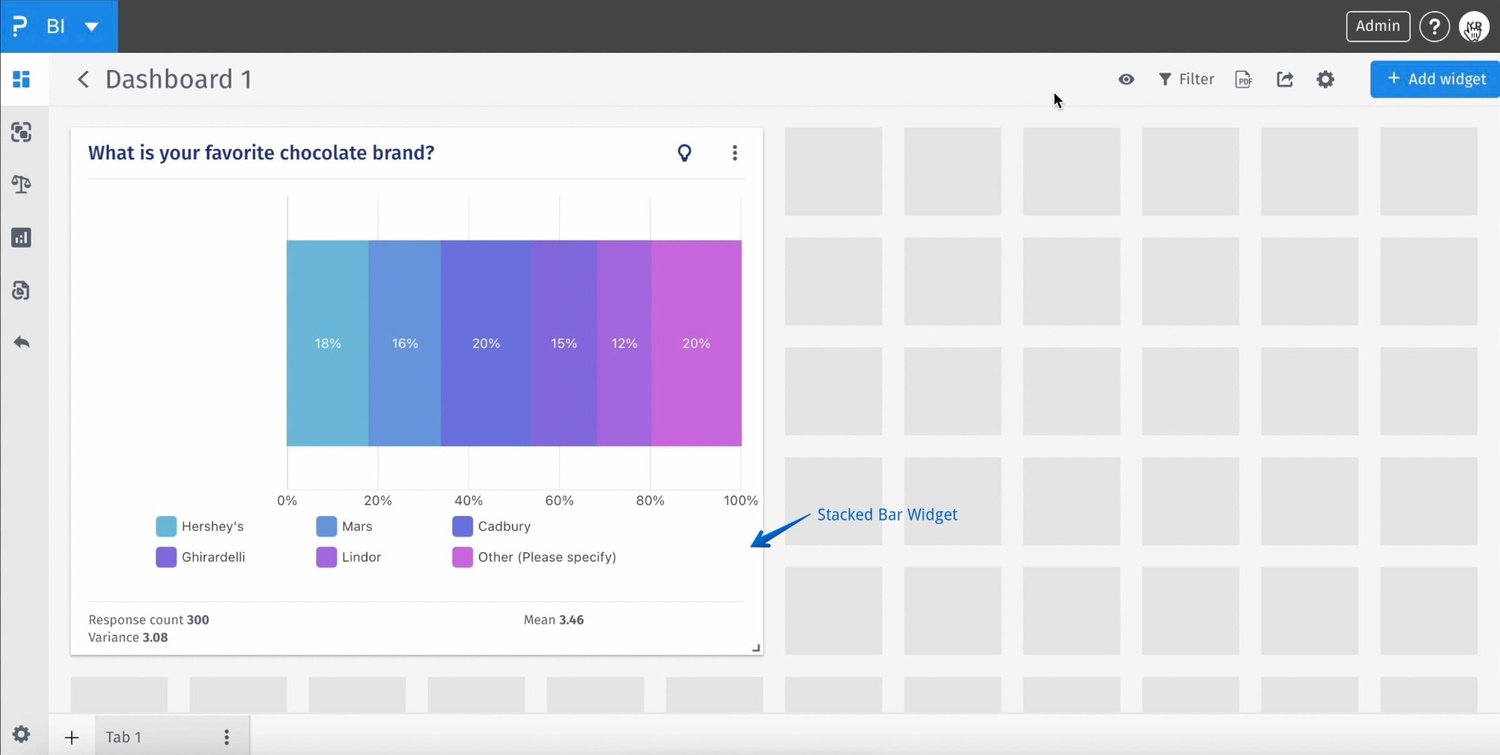
The Stacked Bar feature enables users to visualize category data using stack bar charts. This feature supports both Unichoice and Multichoice categorical variables, making it ideal for survey data where respondents may select one or multiple answers.
Purpose and Benefits:- Gain insights into the distribution and comparison of categorical data.
- Easily interpret proportions of responses within a group.
- Efficiently represent overlapping data segments in a single visual.
- Ideal for tracking multi-dimensional categorical responses over groups or time.
The Stacked Bar feature is designed to help you create insightful and layered bar charts from categorical datasets.
Supported Inputs- Unichoice Category: A category where each respondent selects only one option.
- Multichoice Category: A category where each respondent can select multiple options.
Coming Soon
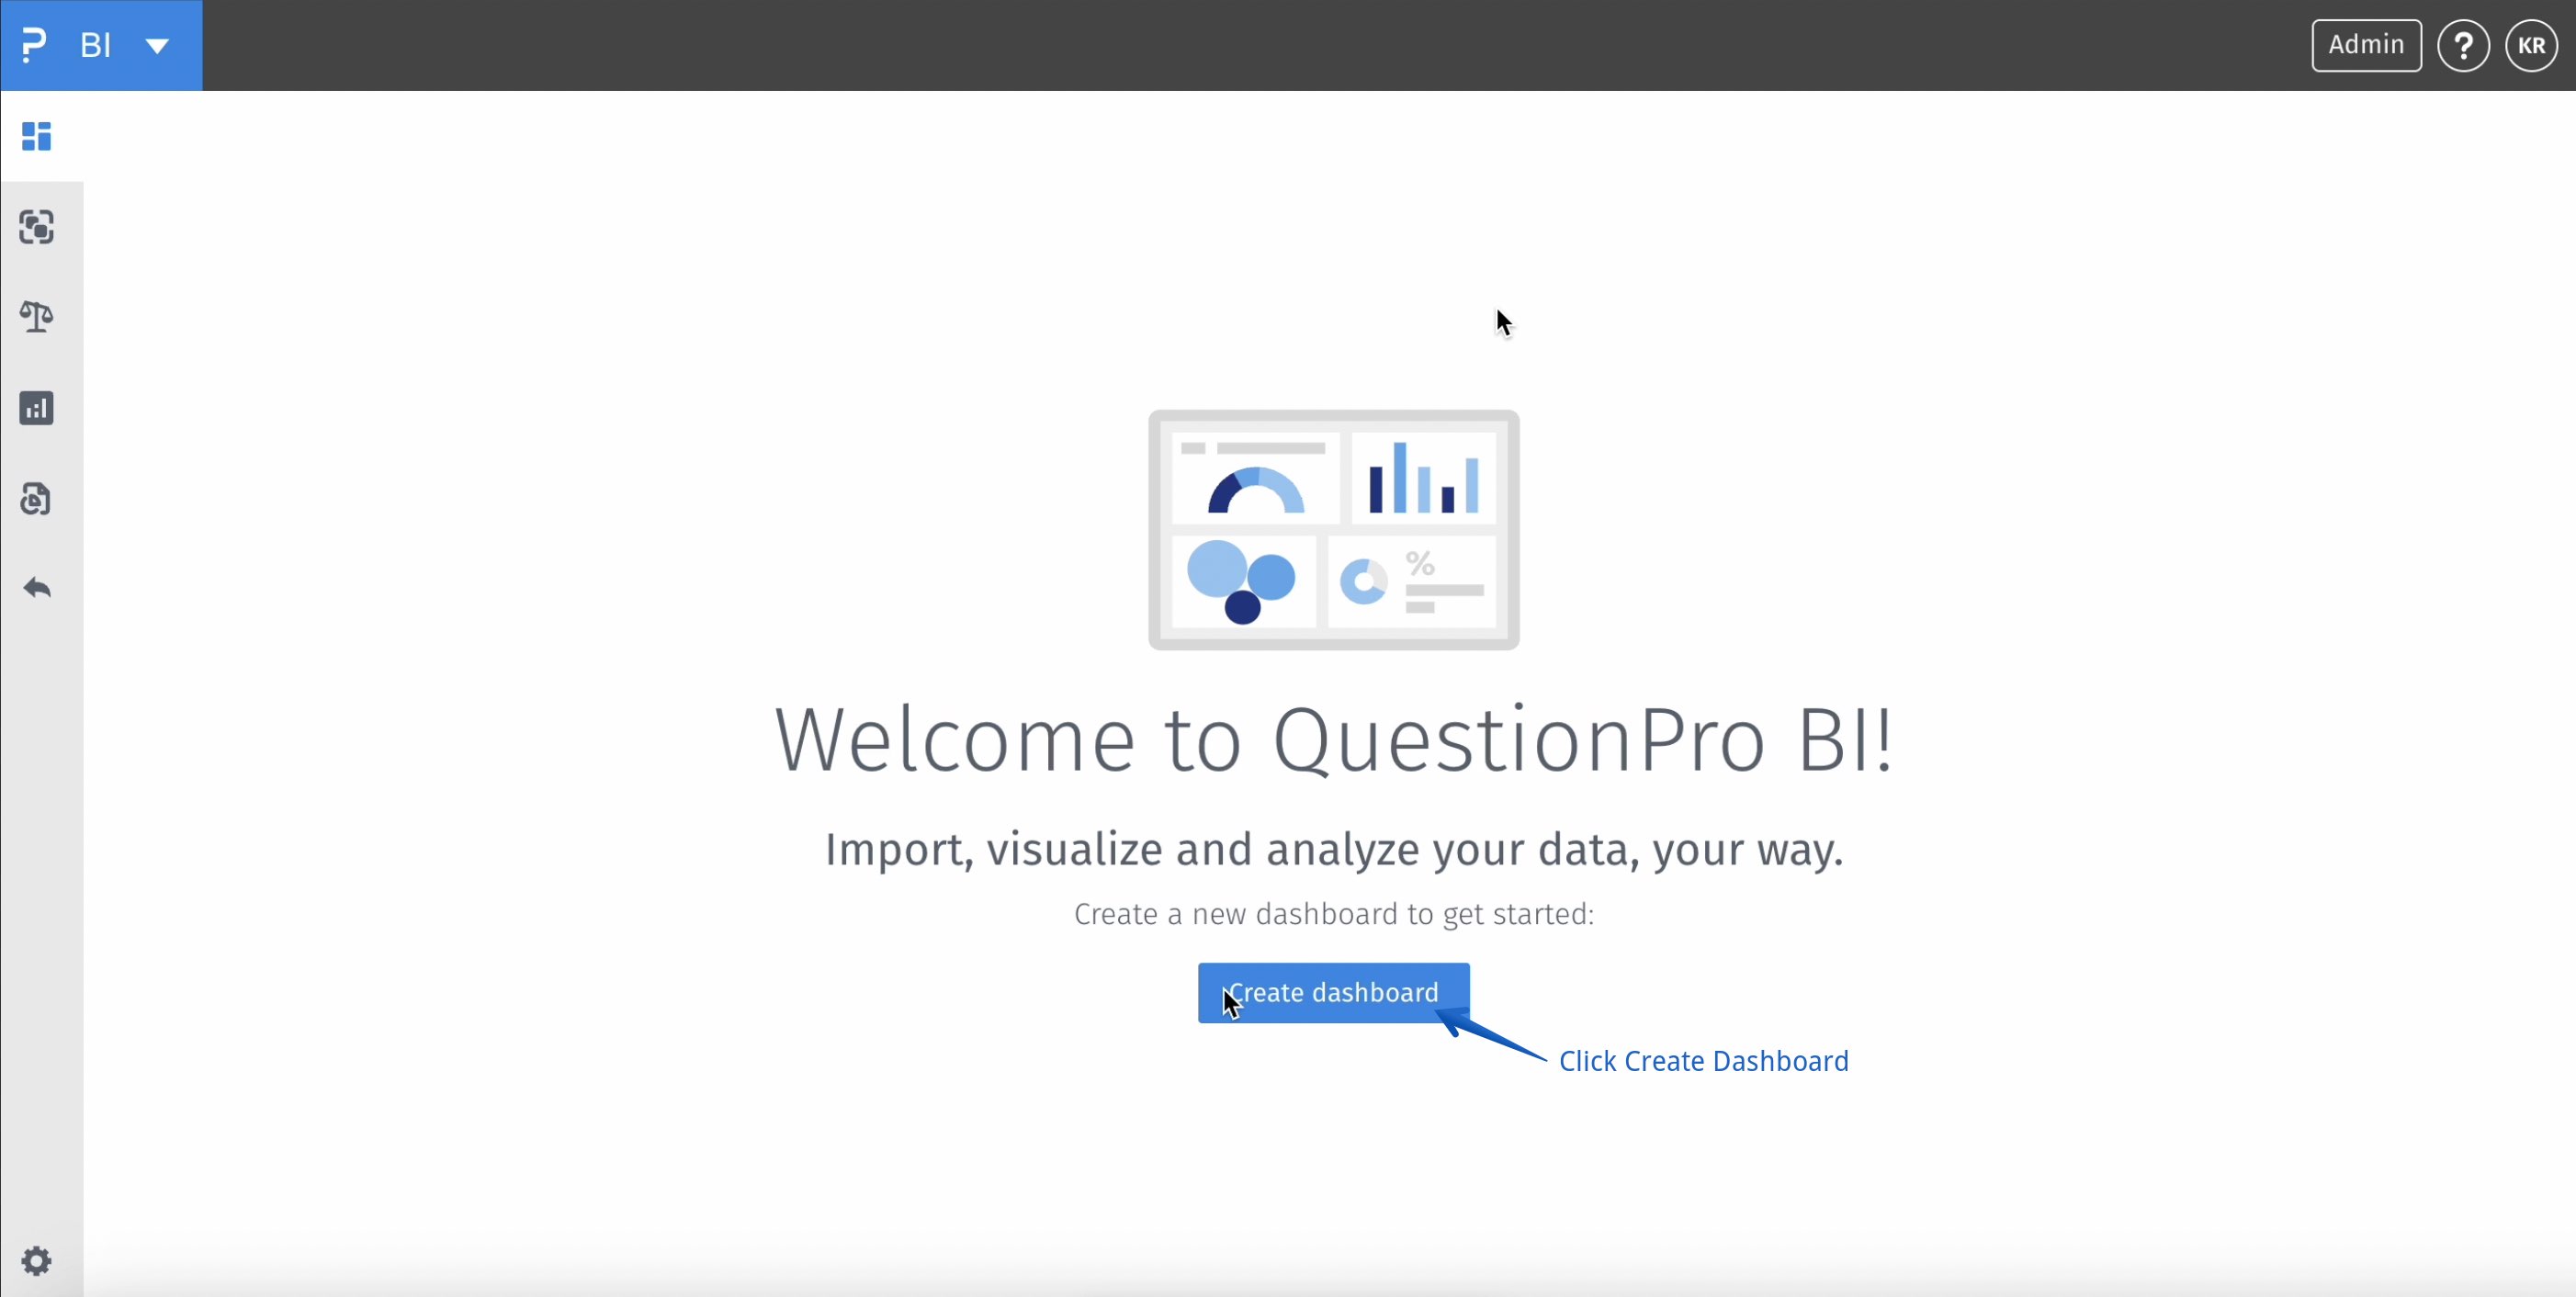
BI -> Create Dashboard
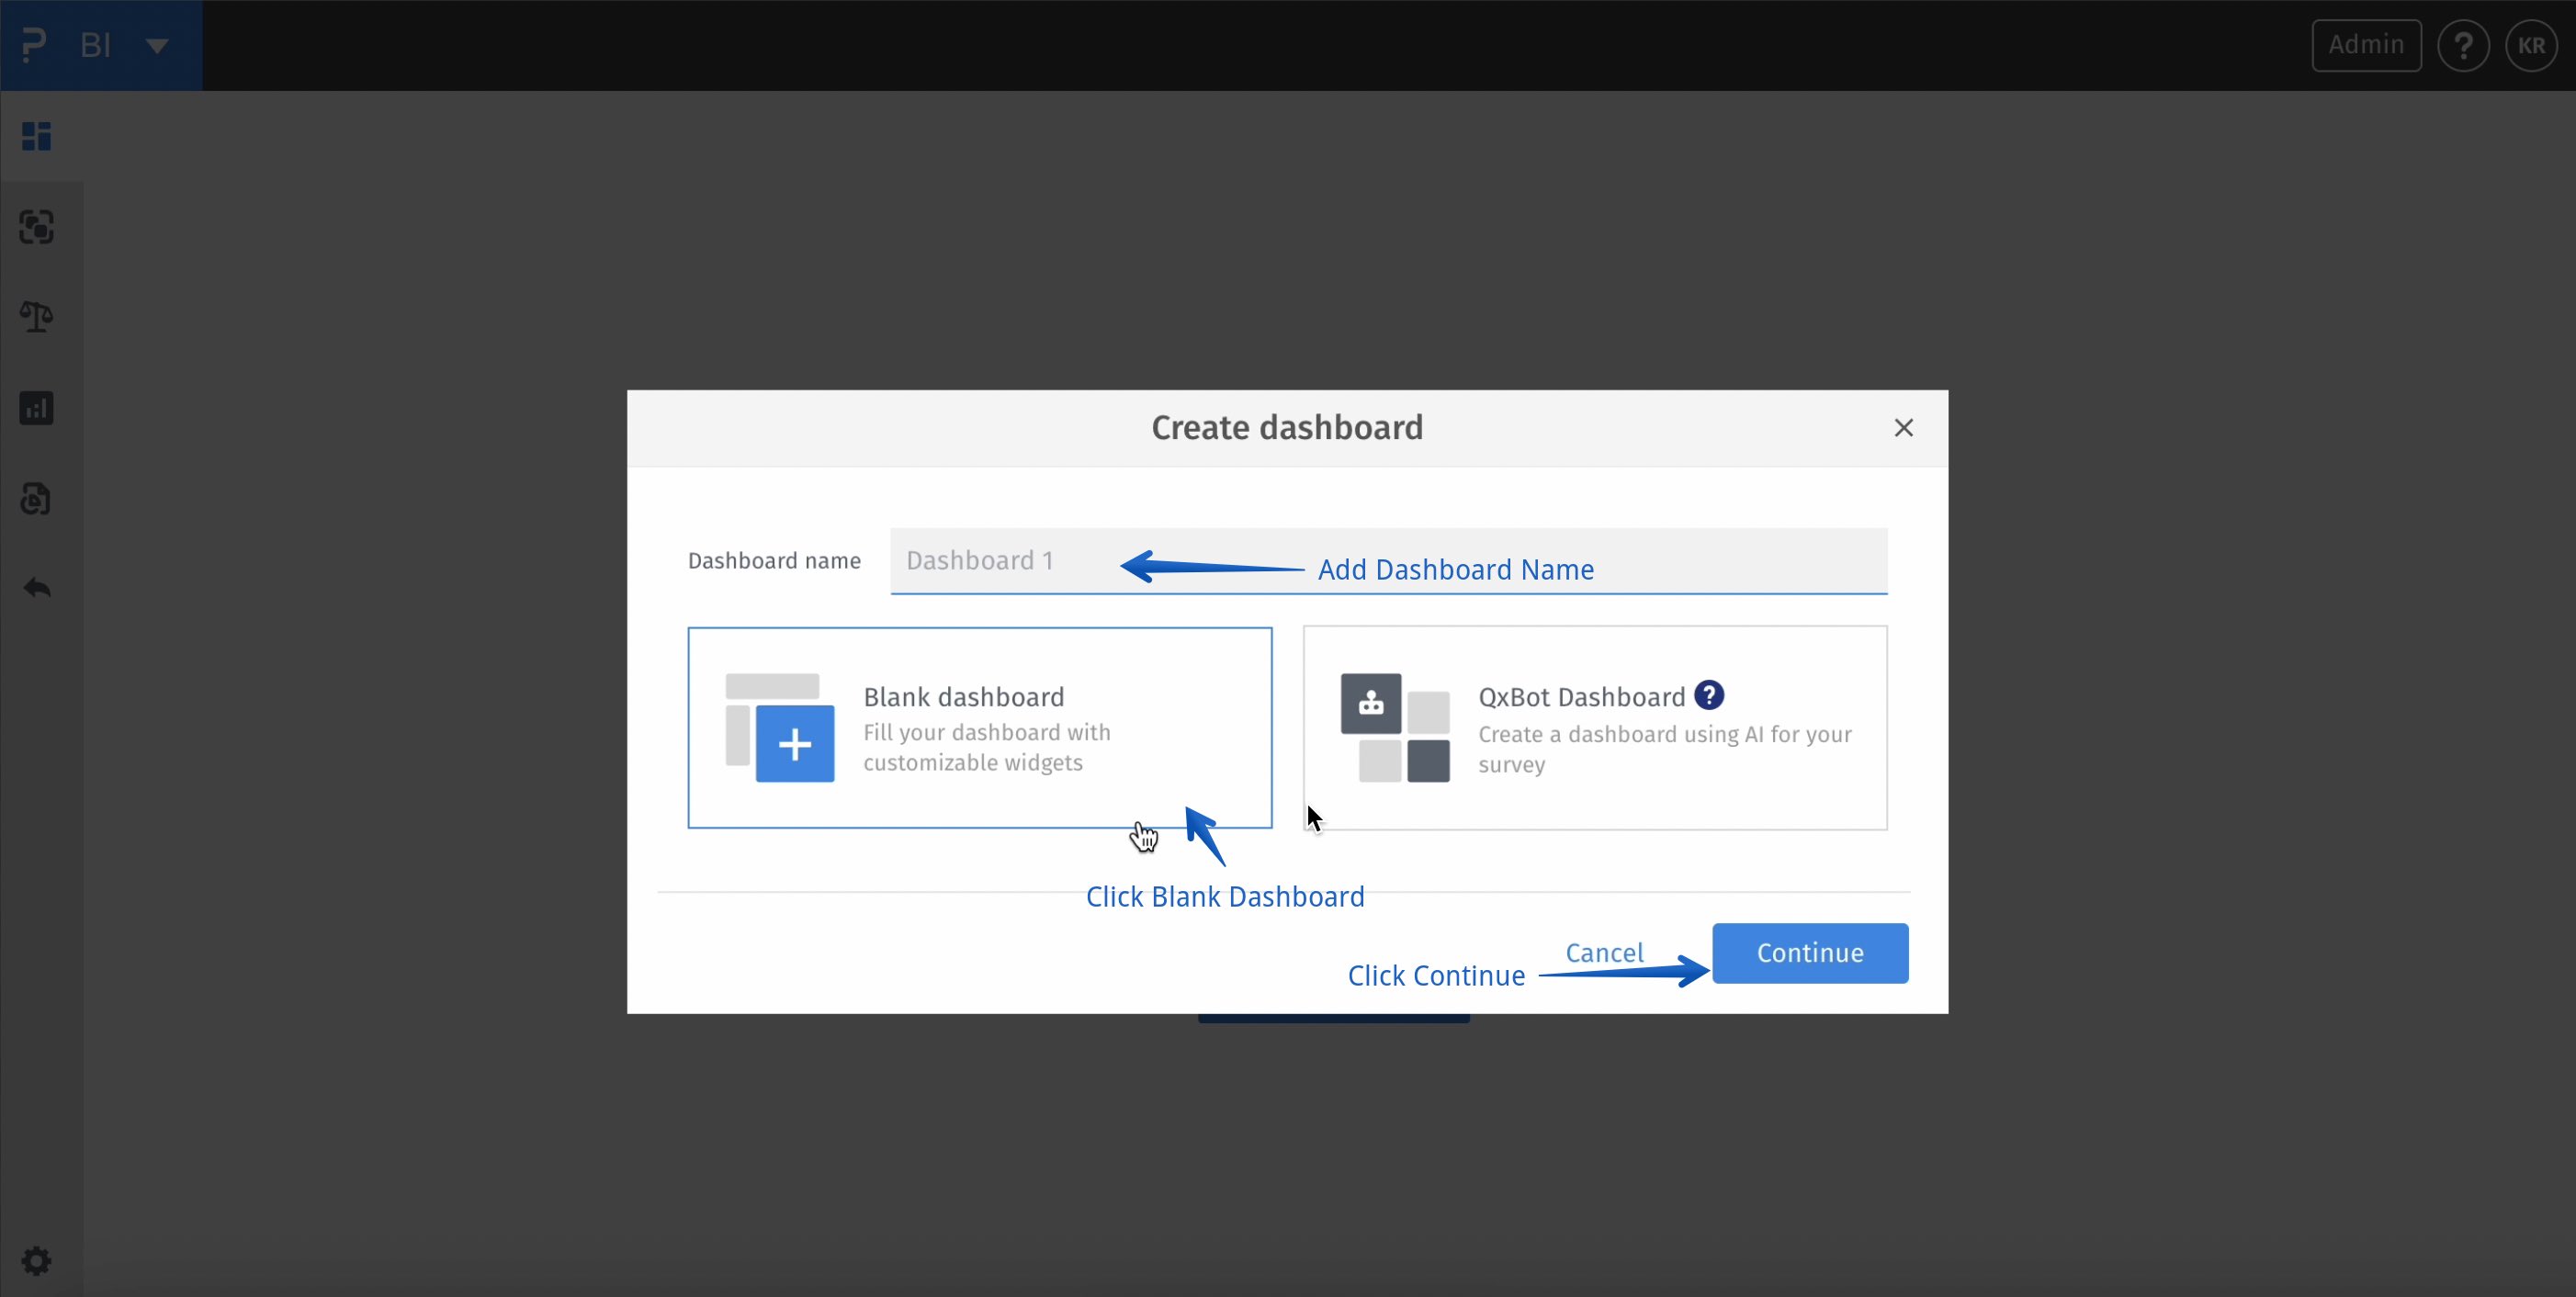
BI -> Create Dashboard -> Blank Dashboard -> Continue
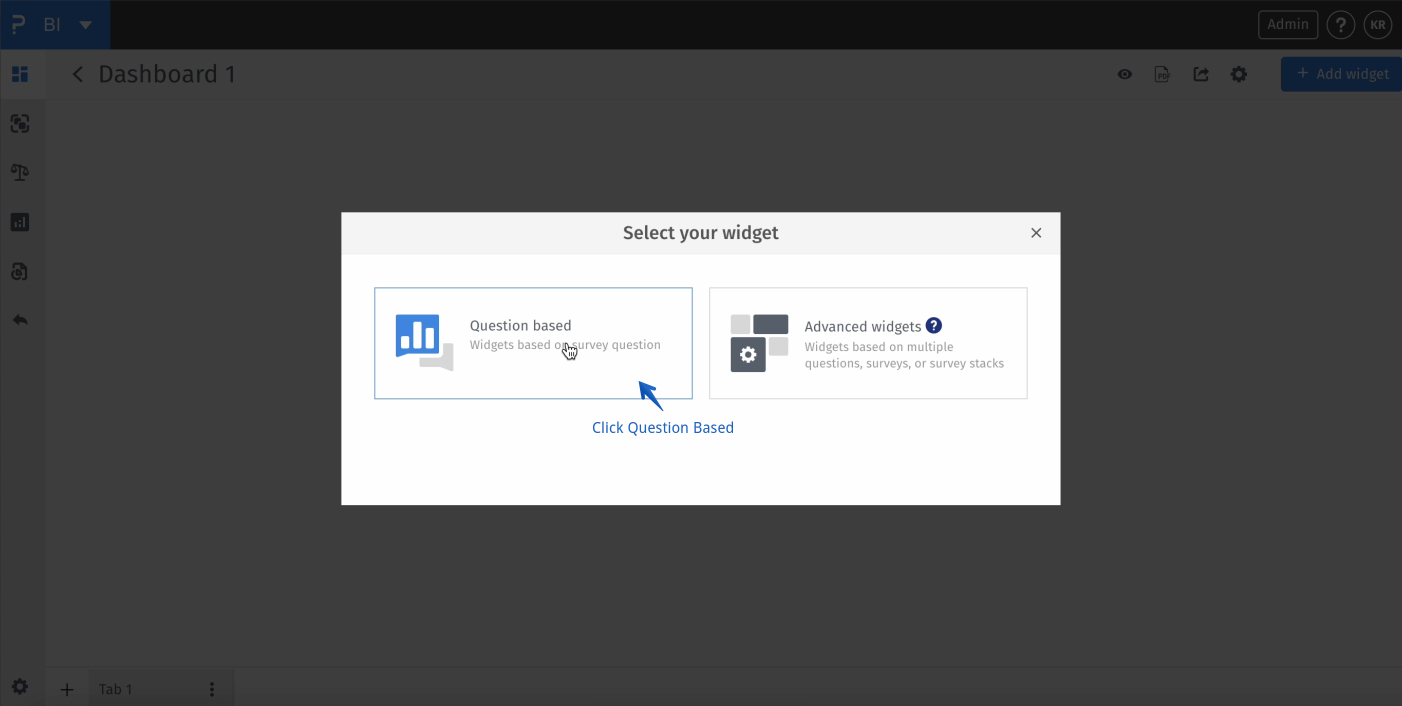
BI -> Create Dashboard -> Blank Dashboard -> Continue -> Question Based
BI -> Create Dashboard -> Blank Dashboard -> Continue -> Question Based -> Select Survey

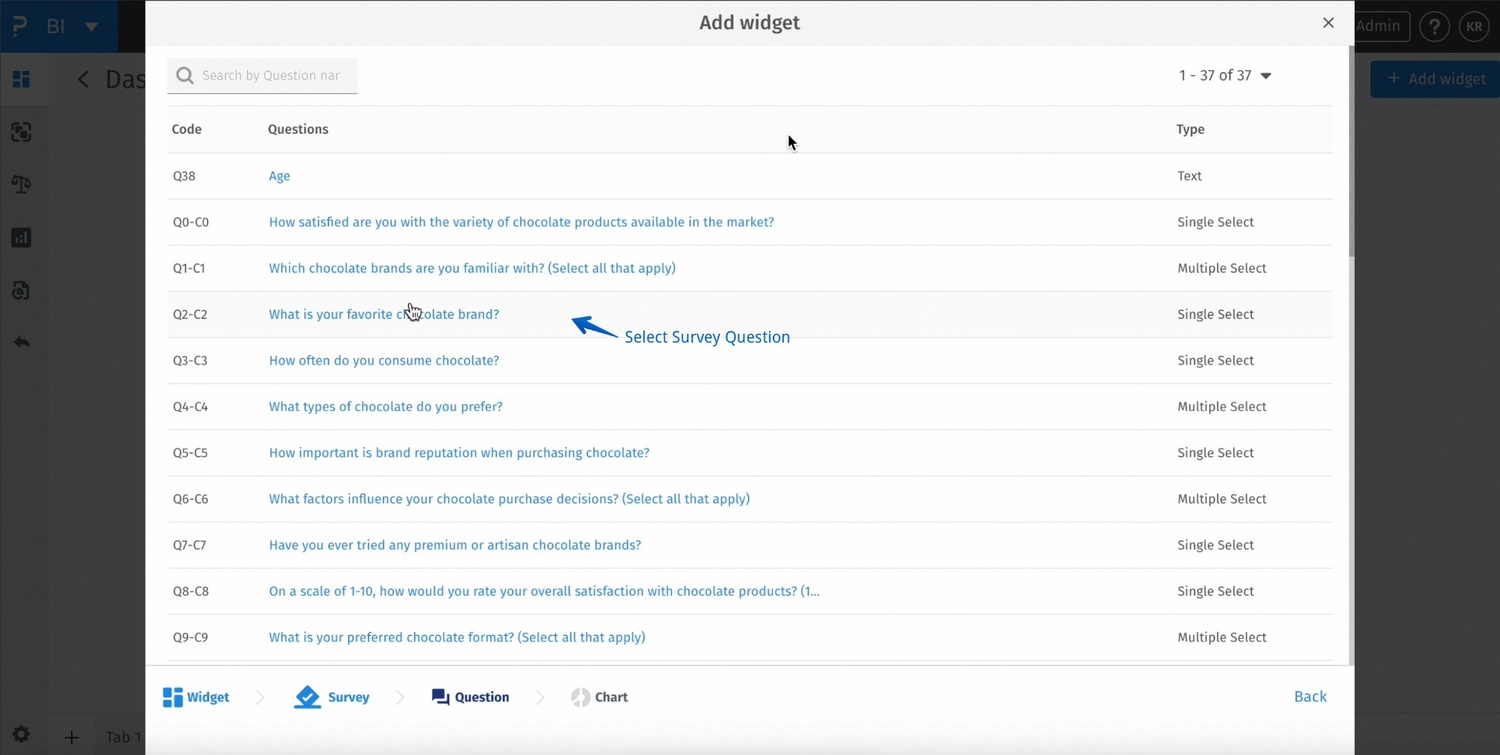
BI -> Create Dashboard -> Blank Dashboard -> Continue -> Question Based -> Select Survey -> Select Survey Question
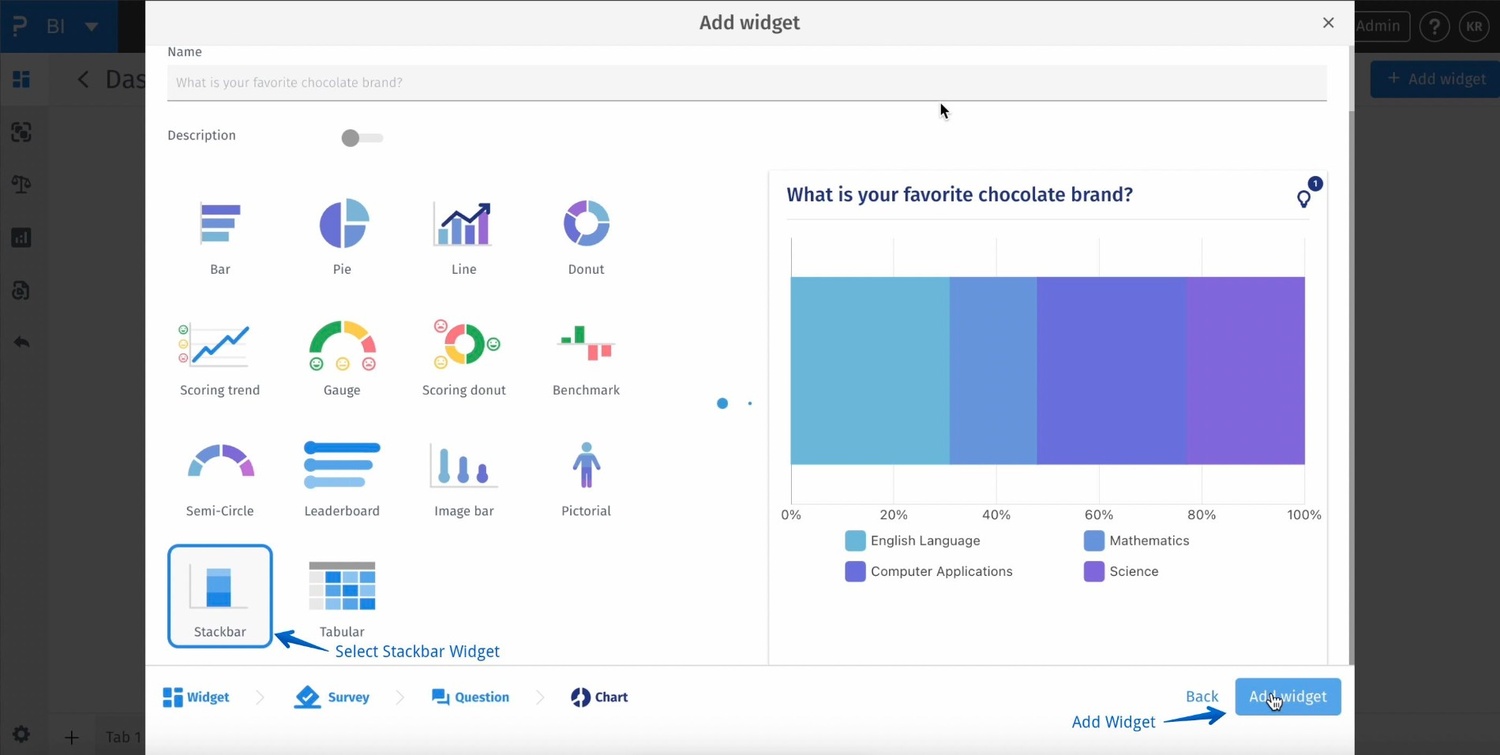
BI -> Create Dashboard -> Blank Dashboard -> Continue -> Question Based -> Select Survey -> Select Survey Question -> Stack Bar Widget
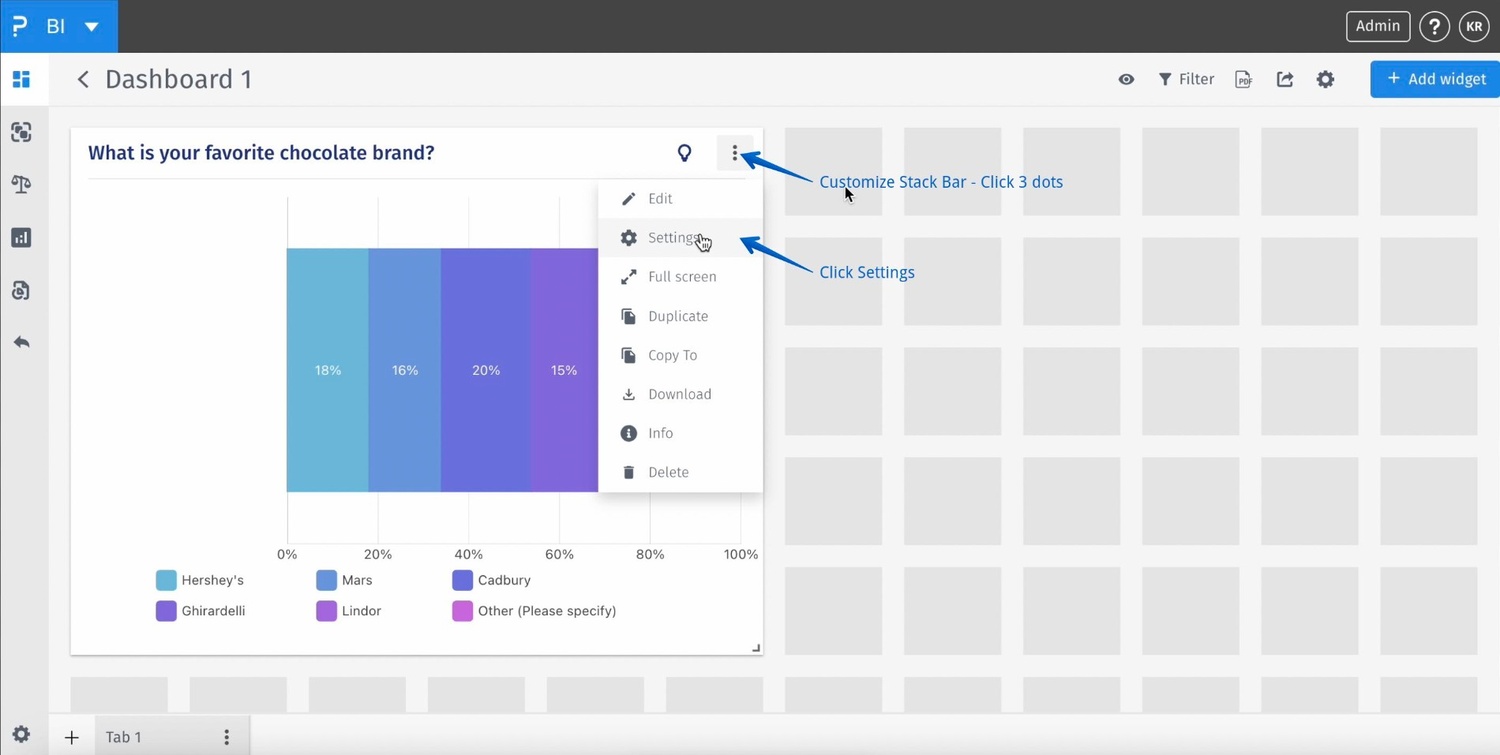
BI -> Stack Bar Widget -> 3 dots -> Settings
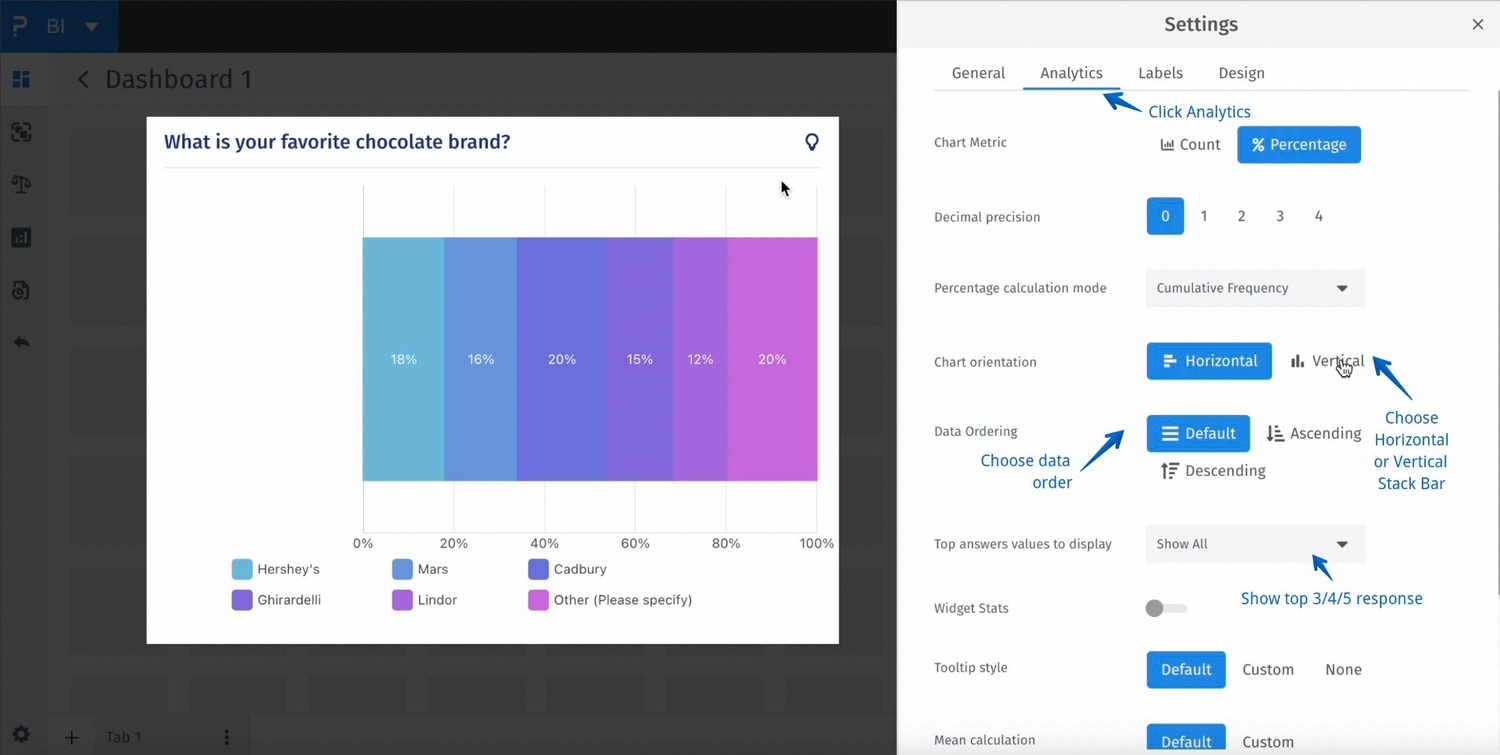
BI -> Stack Bar Widget -> 3 dots -> Settings -> Analytics -> Chart Orientation, Data Odering, Top Answer value to display
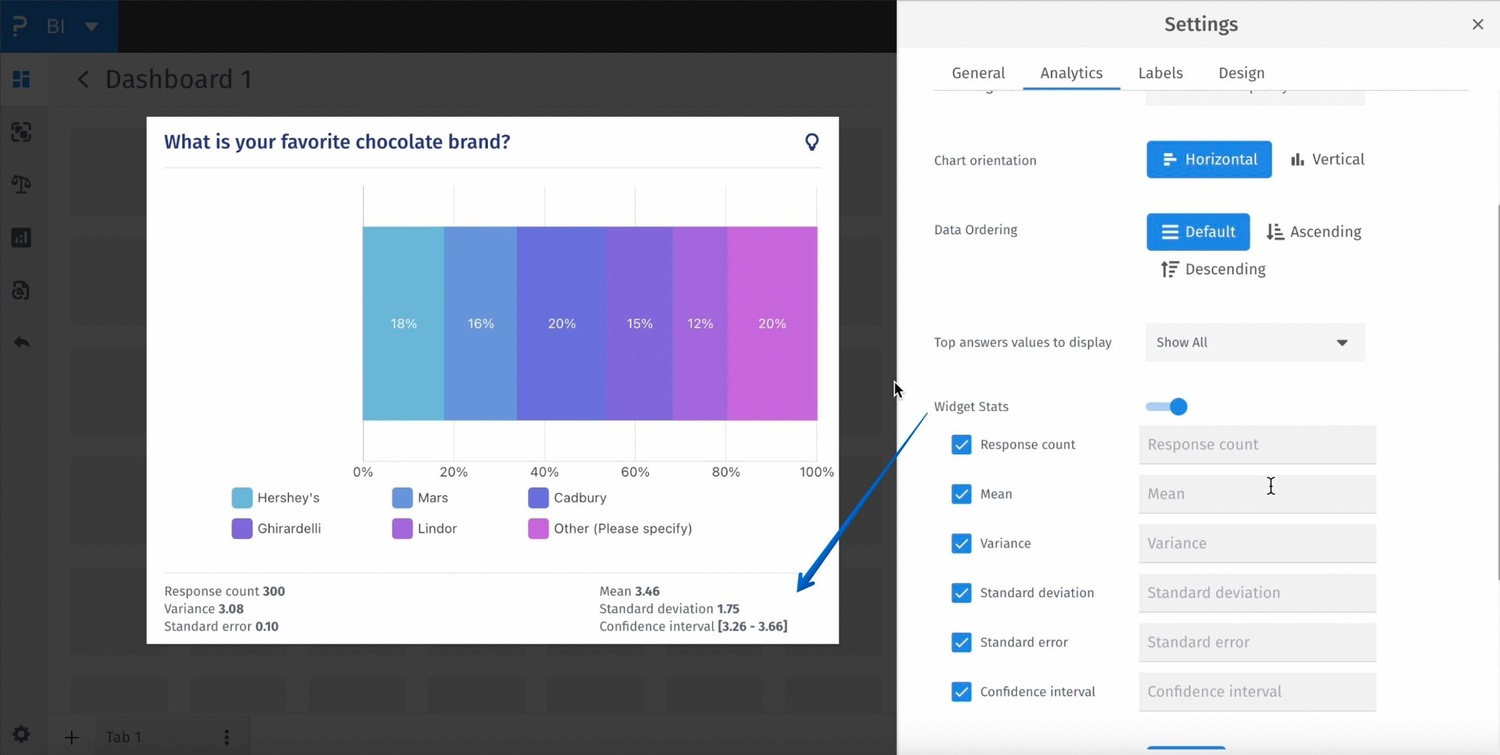
BI -> Stack Bar Widget -> 3 dots -> Settings -> Analytics -> Widget Stats
BI -> Stack Bar Widget
- Unichoice: A single-choice question or variable where users select only one response.
- Multichoice: A question or variable allowing multiple selections per respondent.
- Stack: Each segment of the bar representing a portion of the category data.
- Normalization: Adjusting values to a common scale, such as converting counts to percentages.