


Map
Map is a geographic visualization feature available on the BI dashboard. It enables users to see where survey responses were collected by displaying respondent count on a map by count and percentage.
This feature is especially useful when surveys are conducted across multiple locations or regions, as it provides a clear visual representation of participation density. You can focus on specific areas rather than viewing the entire world map—helpful when surveys are limited to particular countries, states, or regions.
By using the Map feature, you gain quick insights into where your respondents are located, how many participated in each area, and the relative contribution of each region to the overall sample.
-
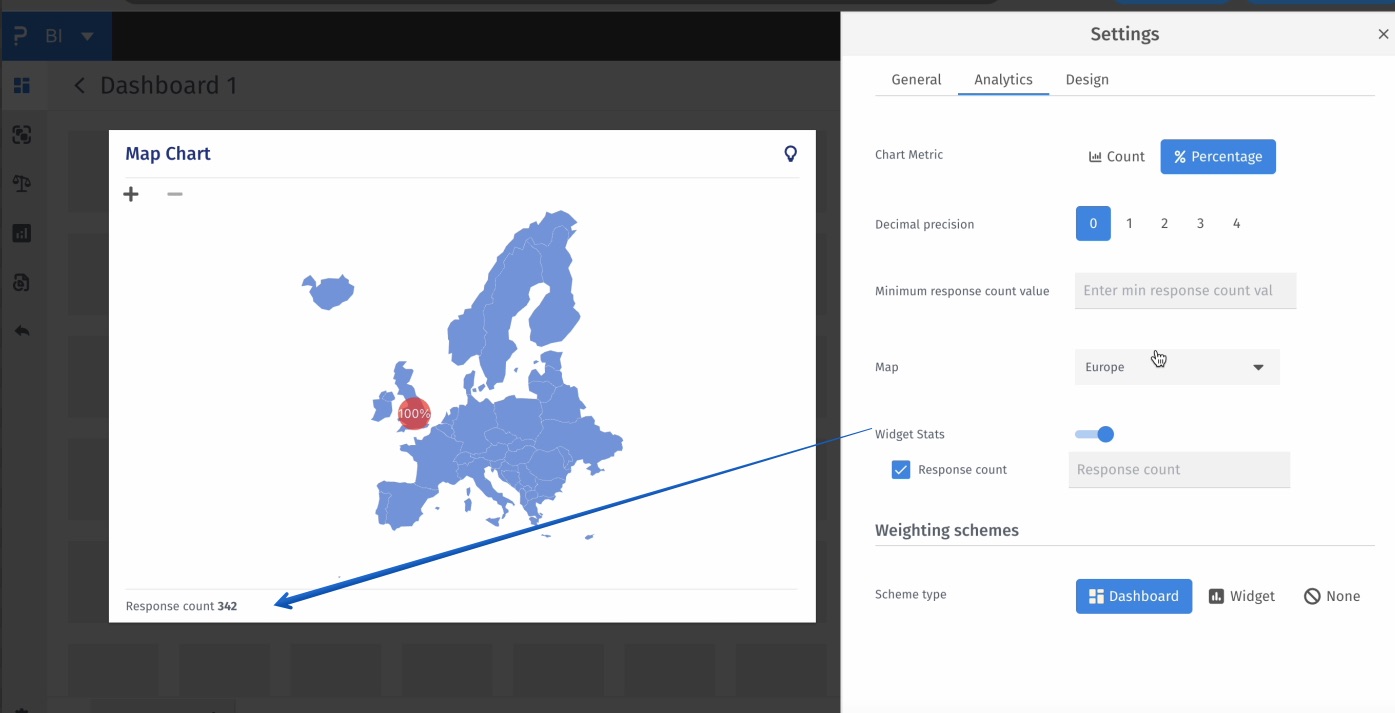
Geographic Breakdown by Count and Percentage
The map displays how many responses were collected from each region and what percentage they represent of the total sample. This is shown directly on the map through color intensity or tooltips. -
Region Selection
You can focus the map on specific regions instead of displaying a global view. This makes it easier to analyze results from localized surveys or remove noise from irrelevant geographies. -
Visual Insight
The map provides an immediate and intuitive understanding of where your survey had the most or least traction, making it ideal for stakeholder presentations or internal tracking.
Coming Soon
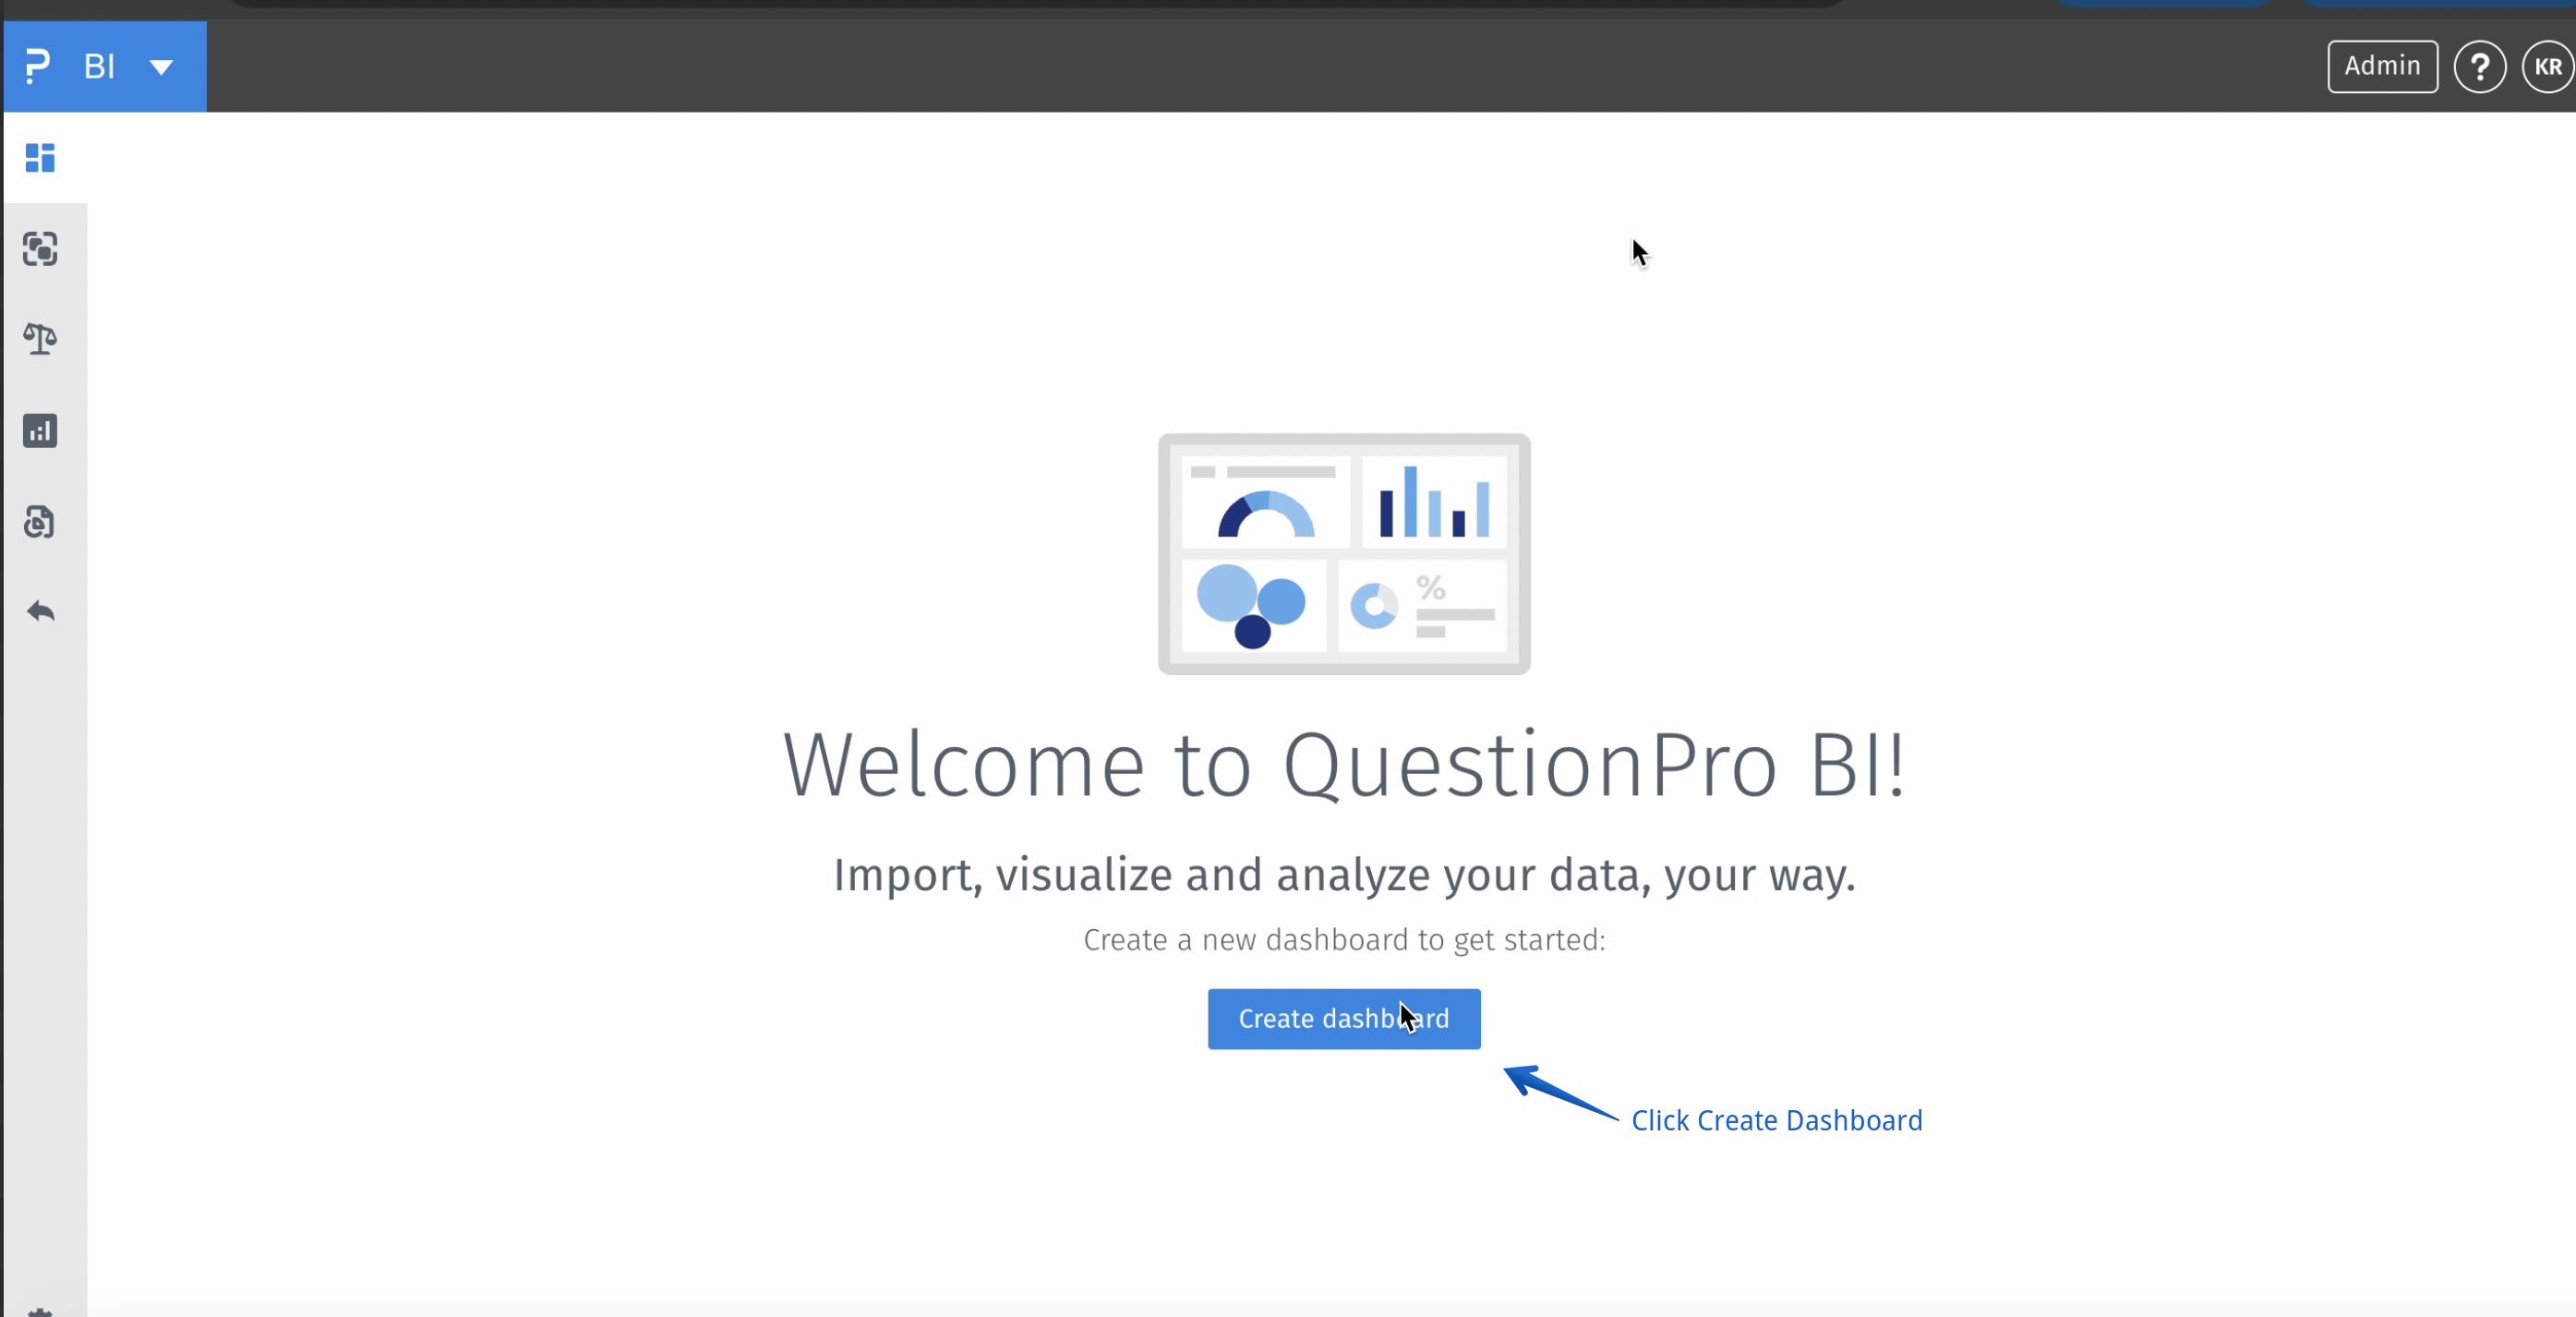
BI -> Create Dashboard
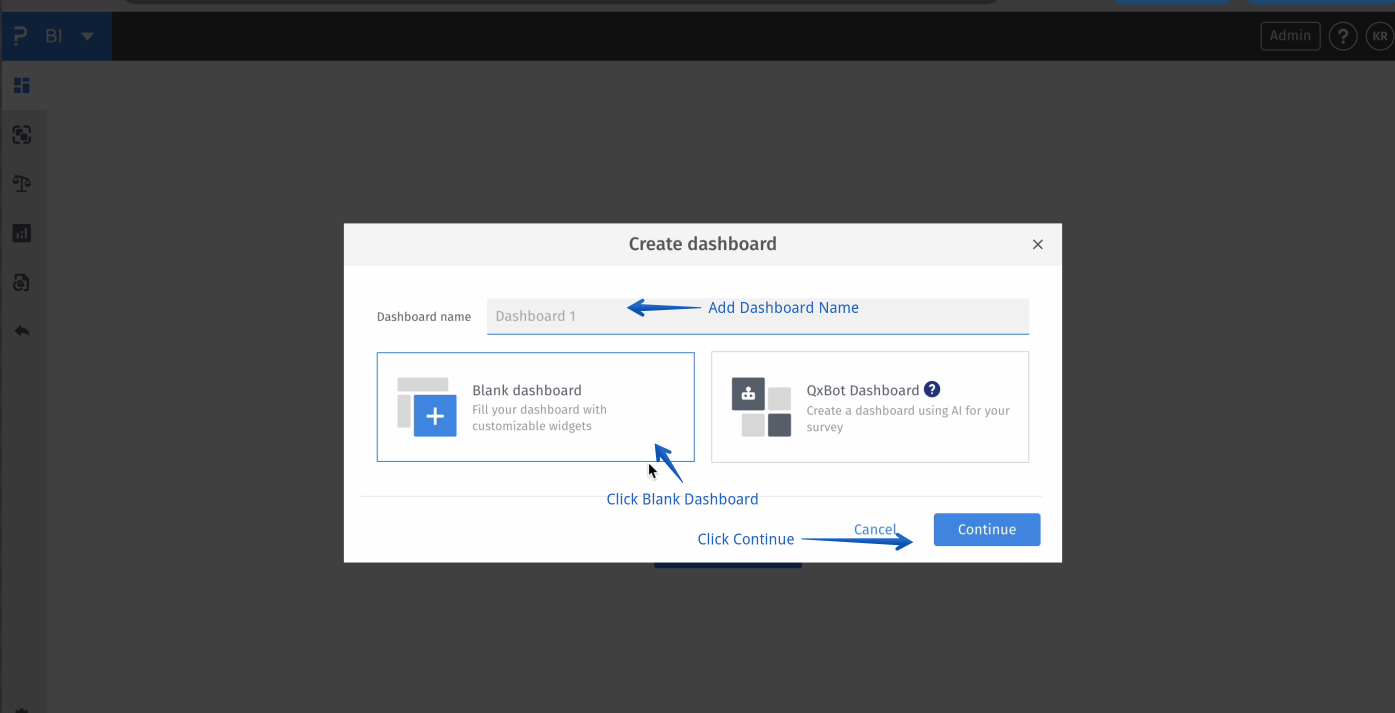
BI -> Create Dashboard -> Blank Dashboard -> Continue
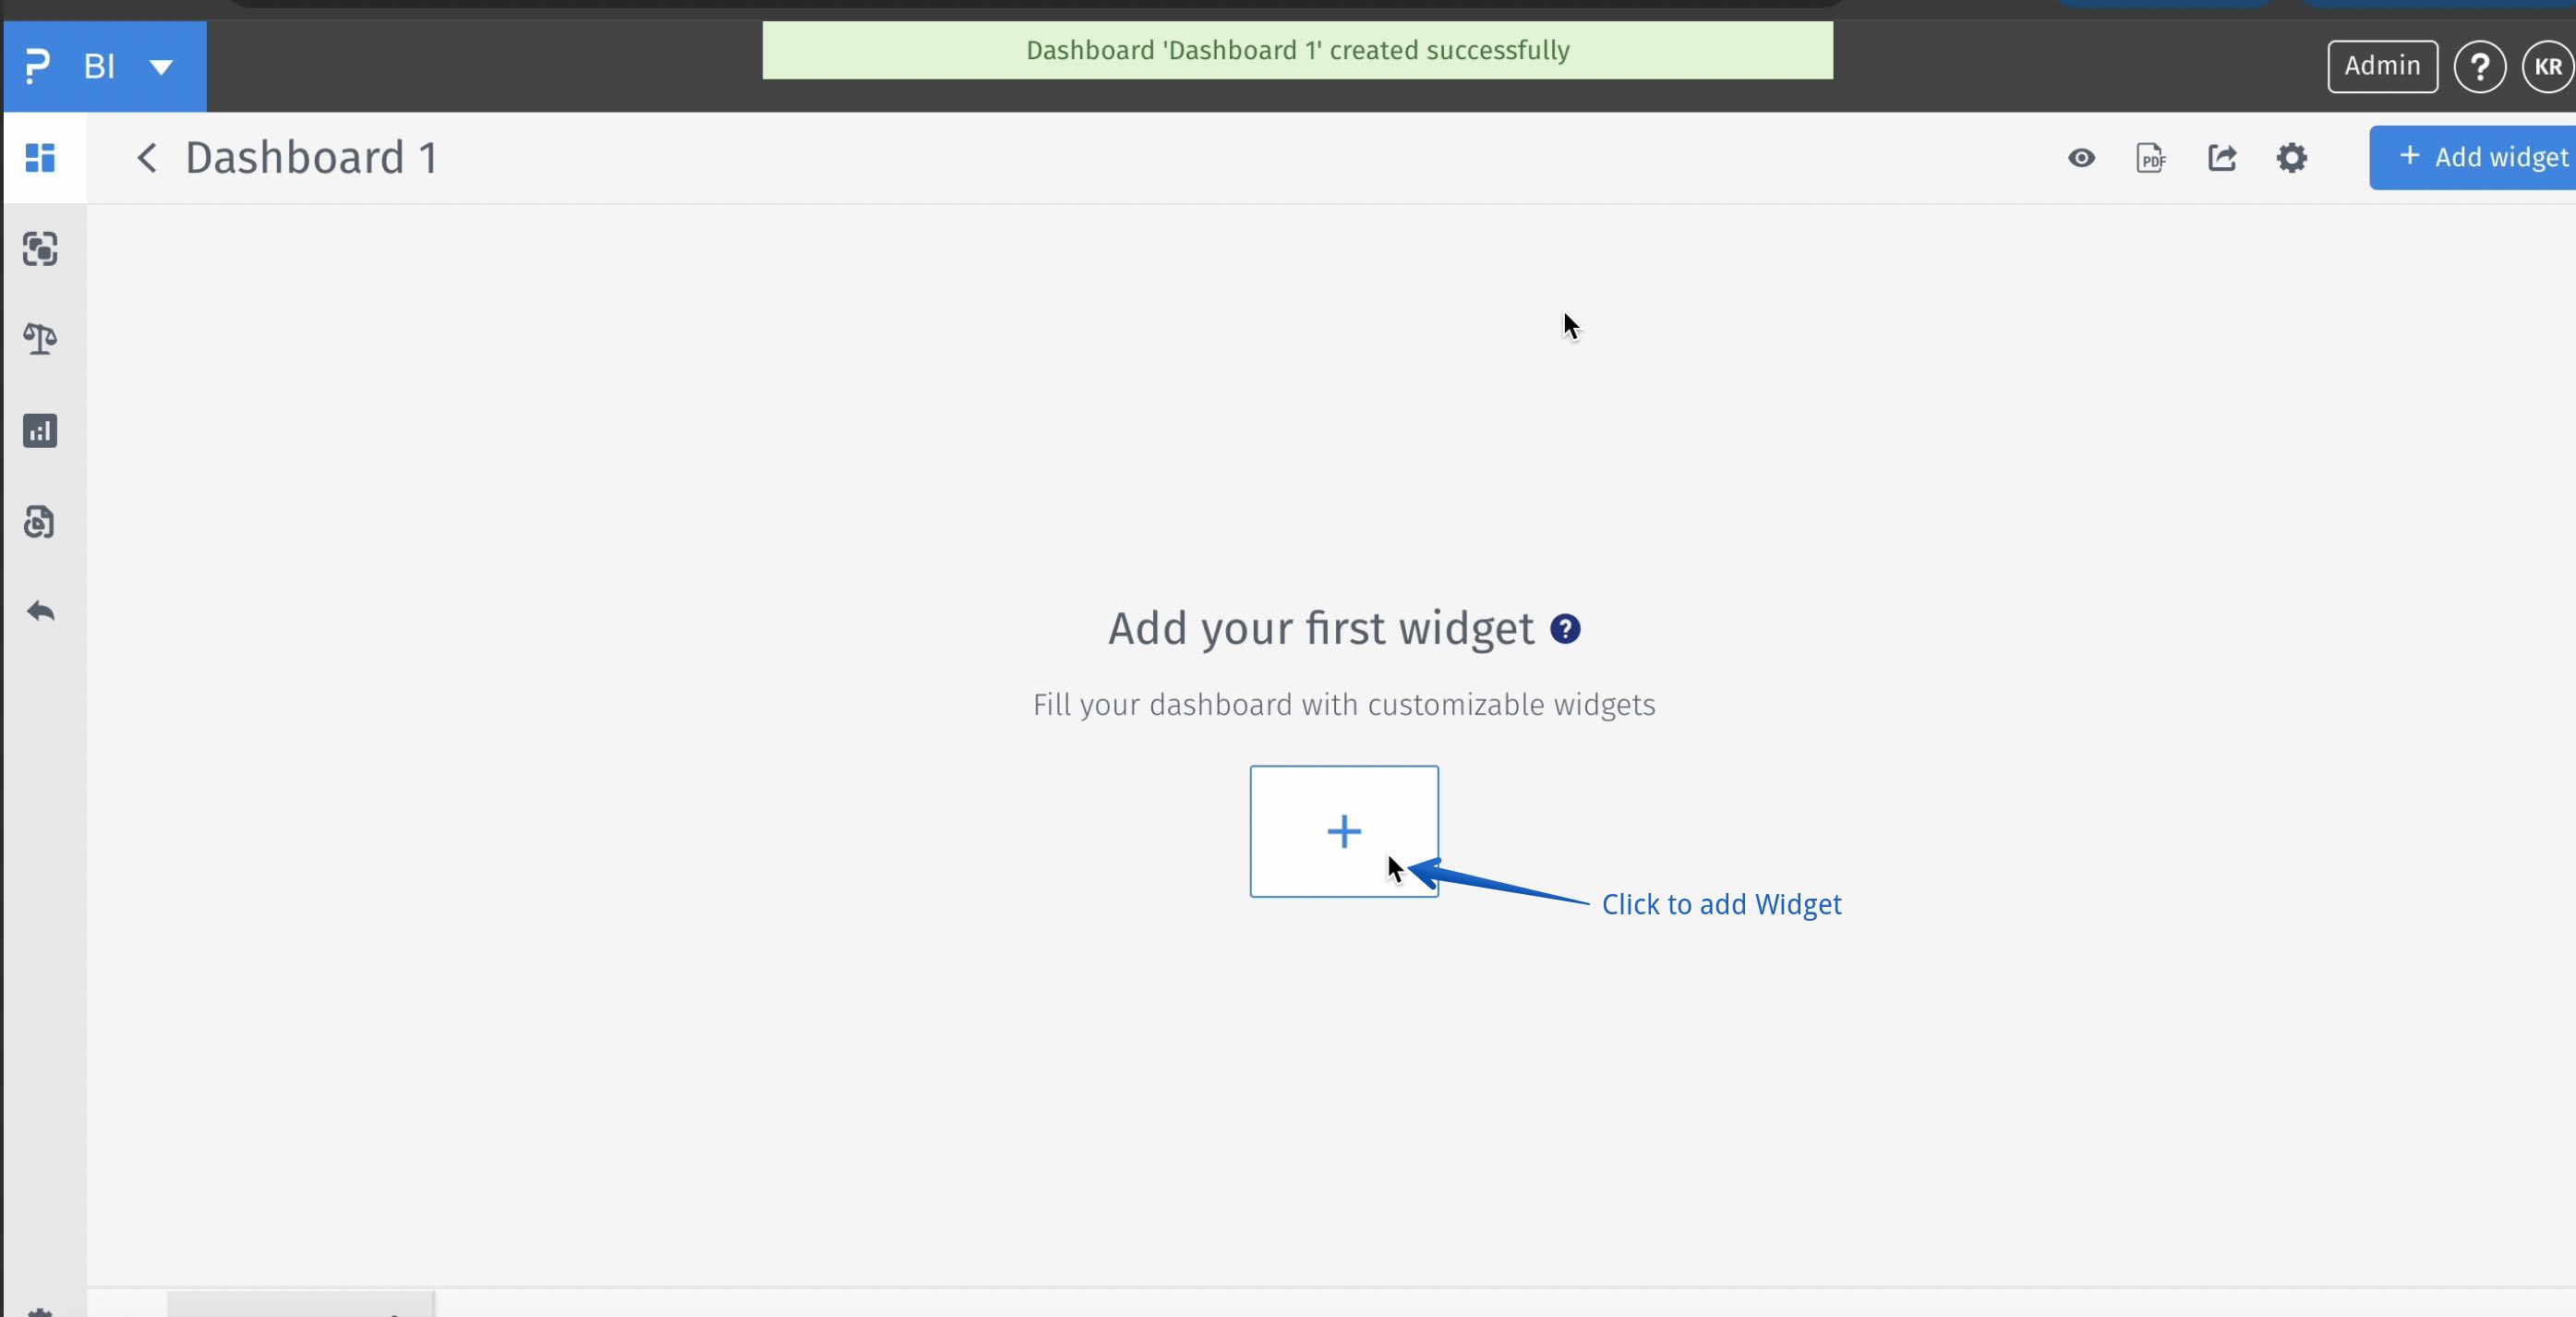
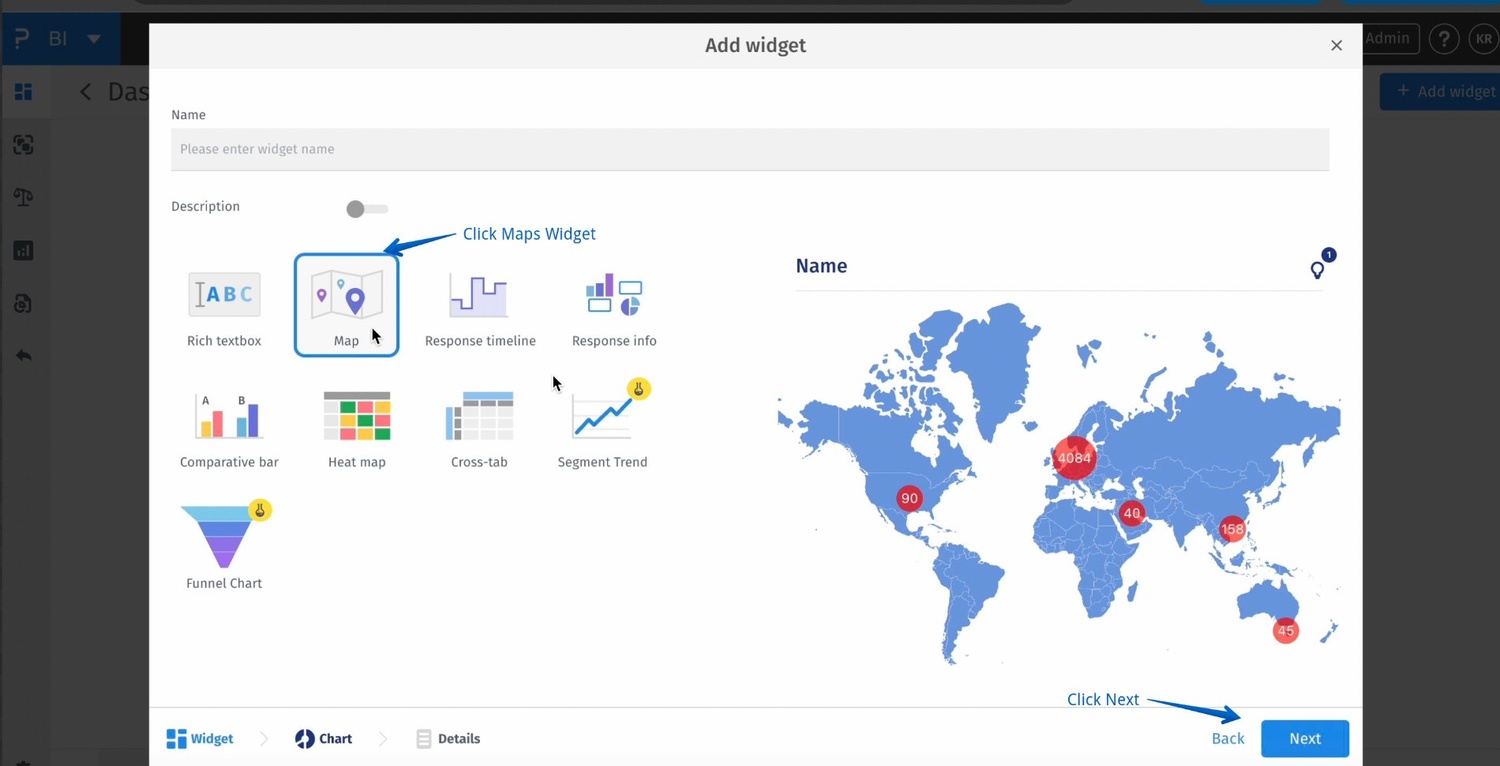
BI -> Create Dashboard -> Blank Dashboard -> Continue -> Add Widget
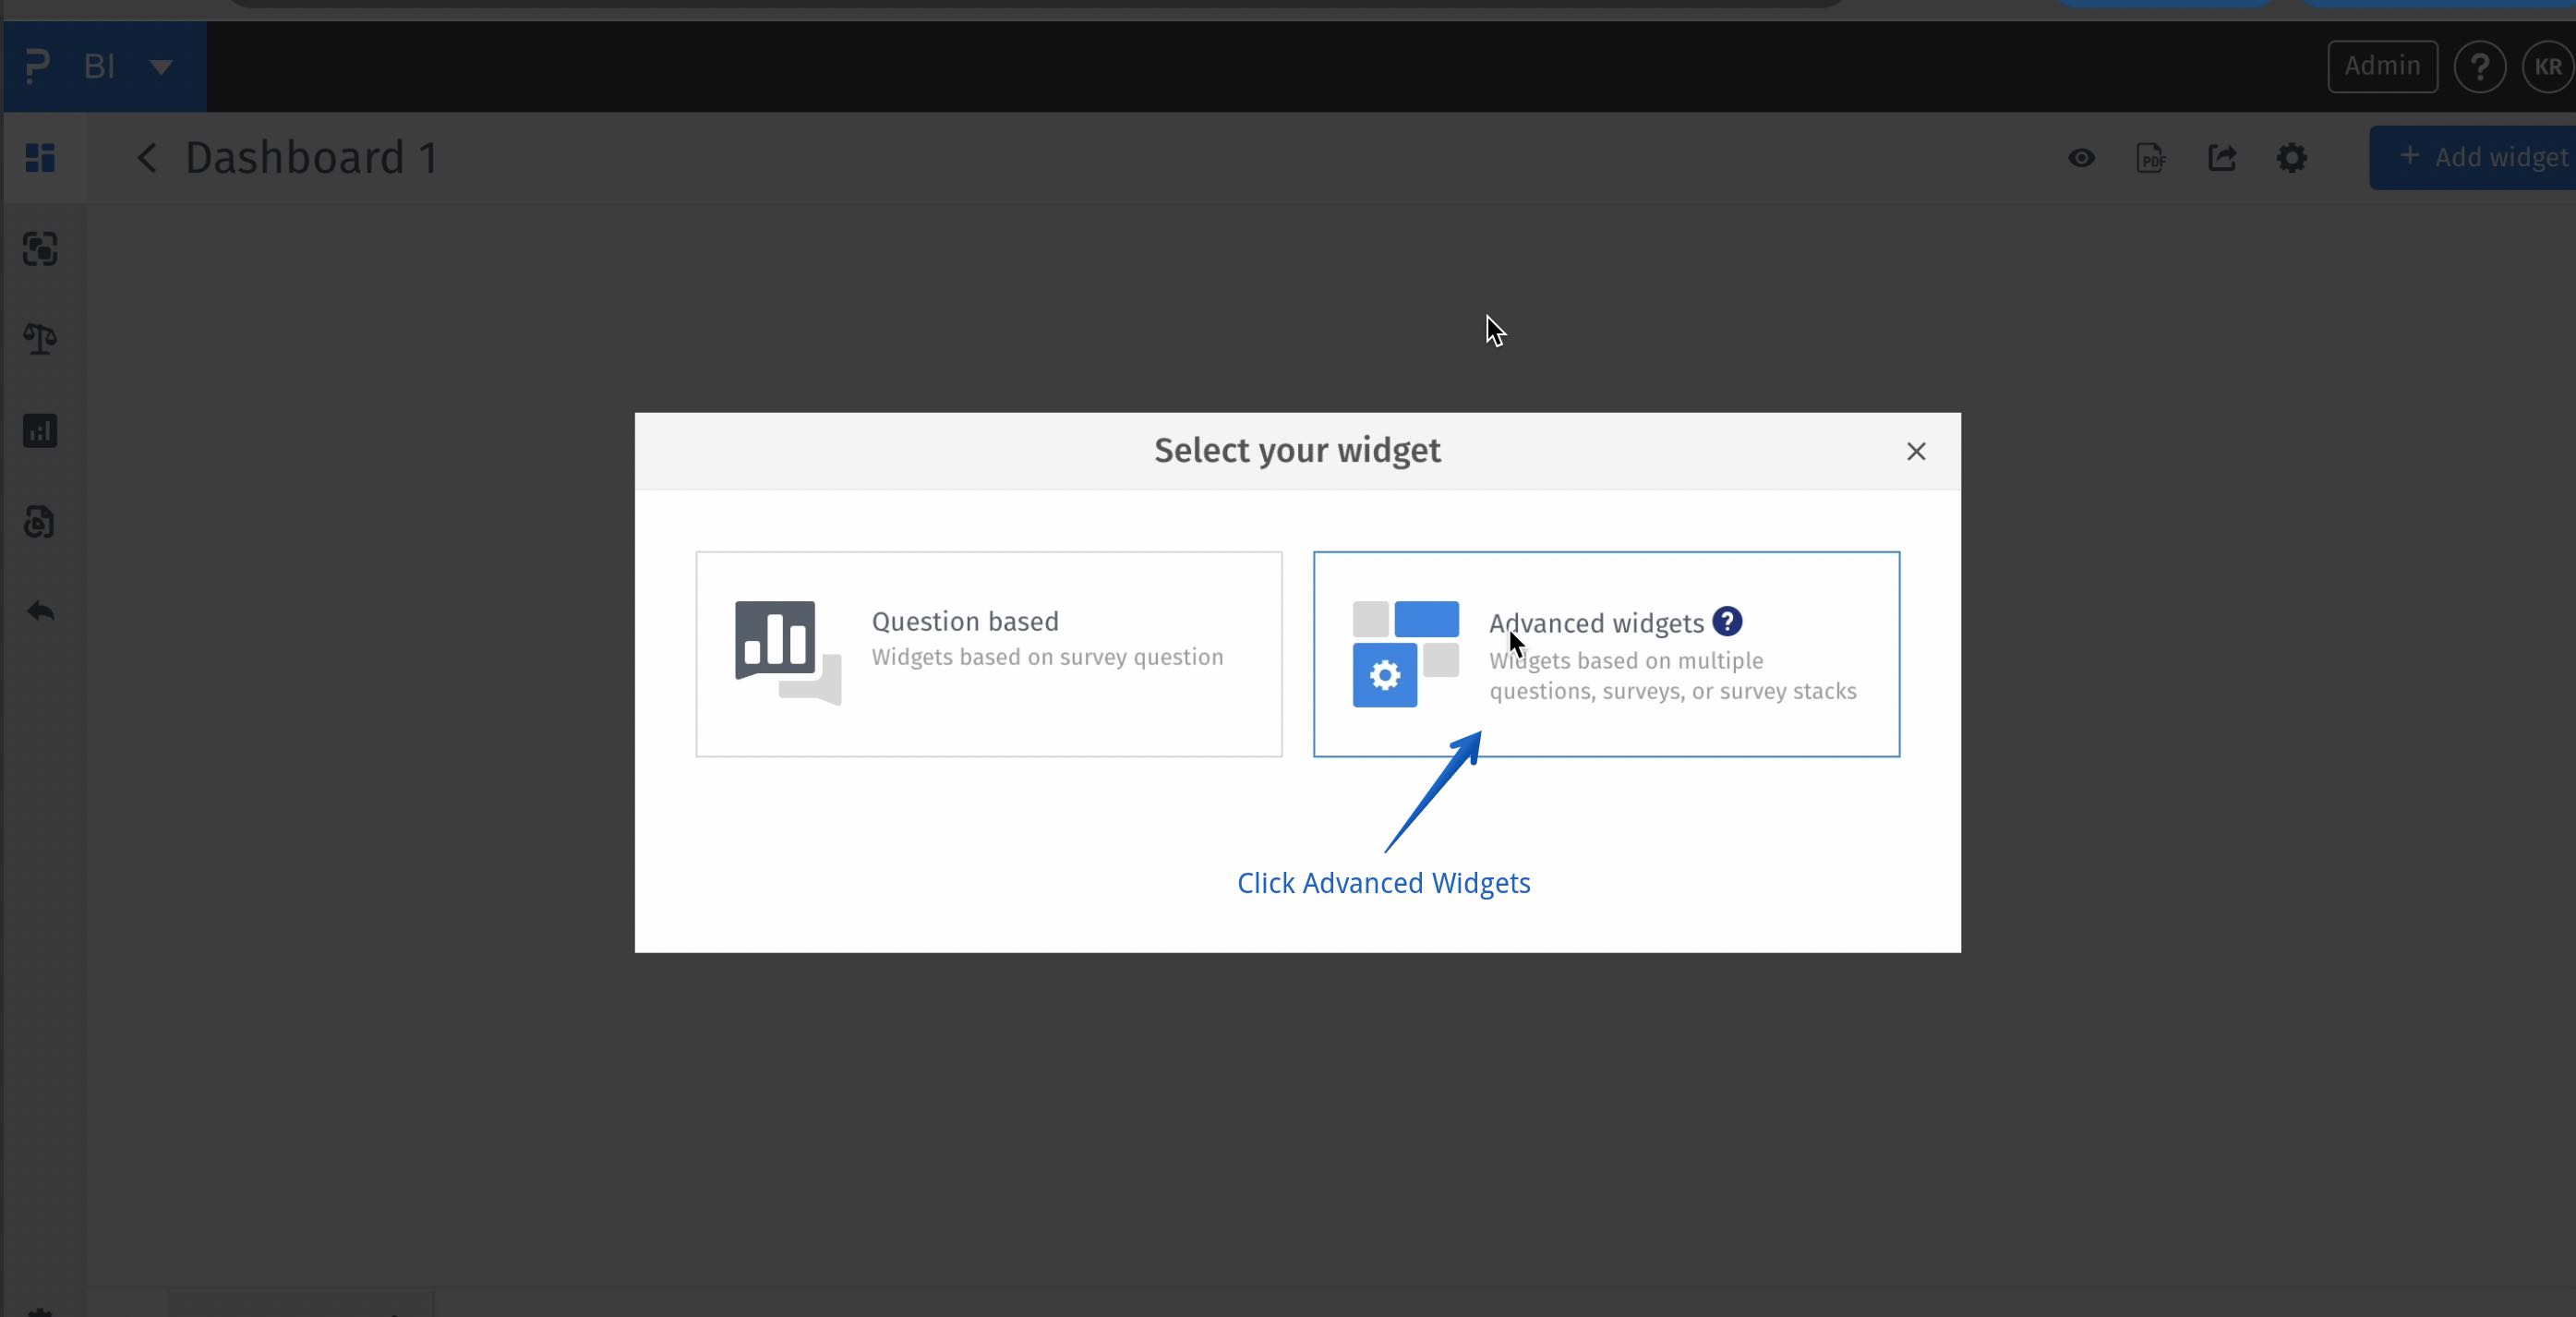
BI -> Create Dashboard -> Blank Dashboard -> Continue -> Add Widget -> Advanced Widget
BI -> Create Dashboard -> Blank Dashboard -> Continue -> Add Widget -> Advanced Widget -> Map Widget -> Next
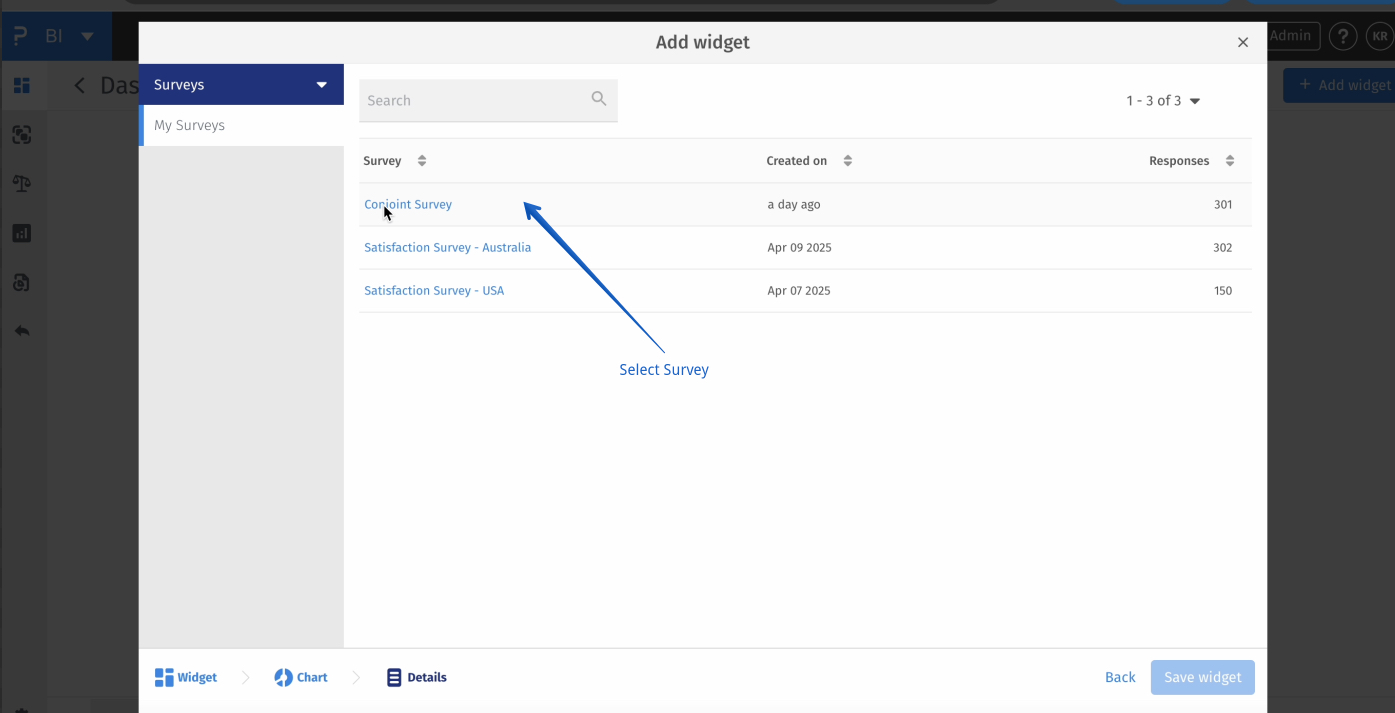
BI -> Create Dashboard -> Blank Dashboard -> Continue -> Add Widget -> Advanced Widget -> Map Widget -> Next -> Select Survey
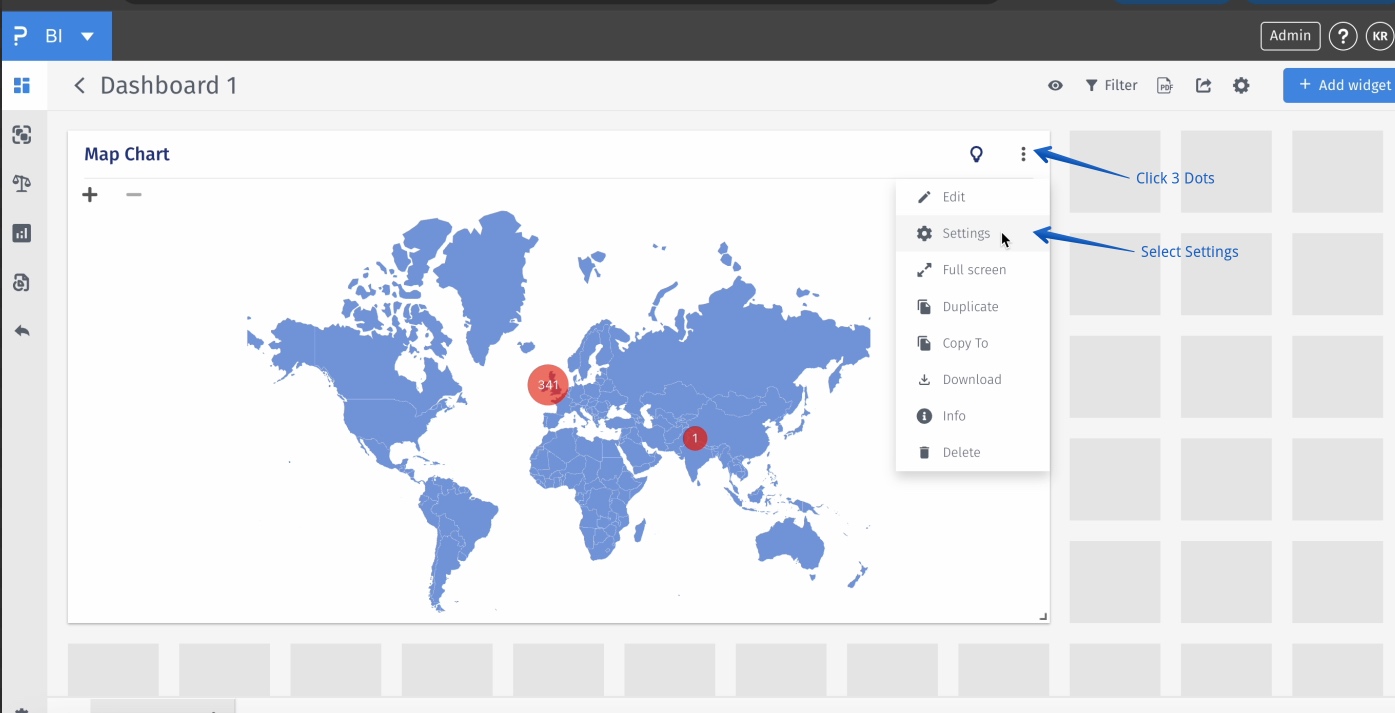
BI -> Map Widget -> 3 dots -> Settings
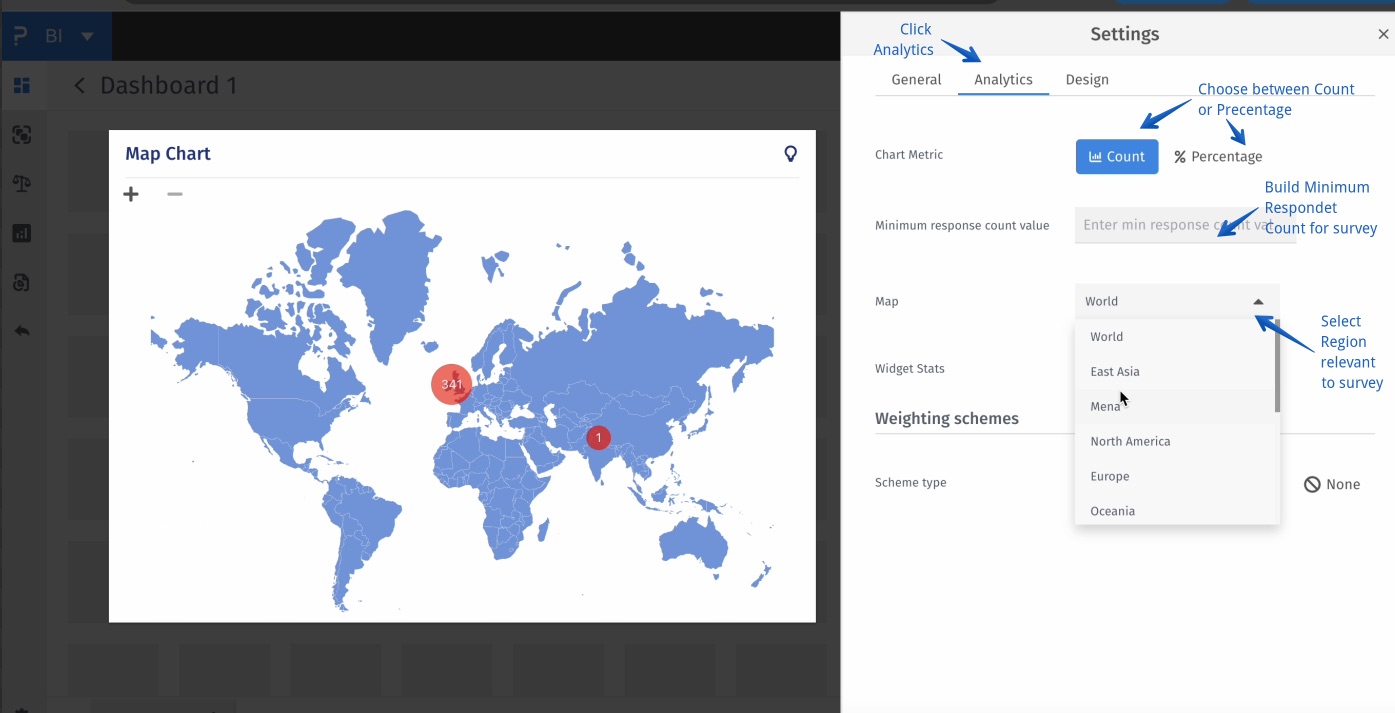
BI -> Map Widget -> 3 dots -> Settings -> Analytics -> Map -> Select Region OR Minimum Response Count Value -> Minimum Response OR Chart Metric -> Count / Percentage
BI -> Map Widget -> 3 dots -> Settings -> Analytics -> Widget Stats -> Response Count
- Map: A visual component that shows geographic distribution of survey responses.
- Region Selection: The ability to narrow the view to specific countries, states, or areas for more focused analysis.
- Count: The total number of responses collected from a particular region.
- Percentage: The share of total responses represented by a specific region.
- Tooltip: A small pop-up box that appears when hovering over a map area, showing additional information.
- Geographic Visualisation: The graphical display of data on a map to show patterns across locations.