


Tabular
Tabular is a powerful tabulation feature available on the BI platform. It enables users to view summarized data from matrices in a clean, table-based format. Designed for simplicity and efficiency, Tabular presents only the overall value for each metric, making it an ideal choice for high-level summaries and executive reporting.
By focusing solely on the overall figures, Tabular ensures clarity, minimizes cognitive load, and facilitates quick data interpretation.
Tabular also analyzes data for different groups of respondents based on specific qualification criteria from your survey. The feature is designed to help you slice your data and compare how different segments of respondents answered key questions.
By segmenting your data—such as by age, region, or purchase behavior—you can see how each group’s responses compare to the overall sample. This helps you identify patterns, validate hypotheses, and generate deeper insights into respondent behavior.
-
Summary-Only Display
Tabular outputs provide a condensed version of your matrix by displaying only the overall value of each measure. It eliminates row and column breakdowns, which is useful when the focus is on total impact rather than segmented analysis. -
Simplified Visualization
Since Tabular is optimized for clarity, it avoids complex visual elements. The result is a minimalist and structured table that prioritizes data readability. -
Seamless Integration
Tabular can be easily applied to any matrix object within the BI platform. Users can toggle between visual and tabular formats depending on the reporting need.
Coming Soon
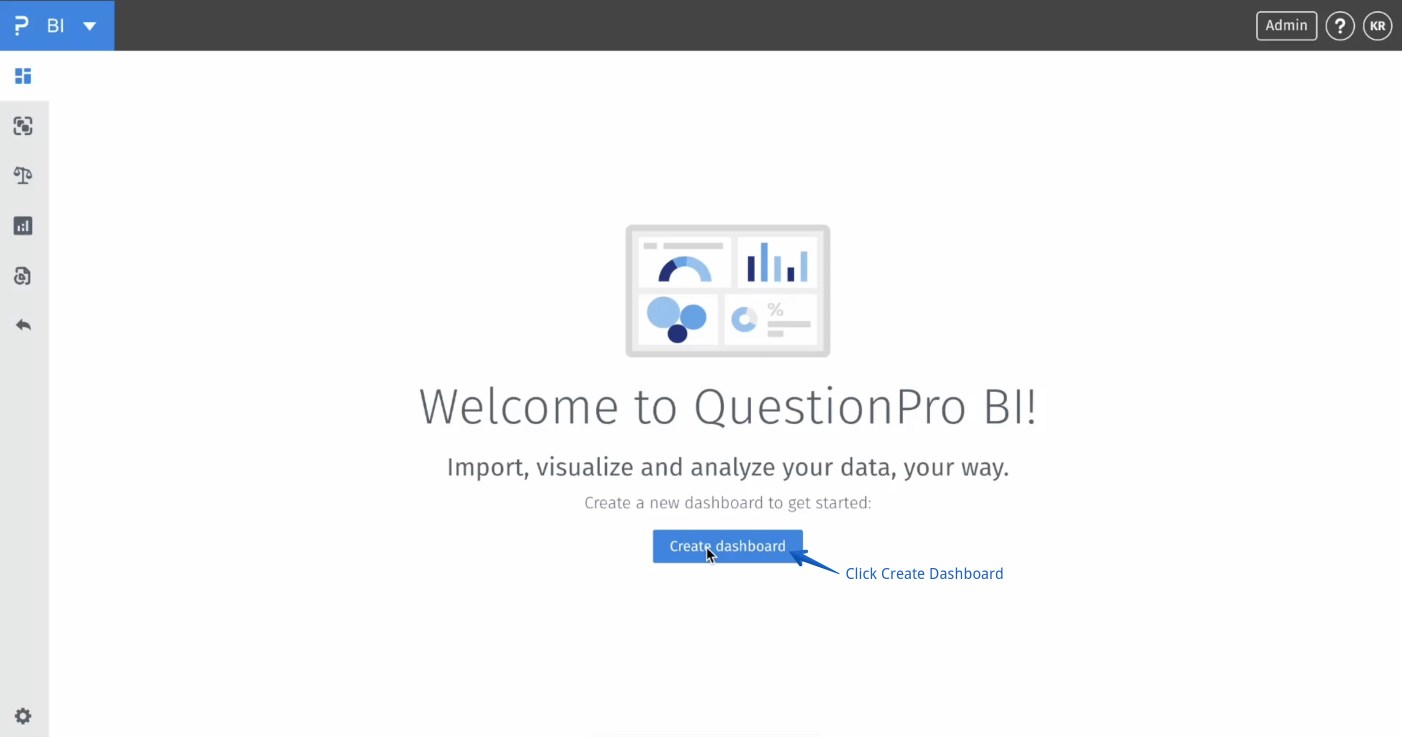
BI -> Create dashboard
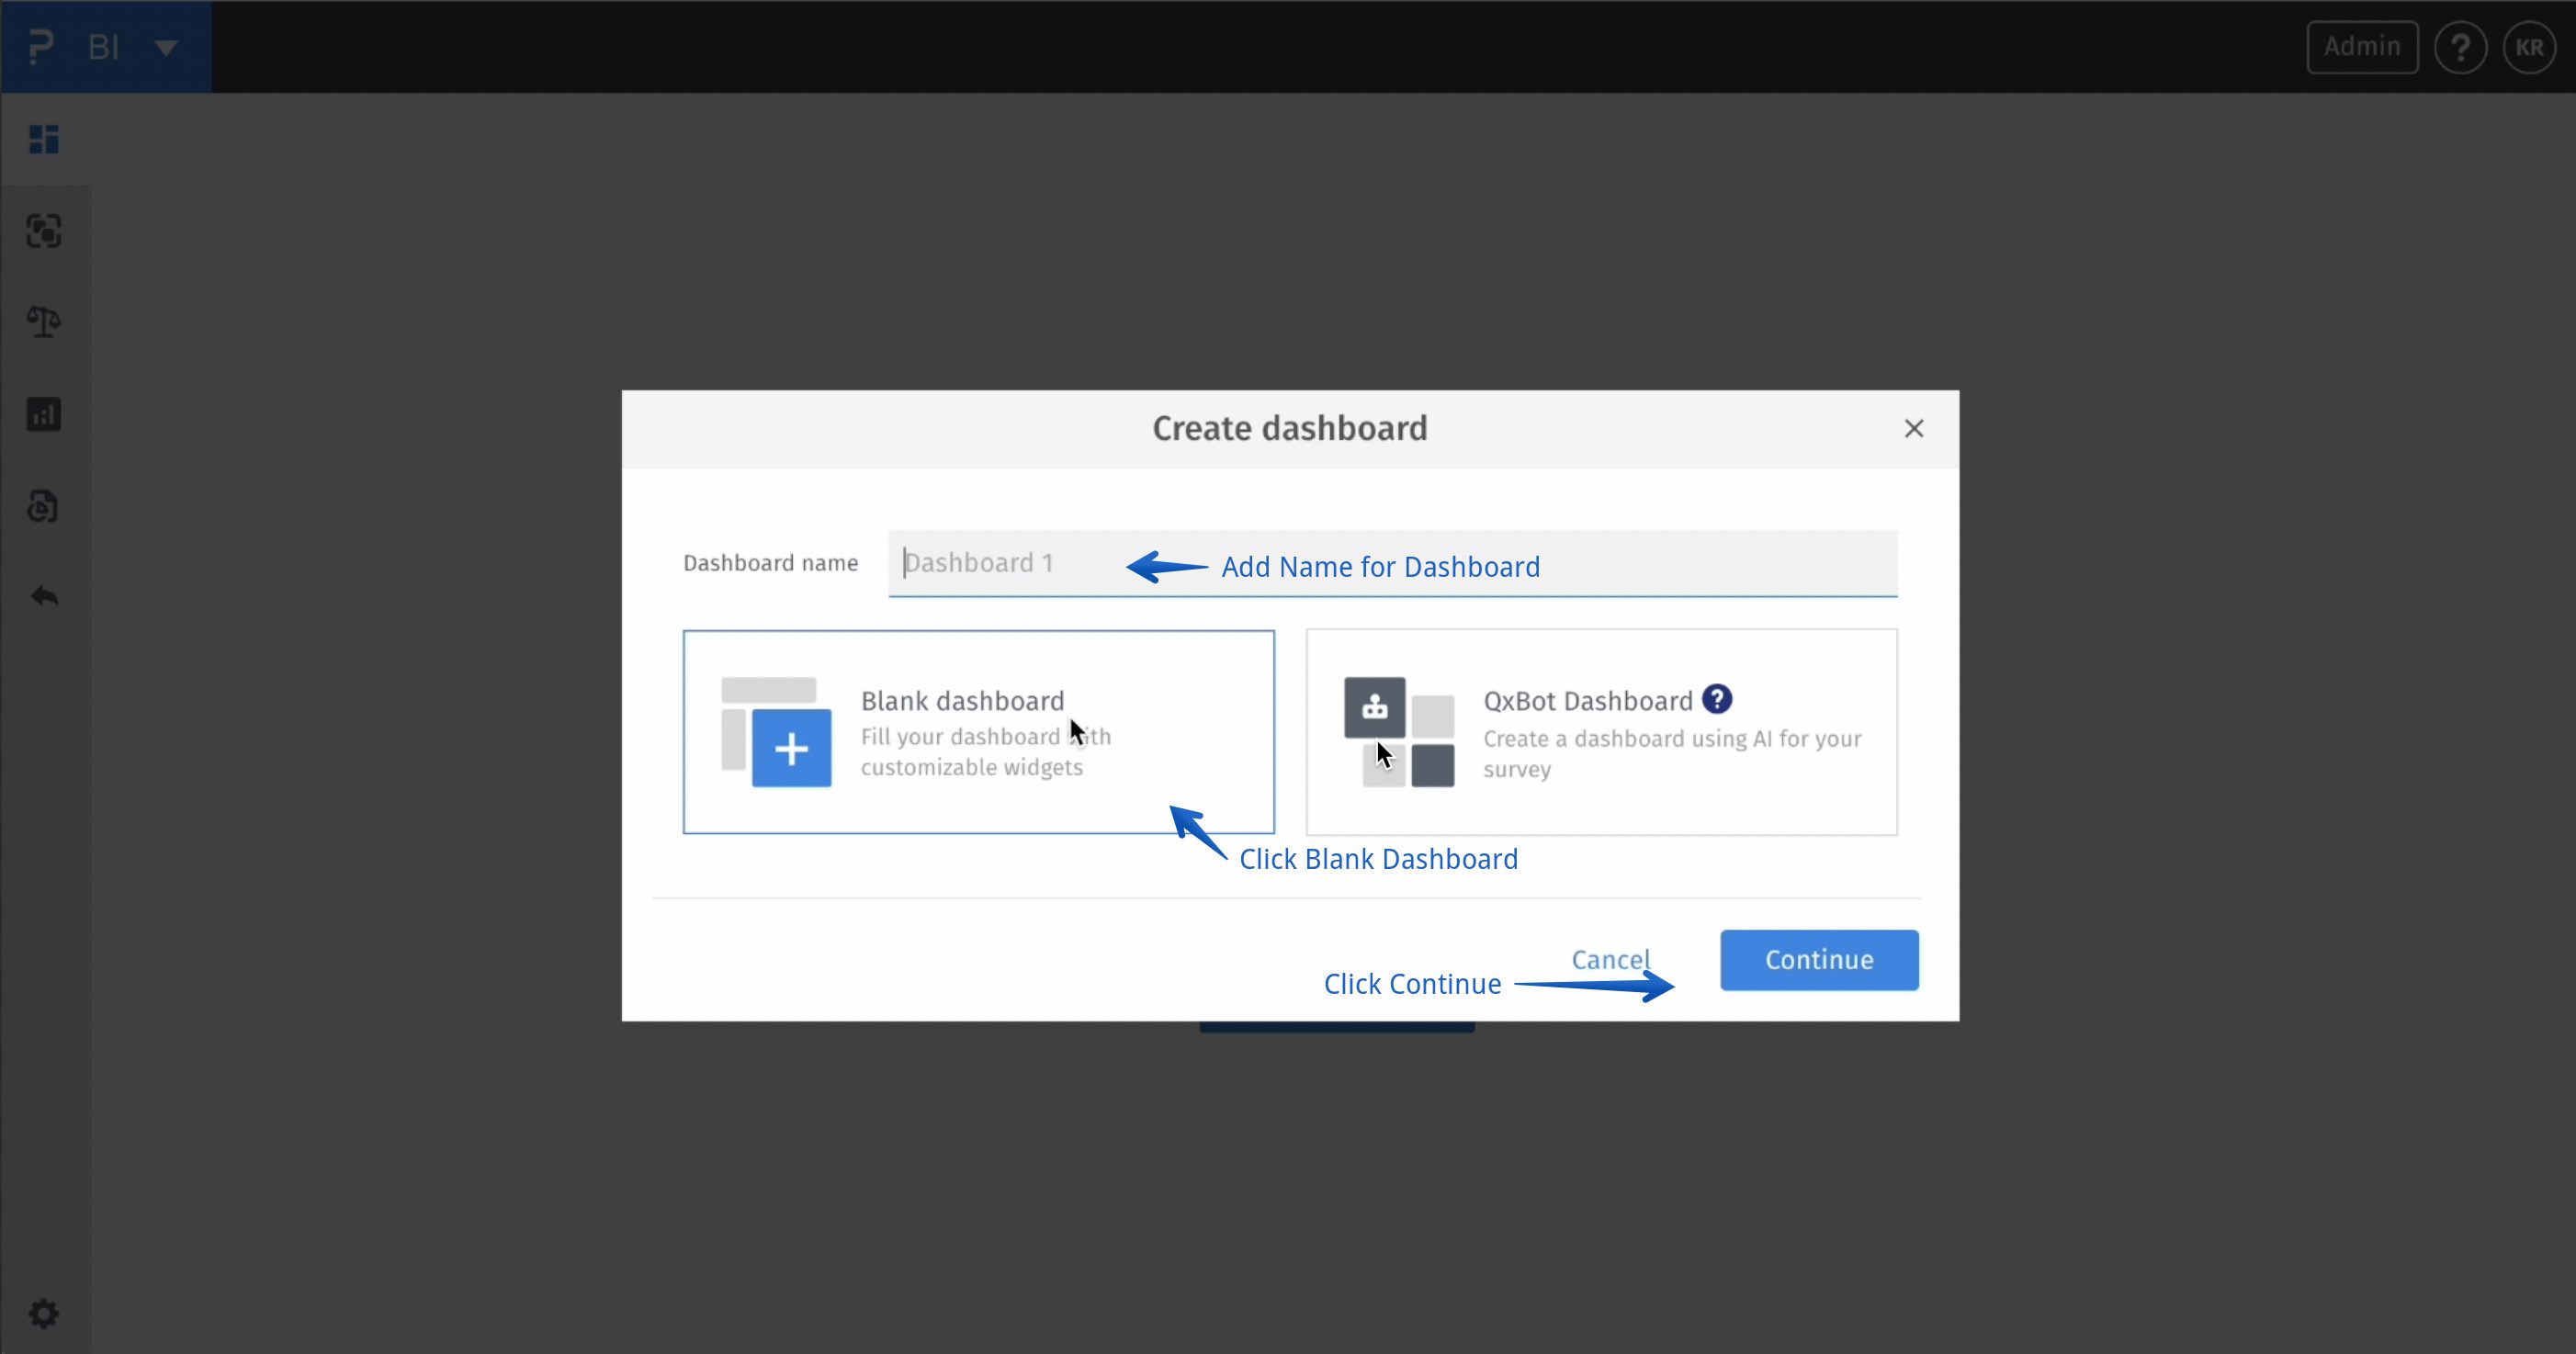
BI -> Create dashboard -> Blank Dashboard
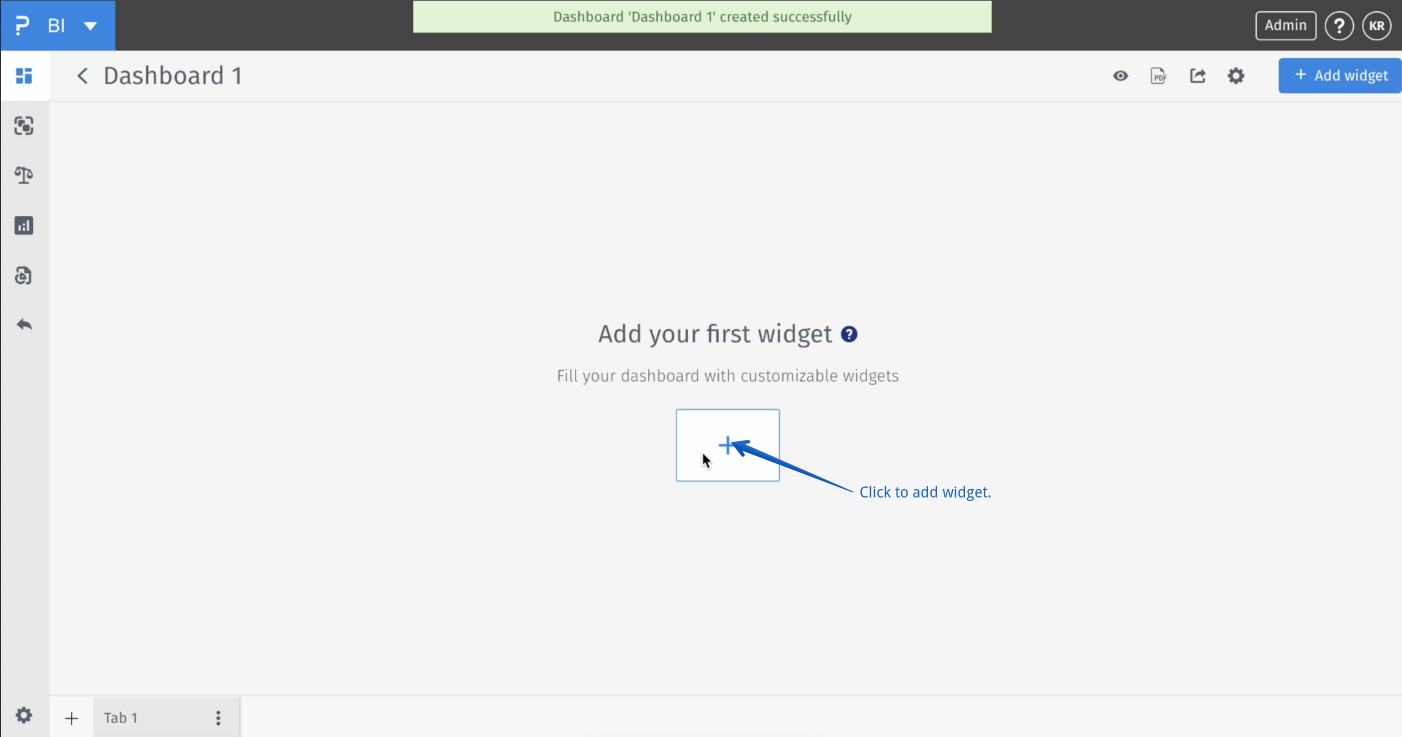
BI -> Create dashboard -> Blank Dashboard -> Add widget
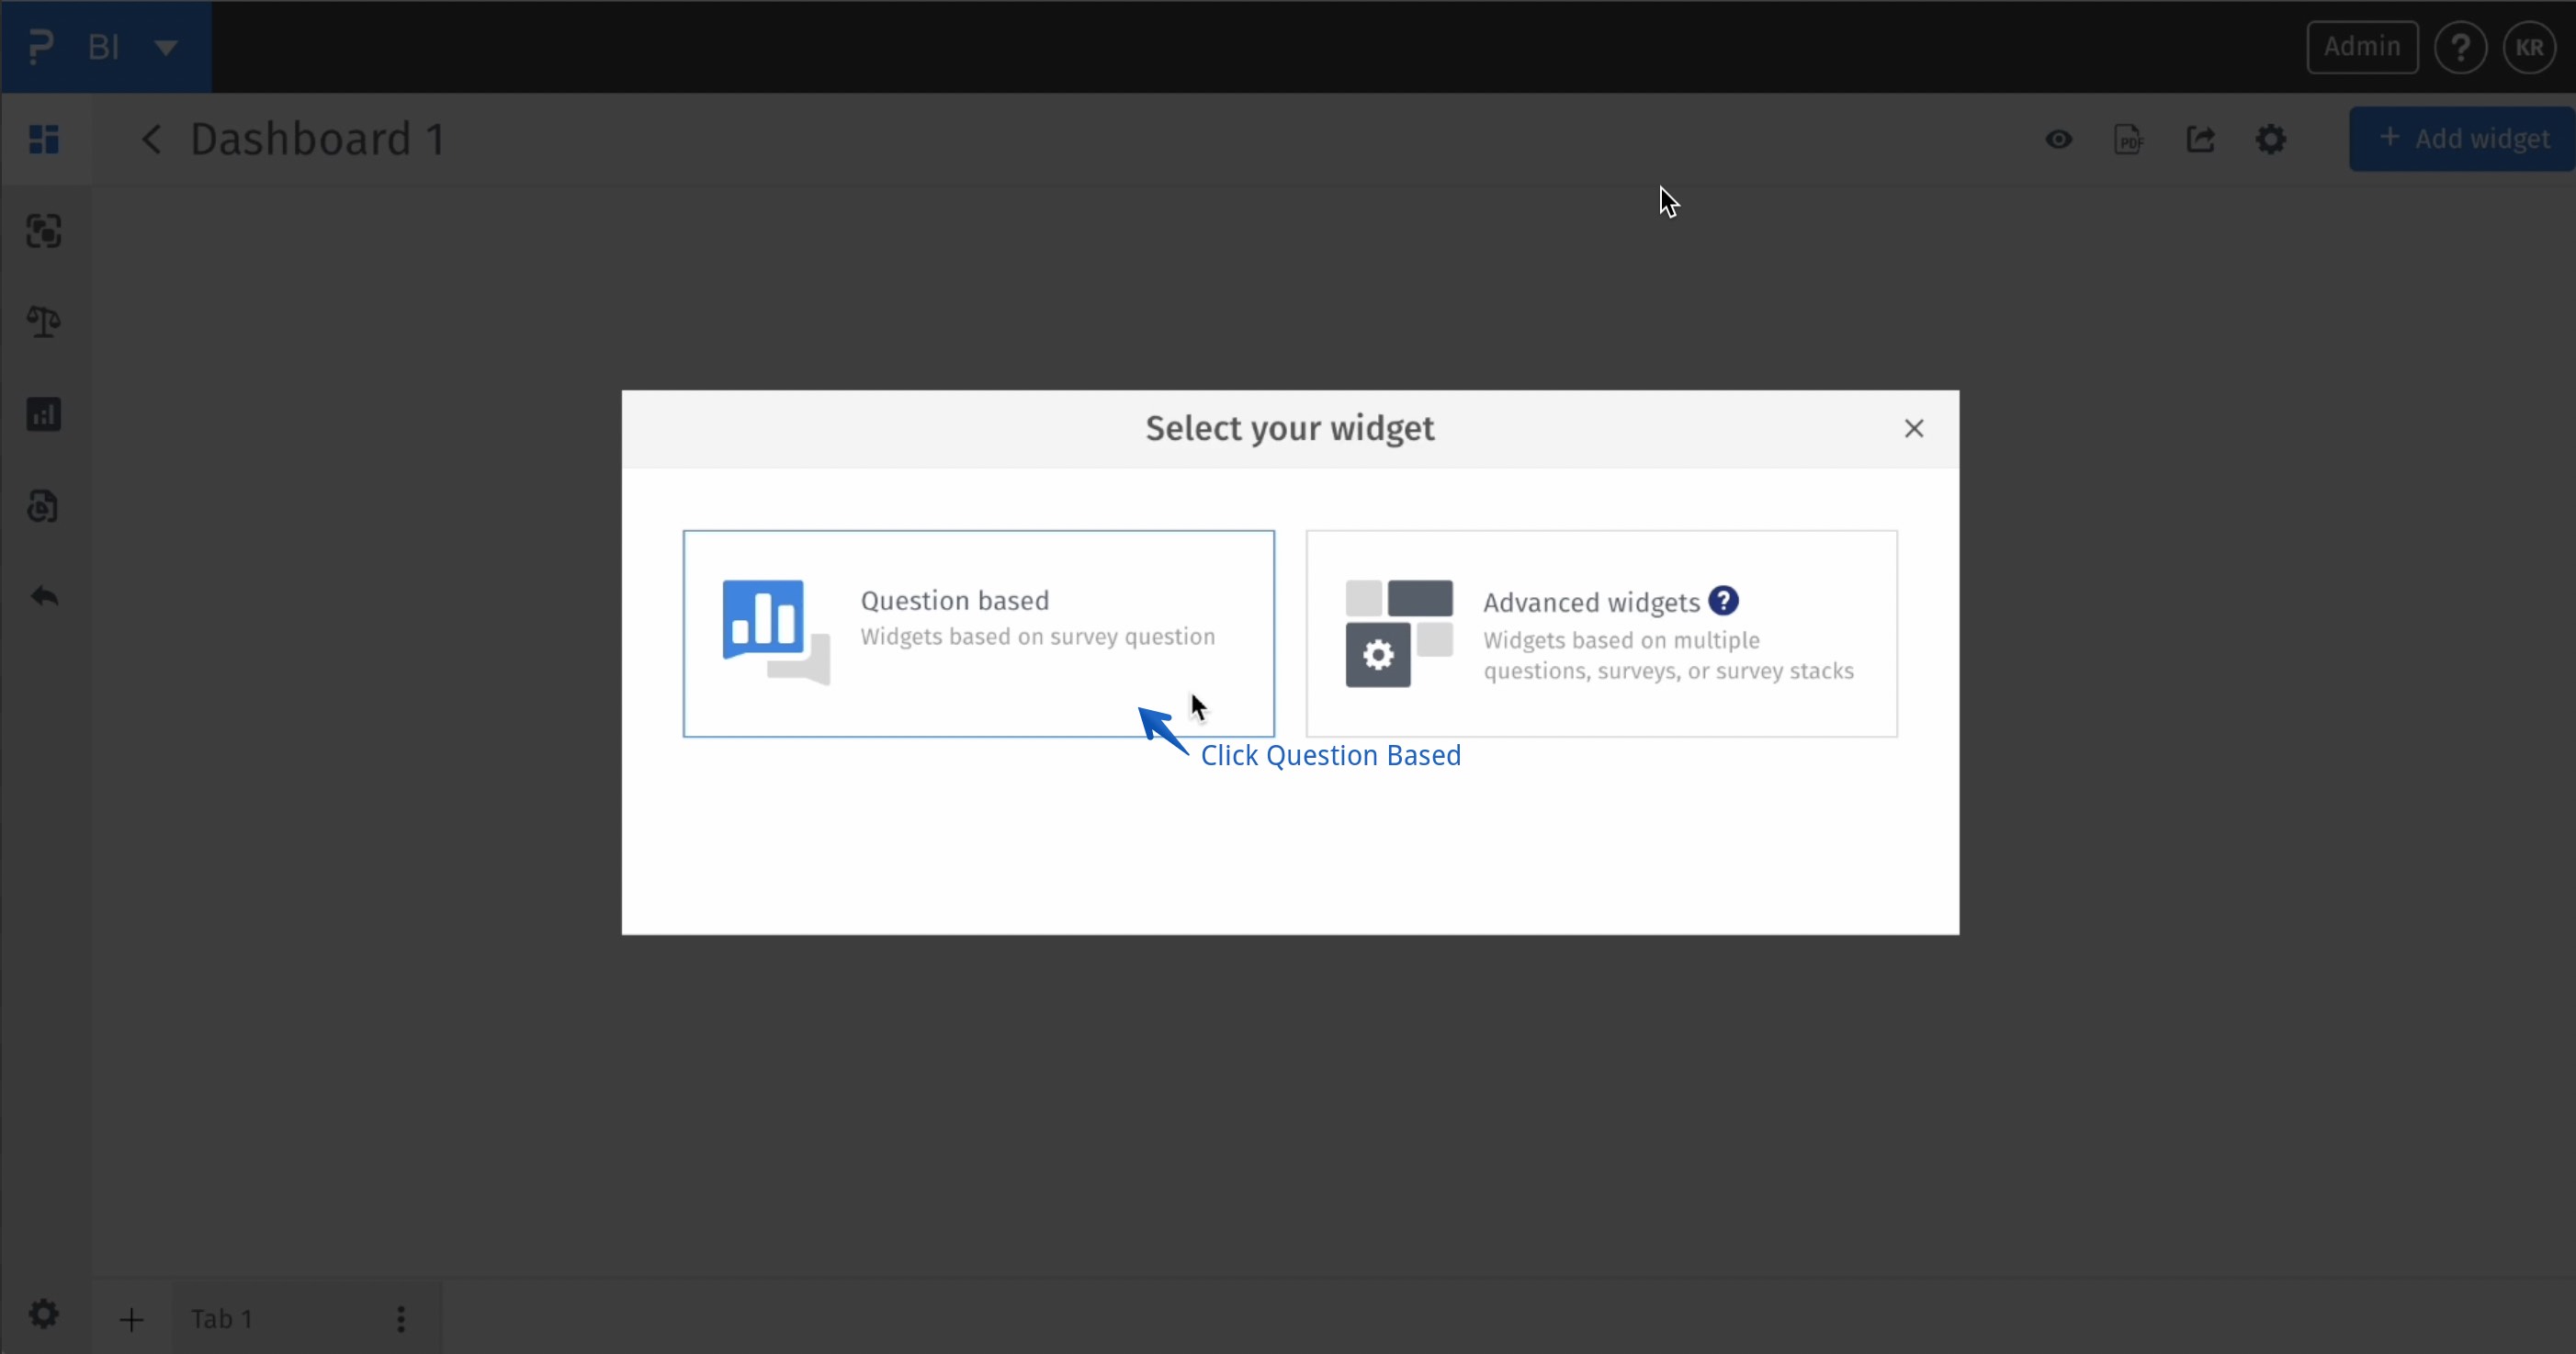
BI -> Create dashboard -> Blank Dashboard -> Add widget -> Question Based
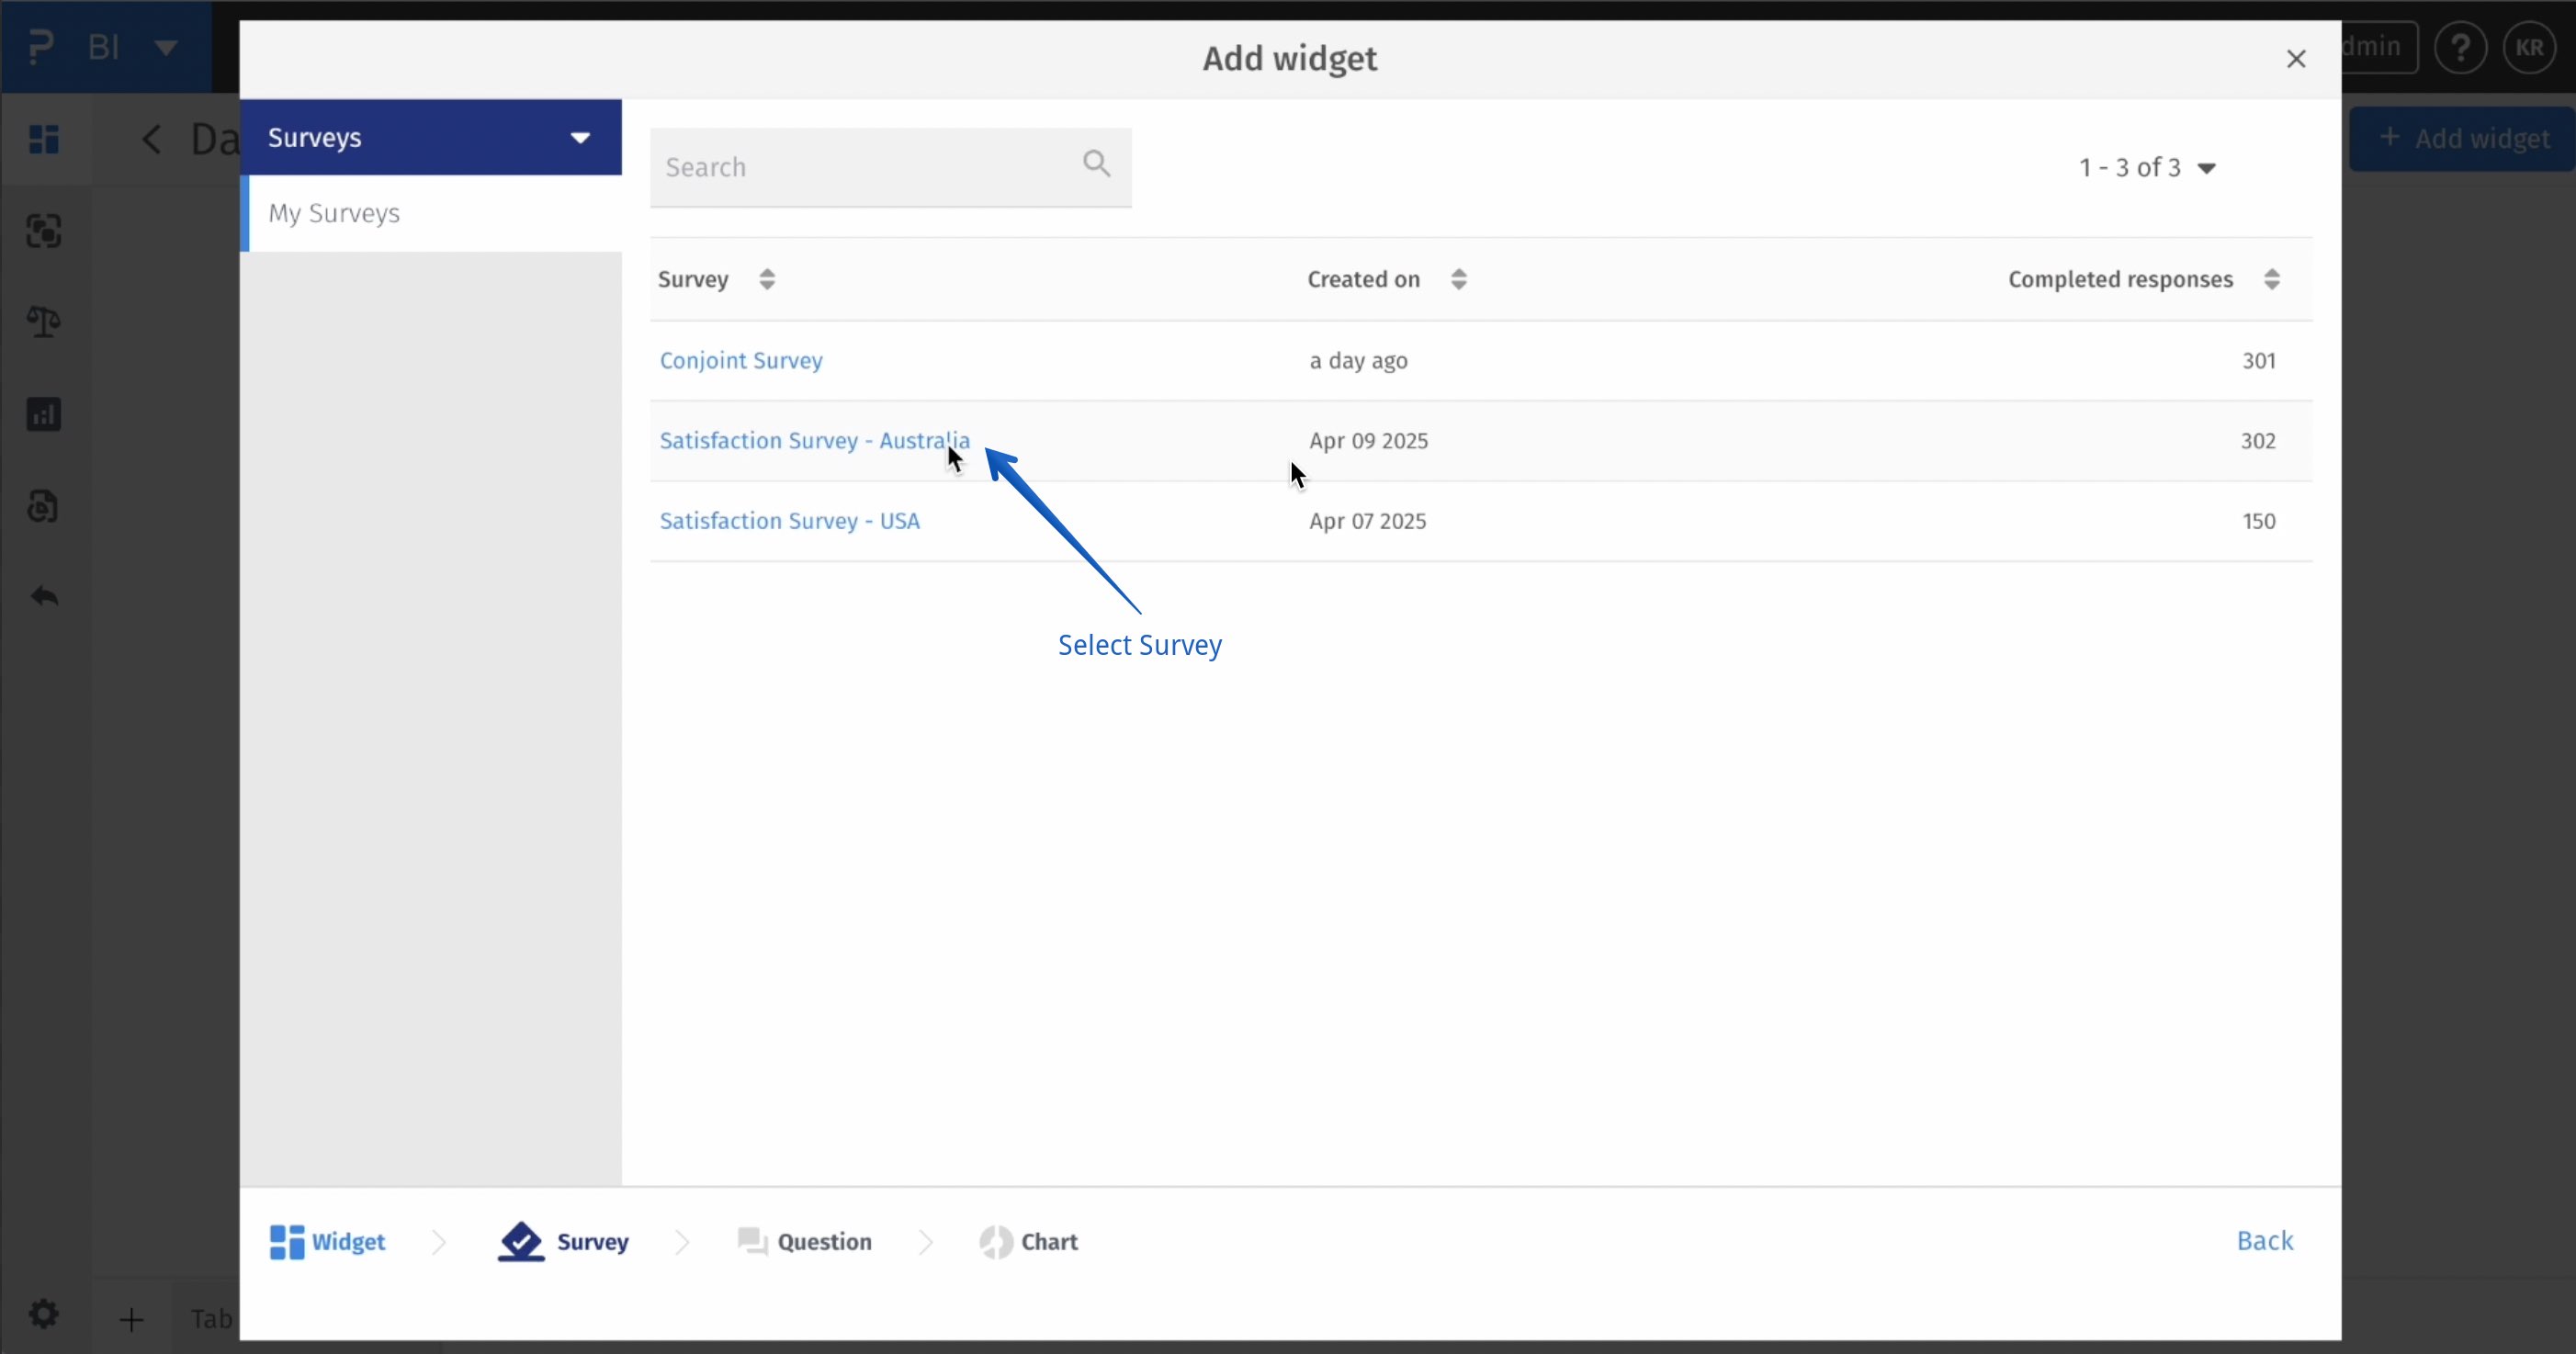
BI -> Create dashboard -> Blank Dashboard -> Add widget -> Question Based -> Select Survey
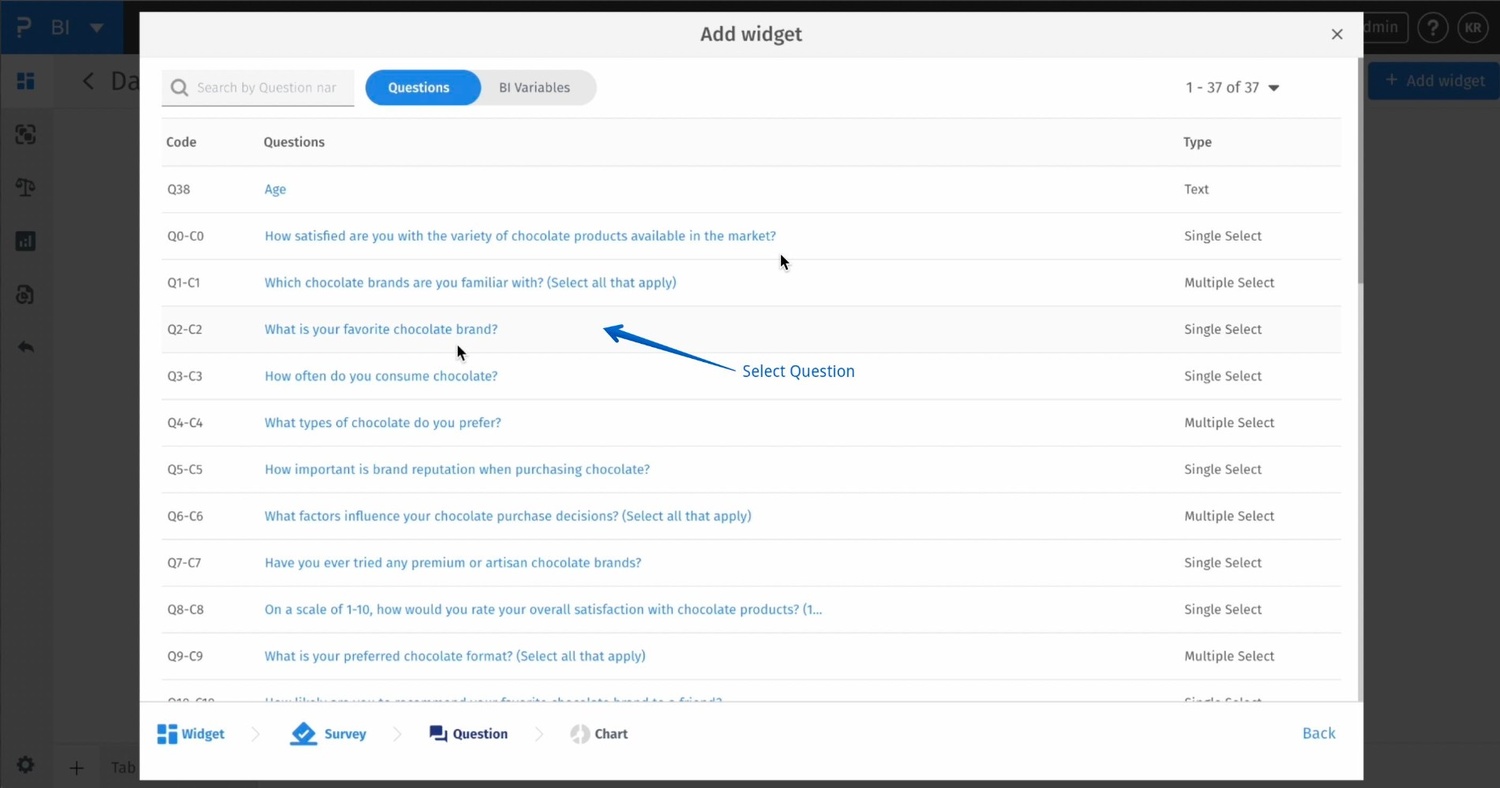
BI -> Create dashboard -> Blank Dashboard -> Add widget -> Question Based -> Select Survey -> Select Question
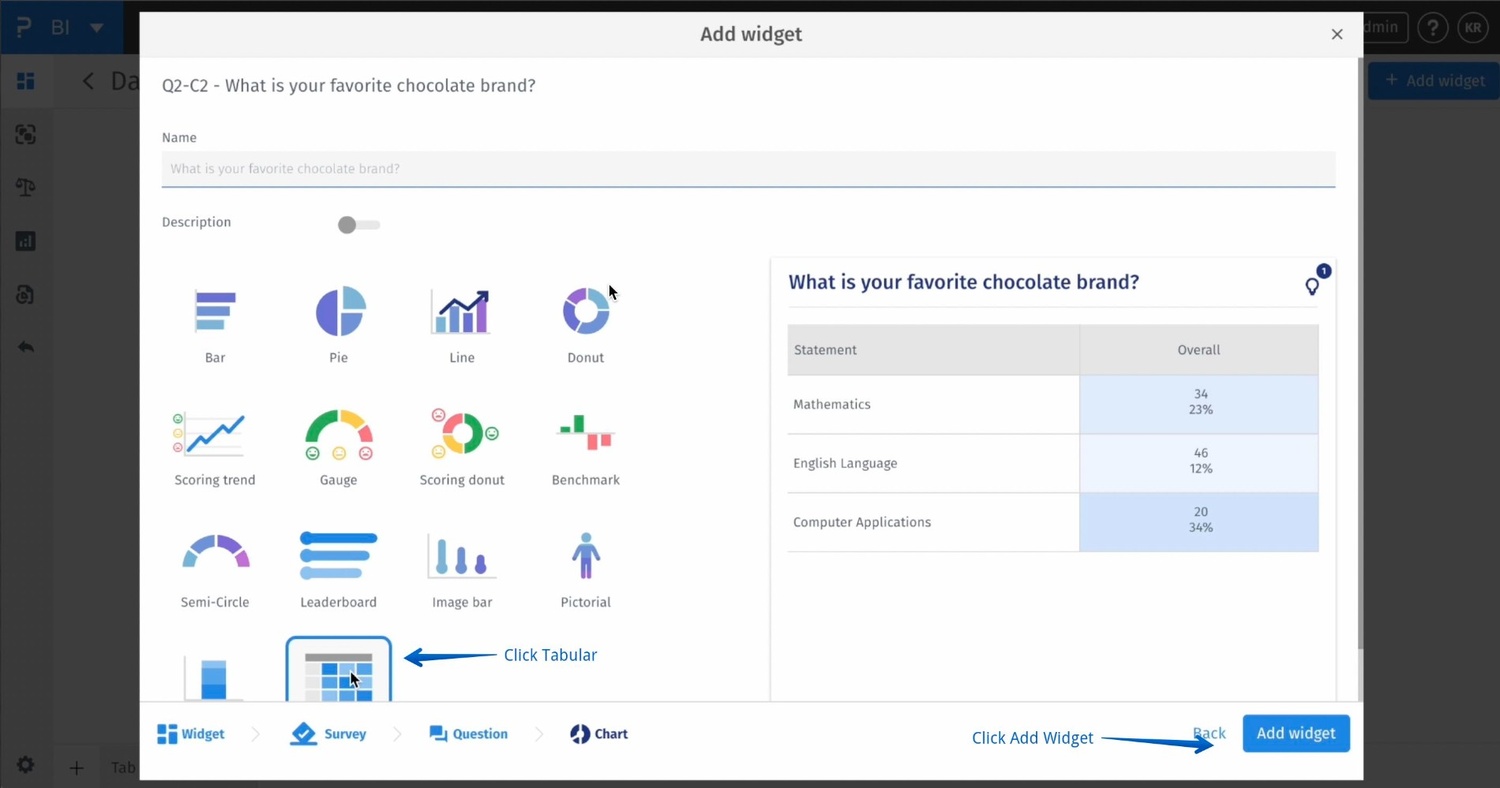
BI -> Create dashboard -> Blank Dashboard -> Add widget -> Question Based -> Select Survey -> Select Question -> Tabular Widget -> Add Widget
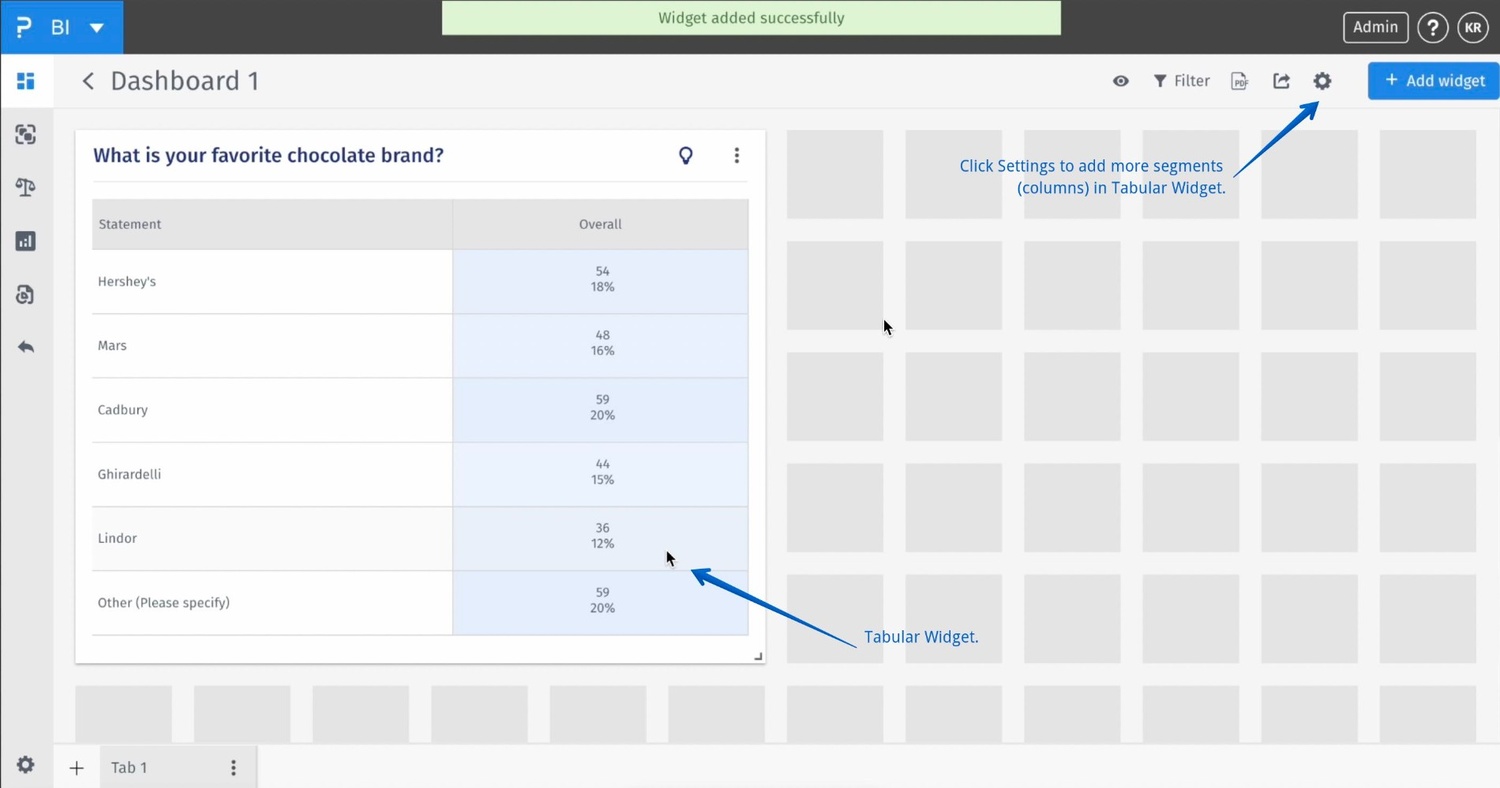
BI -> Tabular Widget
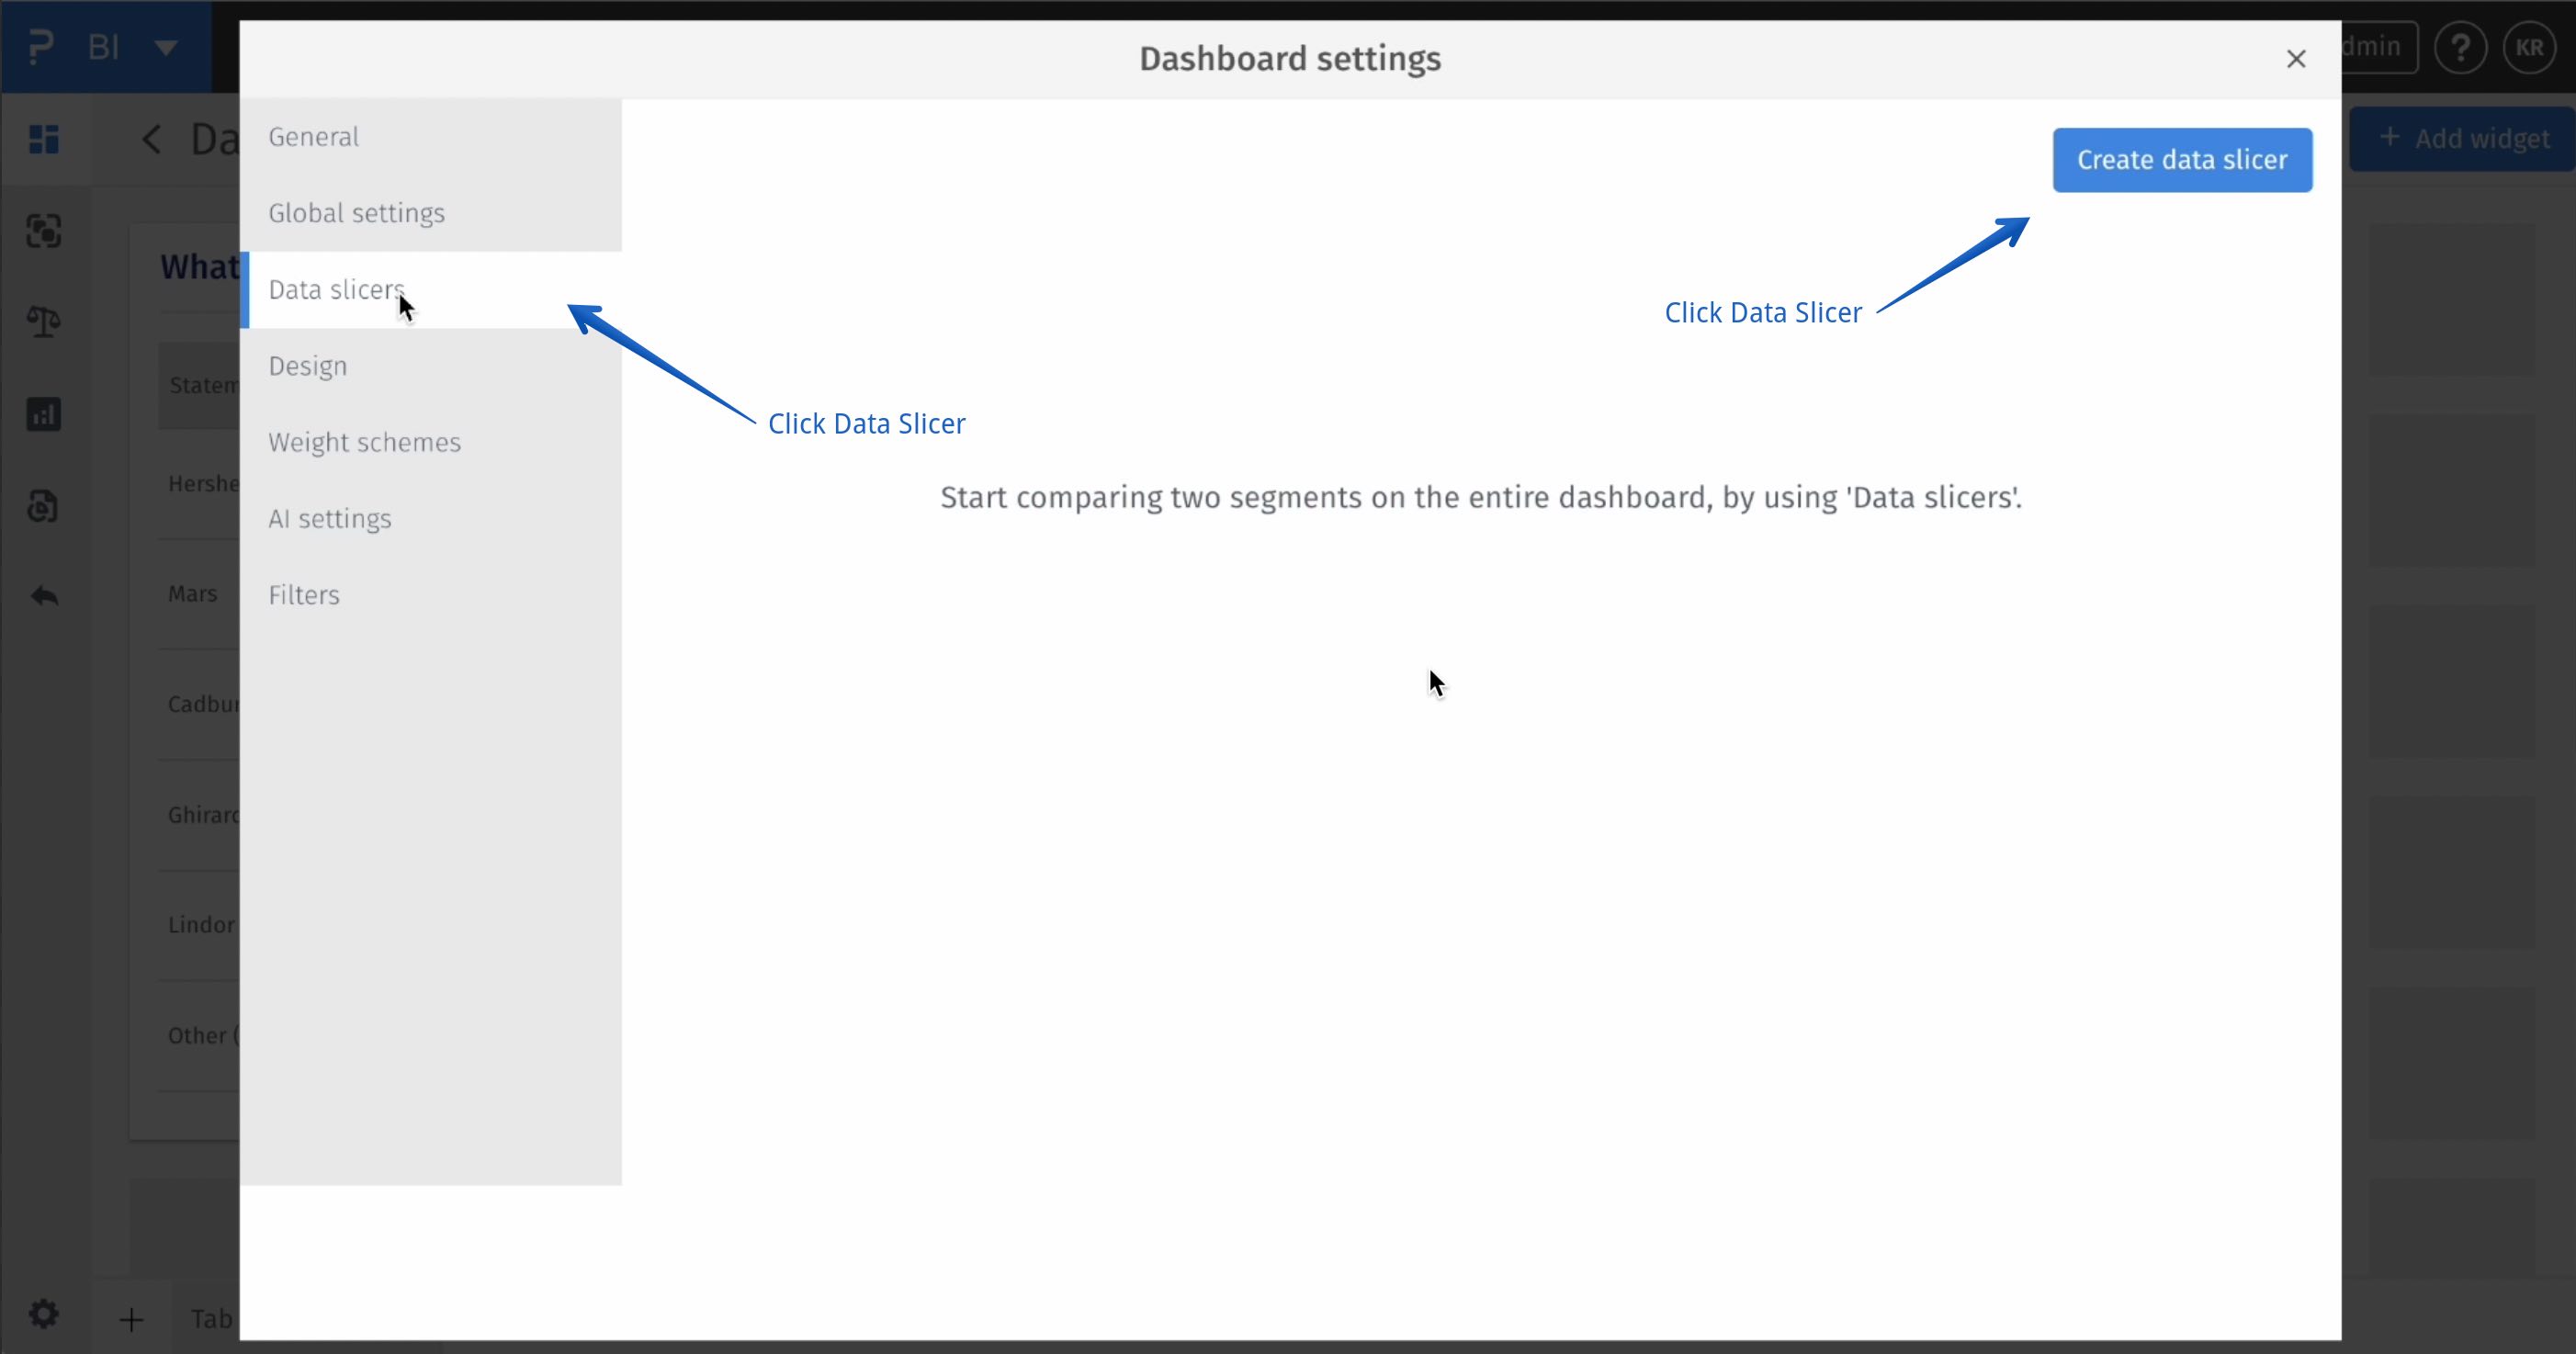
BI -> Dashboard -> Settings -> Data Slicer
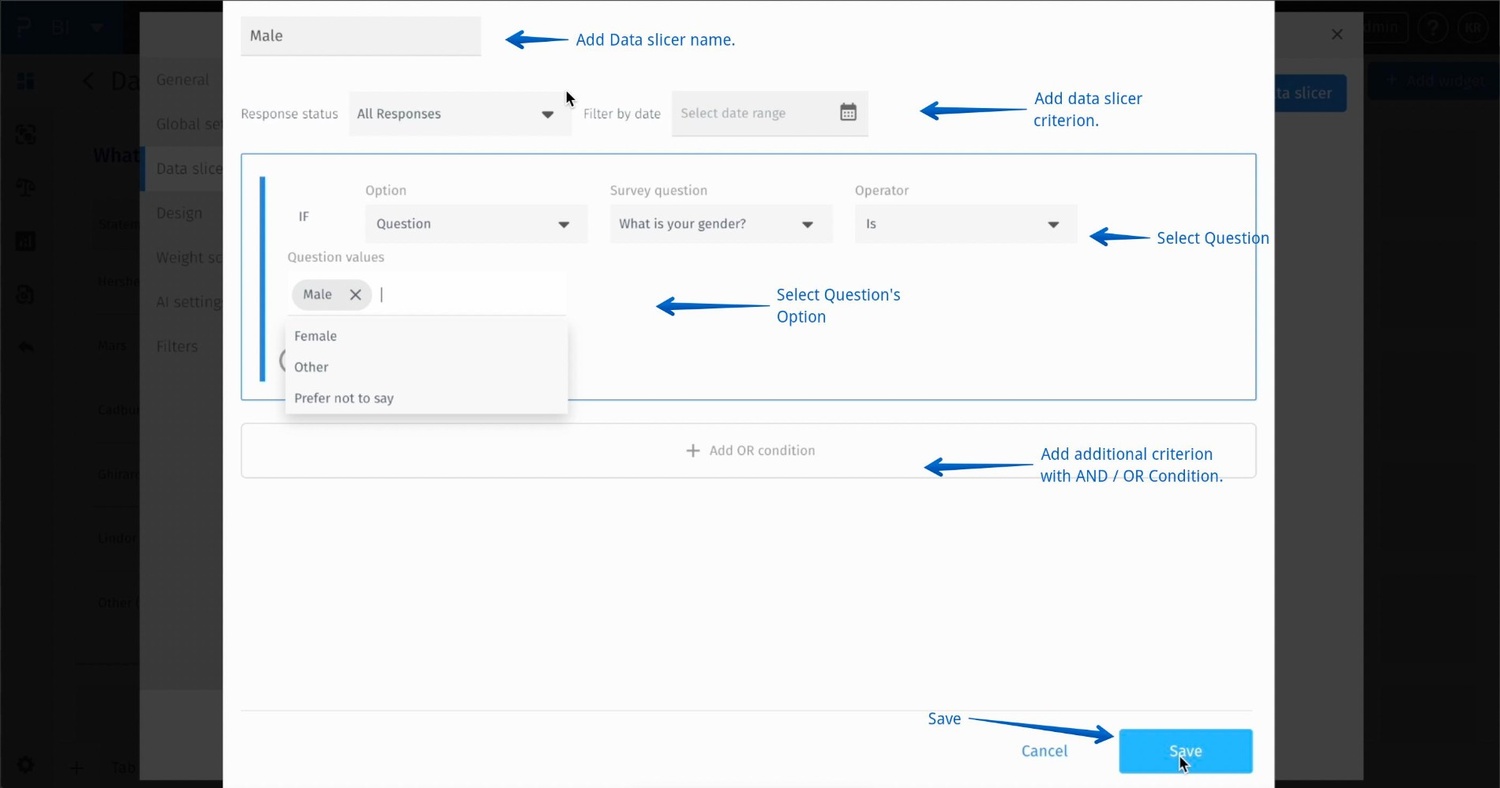
BI -> Dashboard -> Settings -> Data Slicer -> Data Criterion
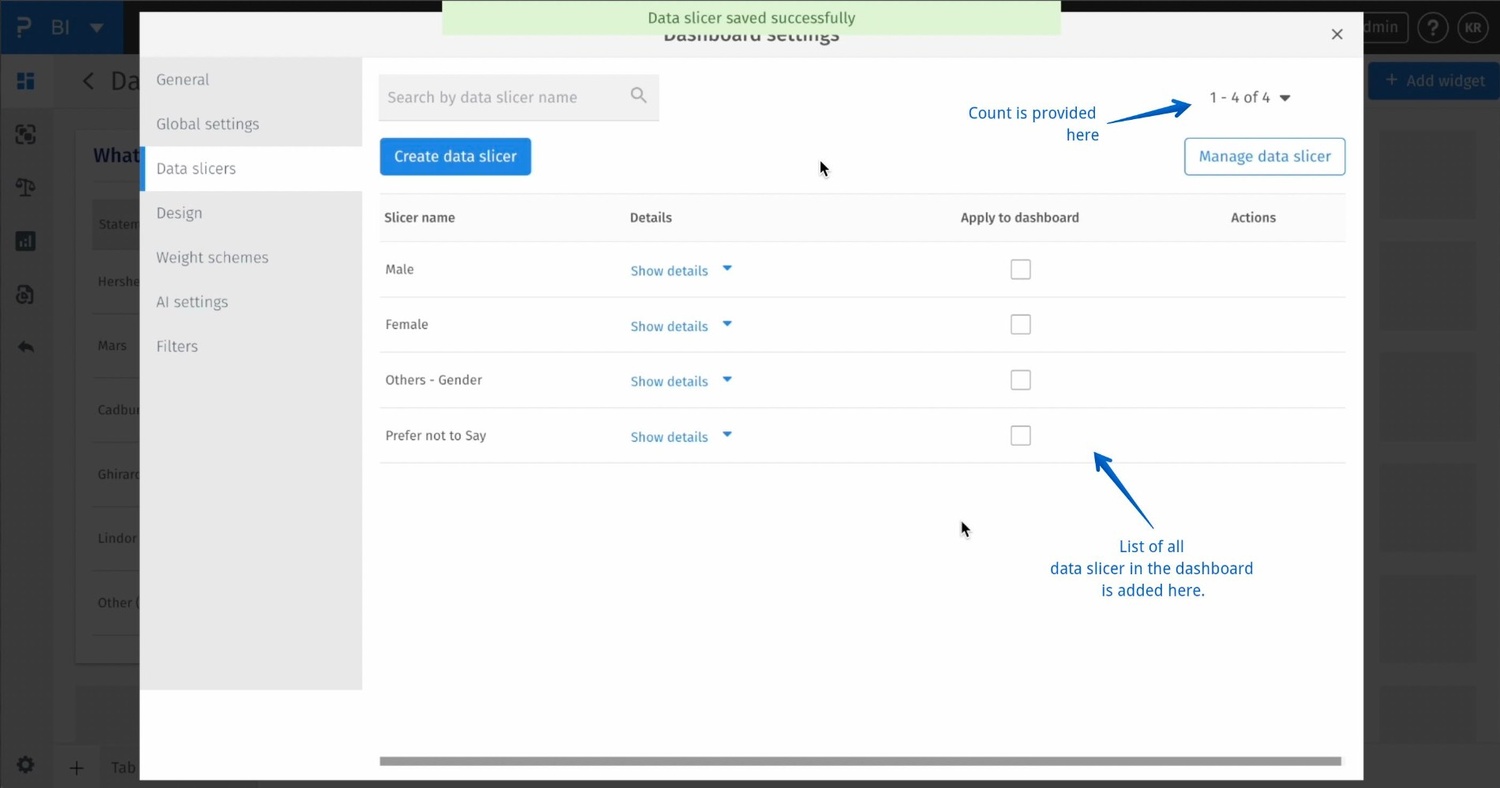
BI -> Dashboard -> Settings -> Data Slicer -> Data Criterion -> List of Data Slicer
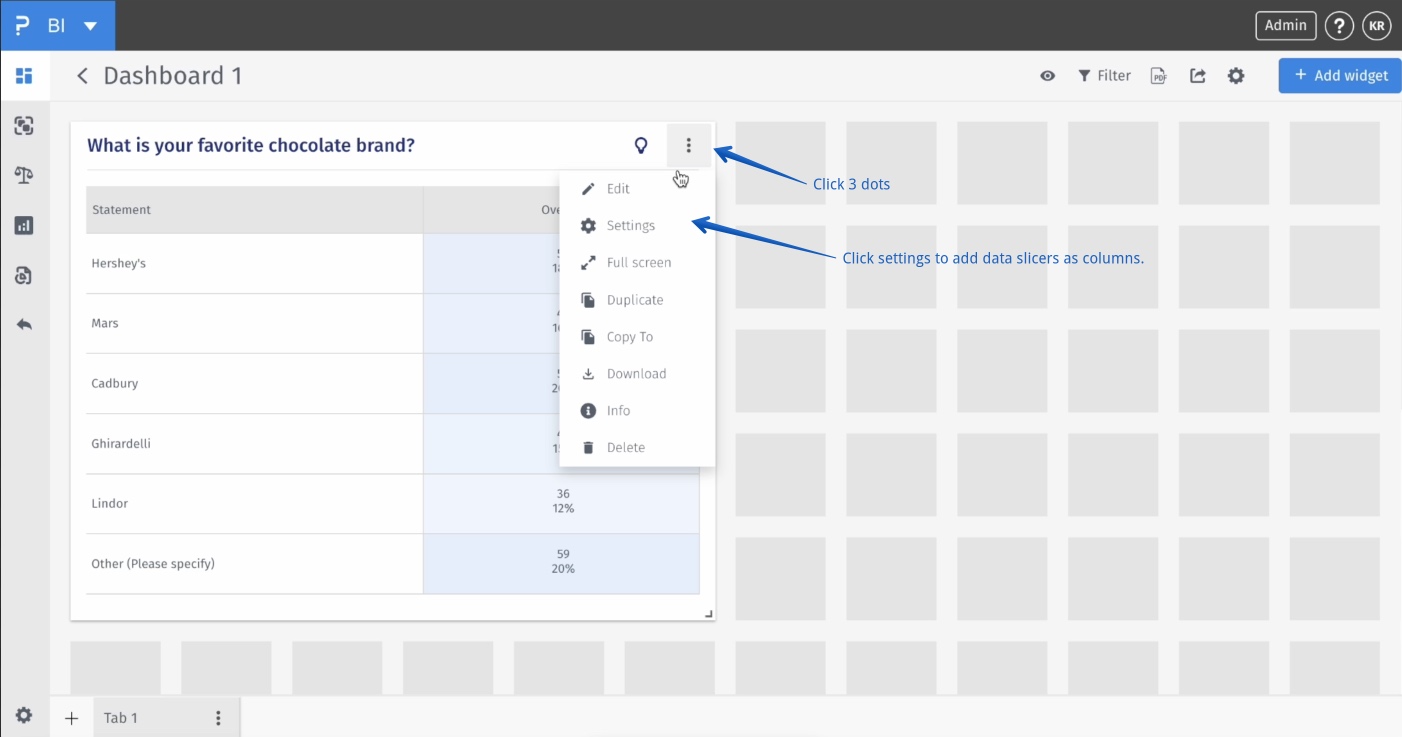
BI -> Tabular Widget -> 3 dots -> Settings
BI -> Tabular Widget -> 3 dots -> Settings -> Analytics -> Data slicer options -> Widget -> Select data slicer
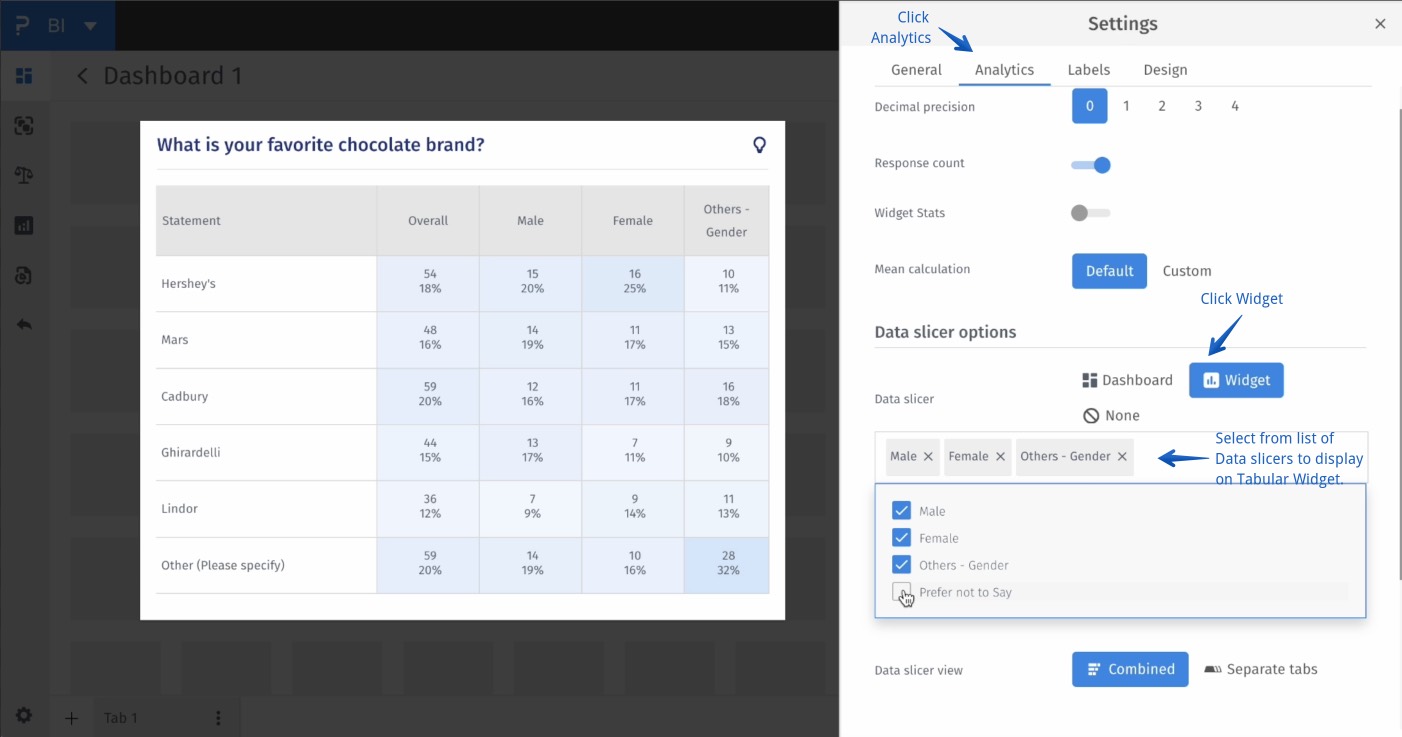
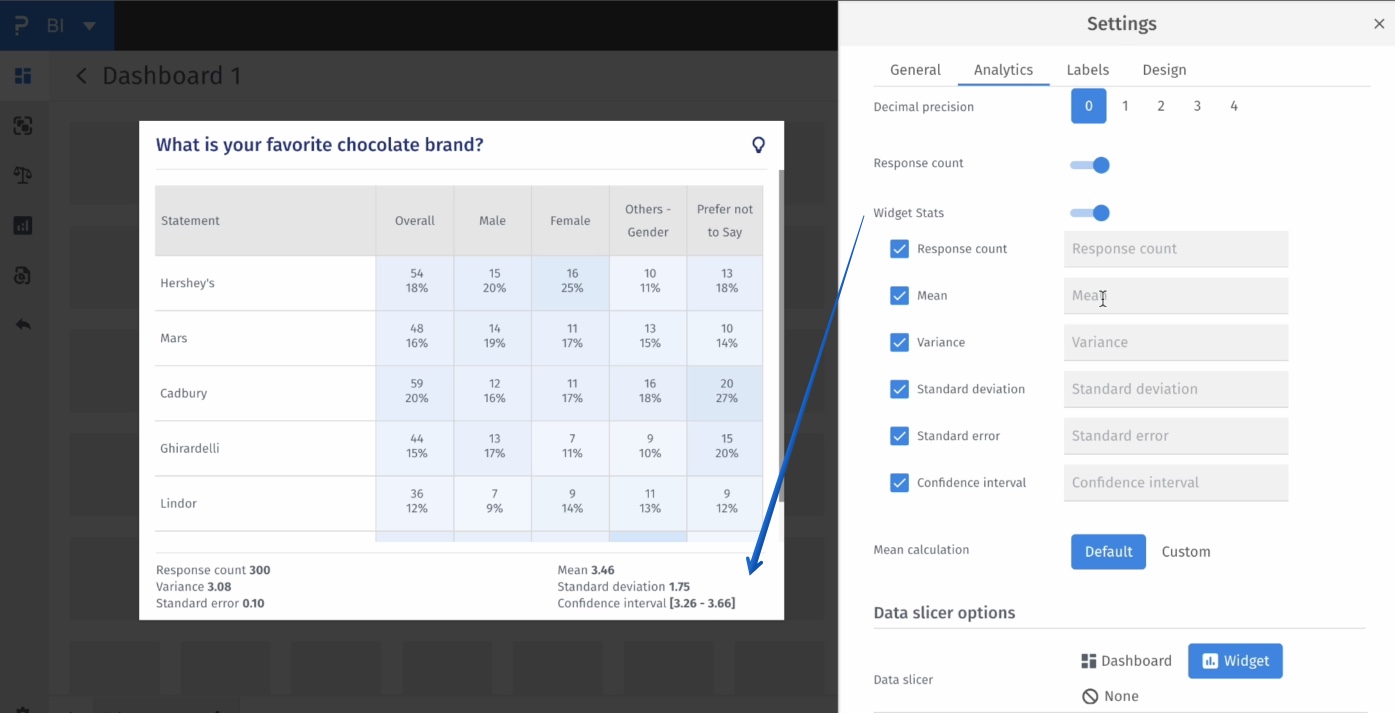
BI -> Tabular Widget -> 3 dots -> Settings -> Analytics -> Data slicer options -> Widget -> Select data slicer -> Widget Stats
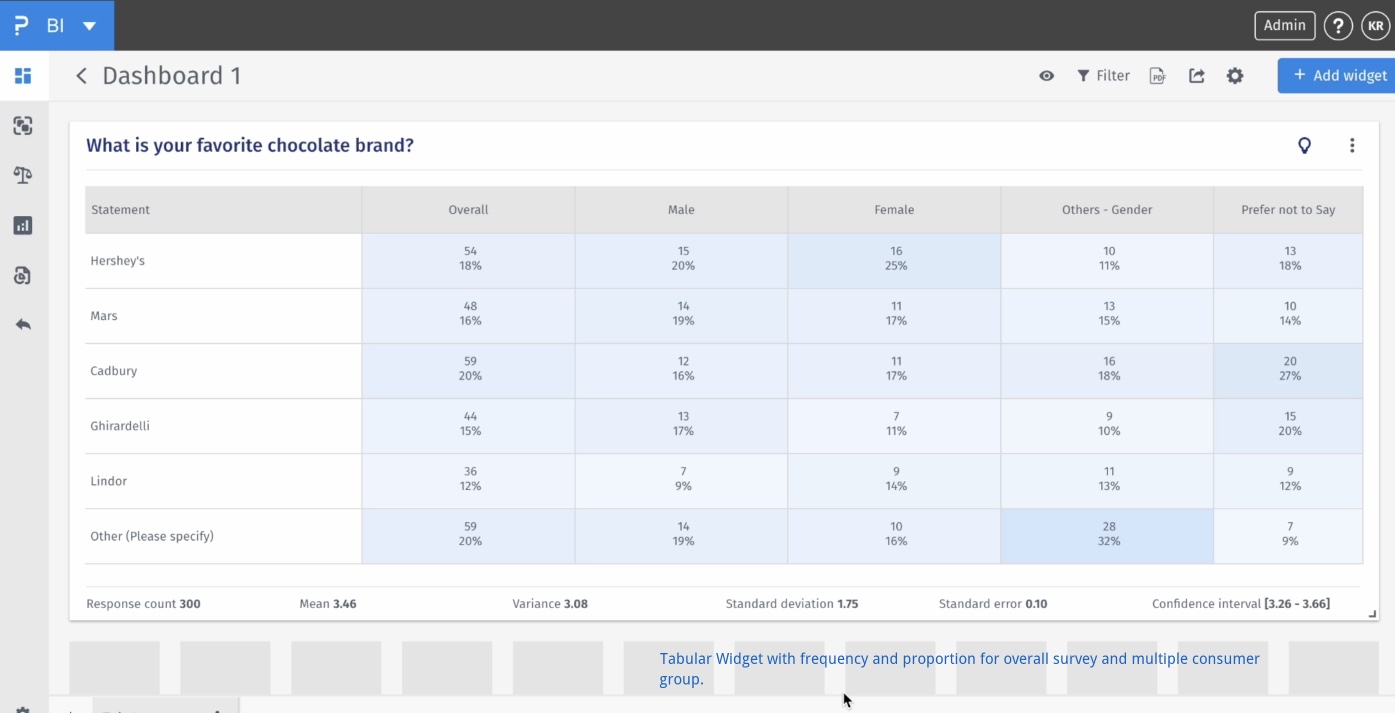
BI -> Tabular Widget
- Tabular: A feature that displays summarized matrix data in a table format showing only the overall values.
- Matrix: A data structure that displays values in rows and columns, often used to show relationships between variables.
- Summarization: The process of aggregating data to show key metrics or totals.
- Qualification Criteria: Conditions based on survey variables used to define respondent groups (e.g., age ≥ 25).
- Frequency: The count of respondents who selected a particular response.
- Proportion: The percentage of a group (or total) that selected a particular response.
- Slice: To filter or segment the data based on a condition.
- Overall Sample: The full respondent base that completed the survey, used as a benchmark.