
- 360 feedback introductory text
- 360 feedback display configurations
- 360 feedback display labels
- Track and Display Subject Actions
- 360 Surveys- Presentation Text
- Multi Level Priority Logic
- 360 Surveys- Priority Model
- 360 Surveys- Rich Content Editor
- 360 feedback - skip logic
- 360 feedback - show hide question logic
- 360 feedback display settings
- 360 feedback configuration
- Customize the validation text
Time Trend Widget in Workforce Analytics Portal
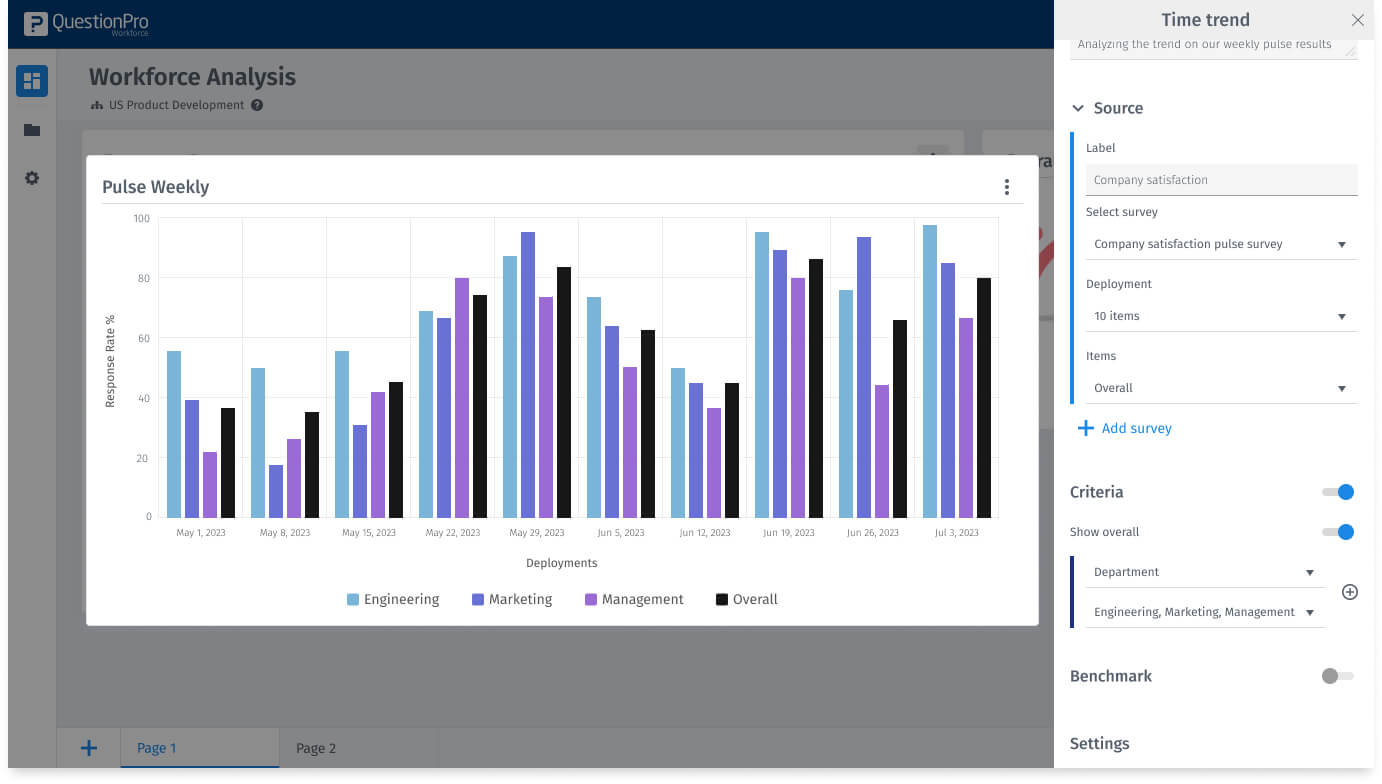
The time trend widget revamp includes allowing users to customize data by selecting metrics (eNPS, mean, agreement %, response rate), set deployment or time-frequency, compare surveys, demographics, and departments, improve user experience with various chart formats, and enable data download in excel and PDF.
Coming soon: February 2024
How to add Time Trends widget:
Go to: Analytics Portal » Employee Experience » Create a Dashboard.
Click on Add a widget and select Time Trend In pop-up, add widget title, select the chart type, select survey and deployments. Click on Add Widget.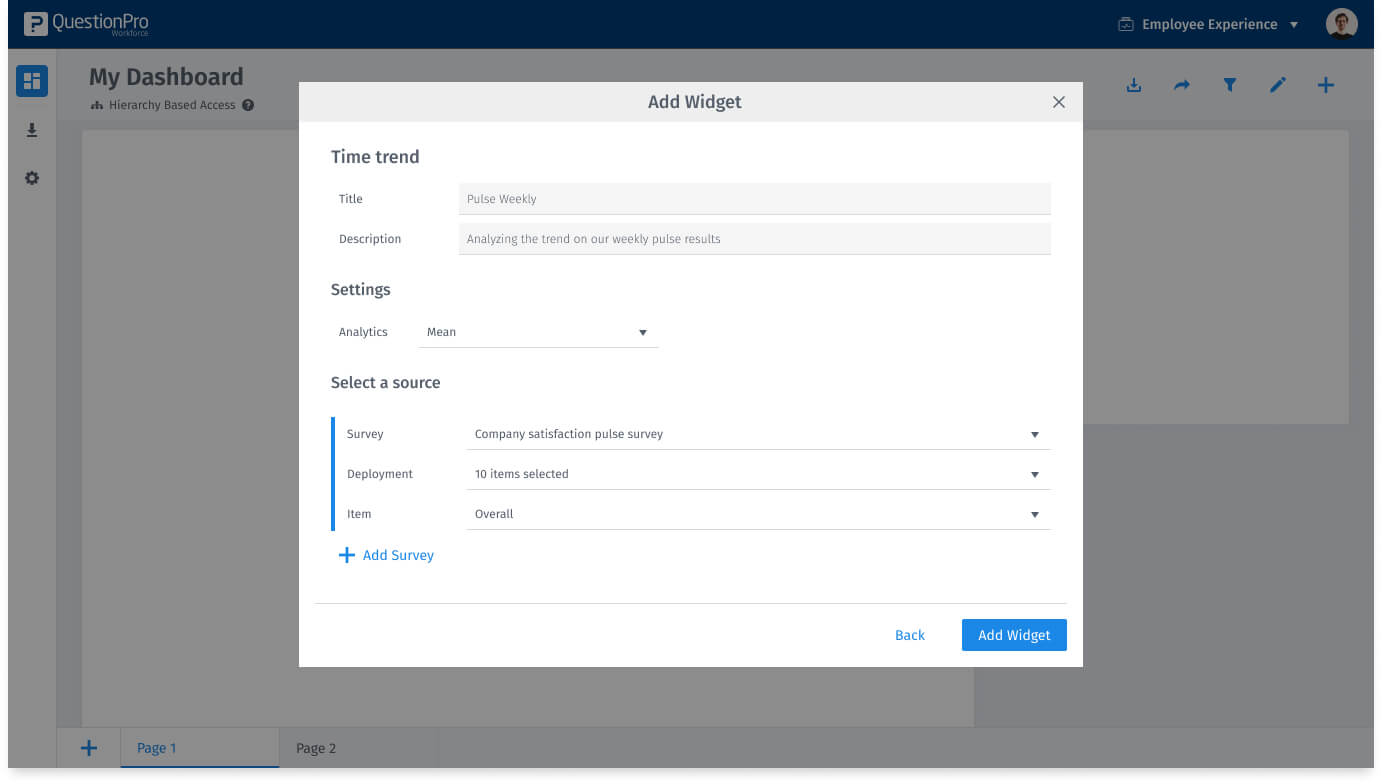 Types of charts in time trend widget:
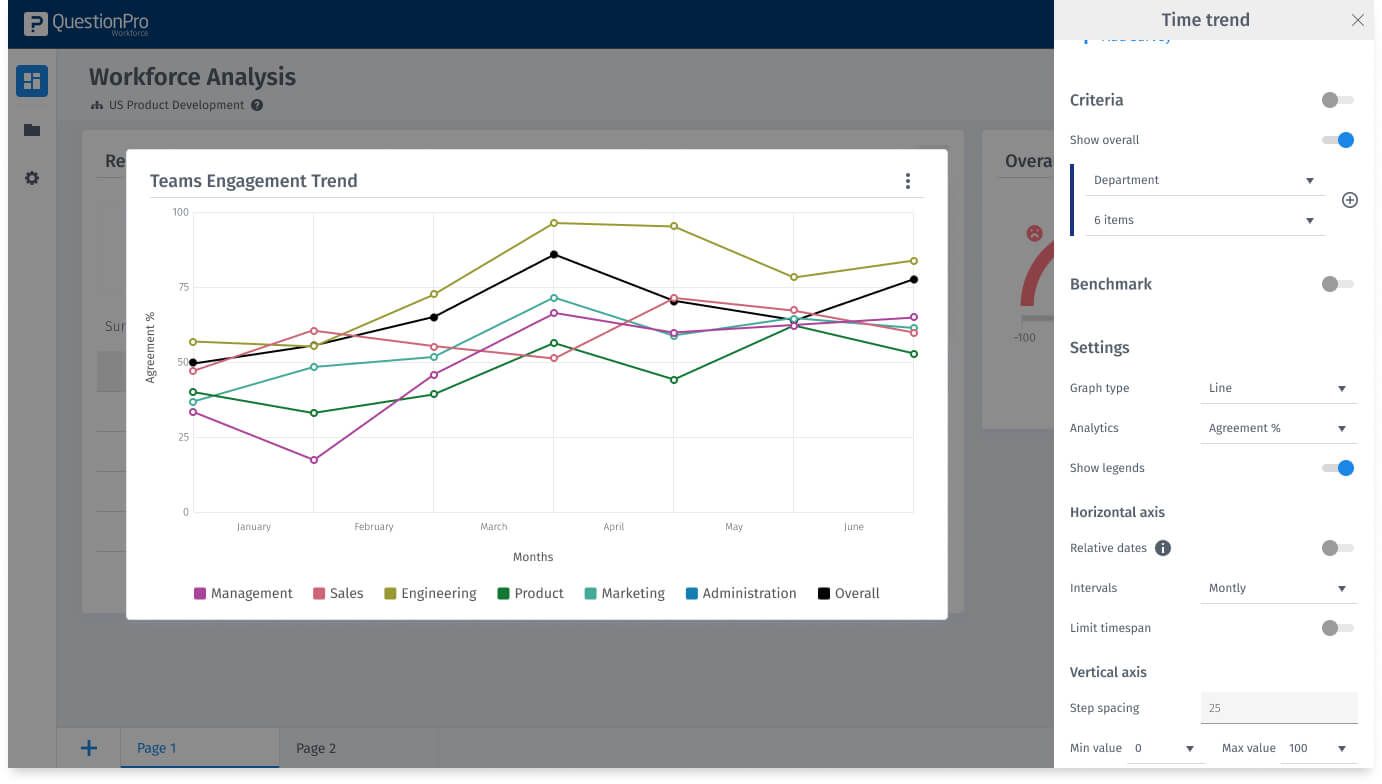
Line:
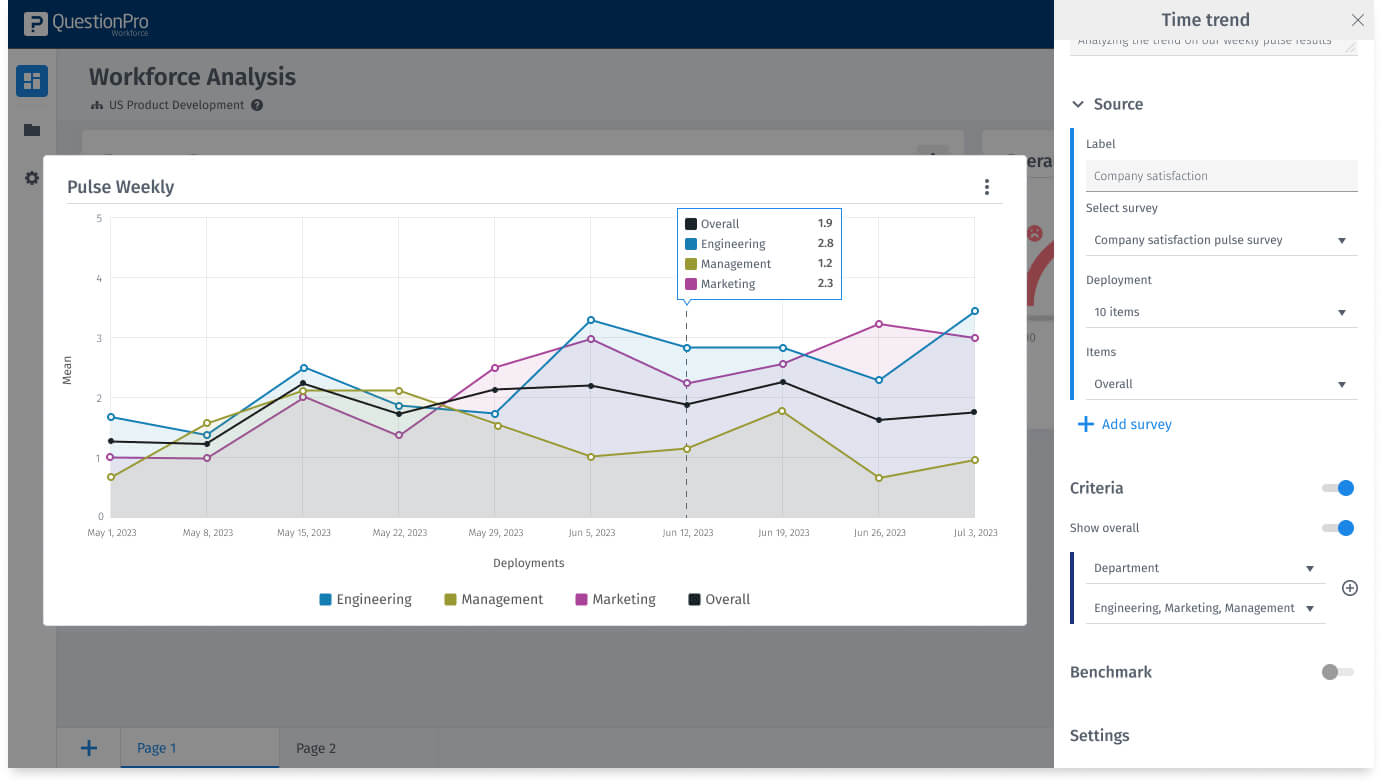
 Area:
Area:
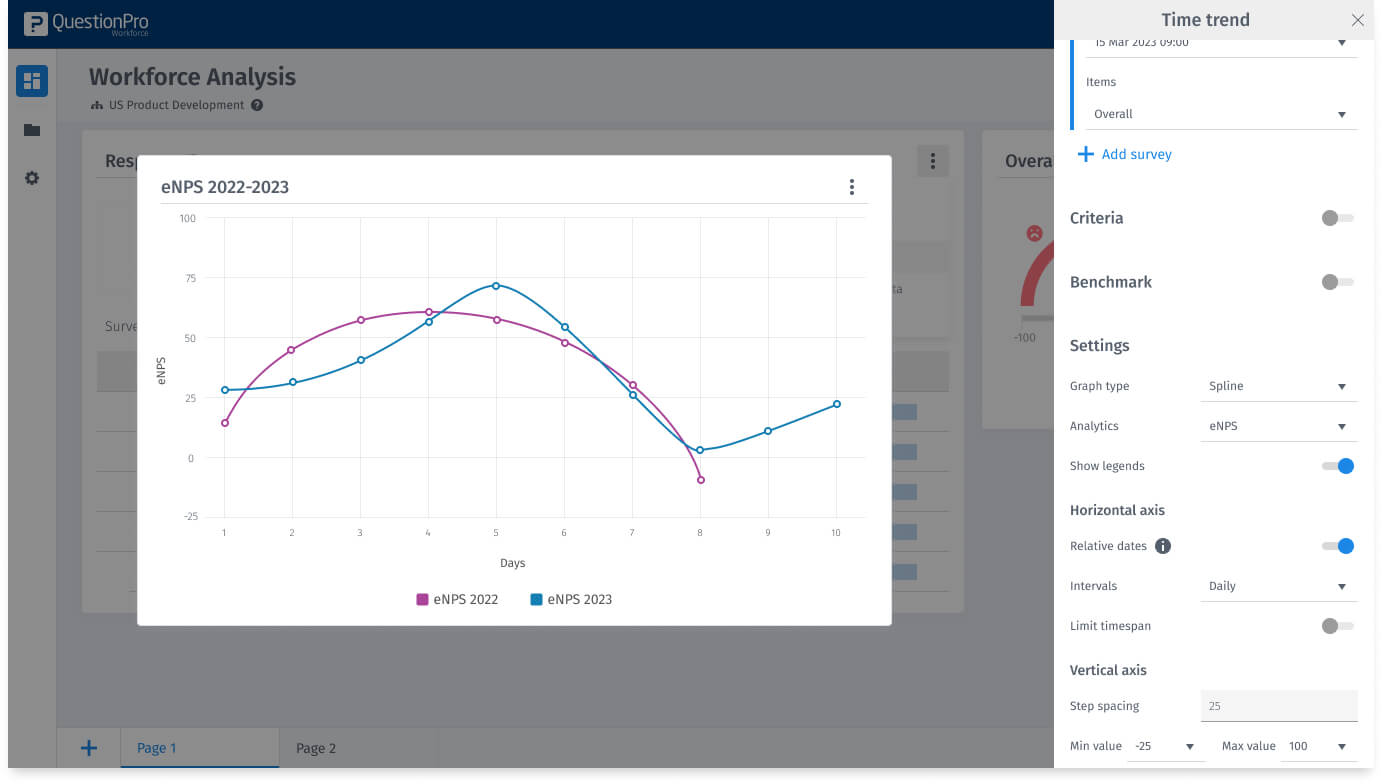
 Spine:
 Bar:
Bar:
You may also be interested in...
Create Survey - How to?
Add Questions - How to?
Standard Question Types
Multilingual Surveys - How to?

