
- Survey Comparison
- Heatmap
- Anonymity Settings
- eNPS in Workforce Analytics Portal
- QxBot Assist in Workforce
- Notes Widget
- Text Analysis Widget
- Response rate
- Text Report
- Trend analysis widget
- Show/hide Markers and Building blocks
- Question Filter
- Single Question Widget
- Heatmap default
- Sentiment analysis
- Scorecard
- Driver analysis
- Scorecard: All options view
- Heatmap Custom Columns
- 360 feedback introductory text
- 360 feedback display configurations
- 360 feedback display labels
- Multi Level Priority Logic
- 360 Surveys- Priority Model
- 360 feedback - skip logic
- 360 feedback - show hide question logic
- 360 Survey Settings
- 360 feedback configuration
- Customize the validation text
- 360 Survey design
- 360-Reorder section
- 360 Section Type - Single Select Section
- 360 Delete Sections
- 360 Add Sections
- 360 section type - Free responses text section
- 360 Section Type - Presentations text section
- 360 Section-Edit Configurations
- 360 Survey- Languages
- Matrix section
Workforce 360 Survey- Reports
A custom individual 360 survey reports to easily represent the relevant data and results in the PDF format. Individual reports are reports that contain evaluation data for one subject. These reports are designed to create high-level, aggregate visual representations of data to see how the subjects are being evaluated and rated.
How to create custom reports in 360 surveys?
- Click on Analytics tab in the dashboard and go to Individual reports.
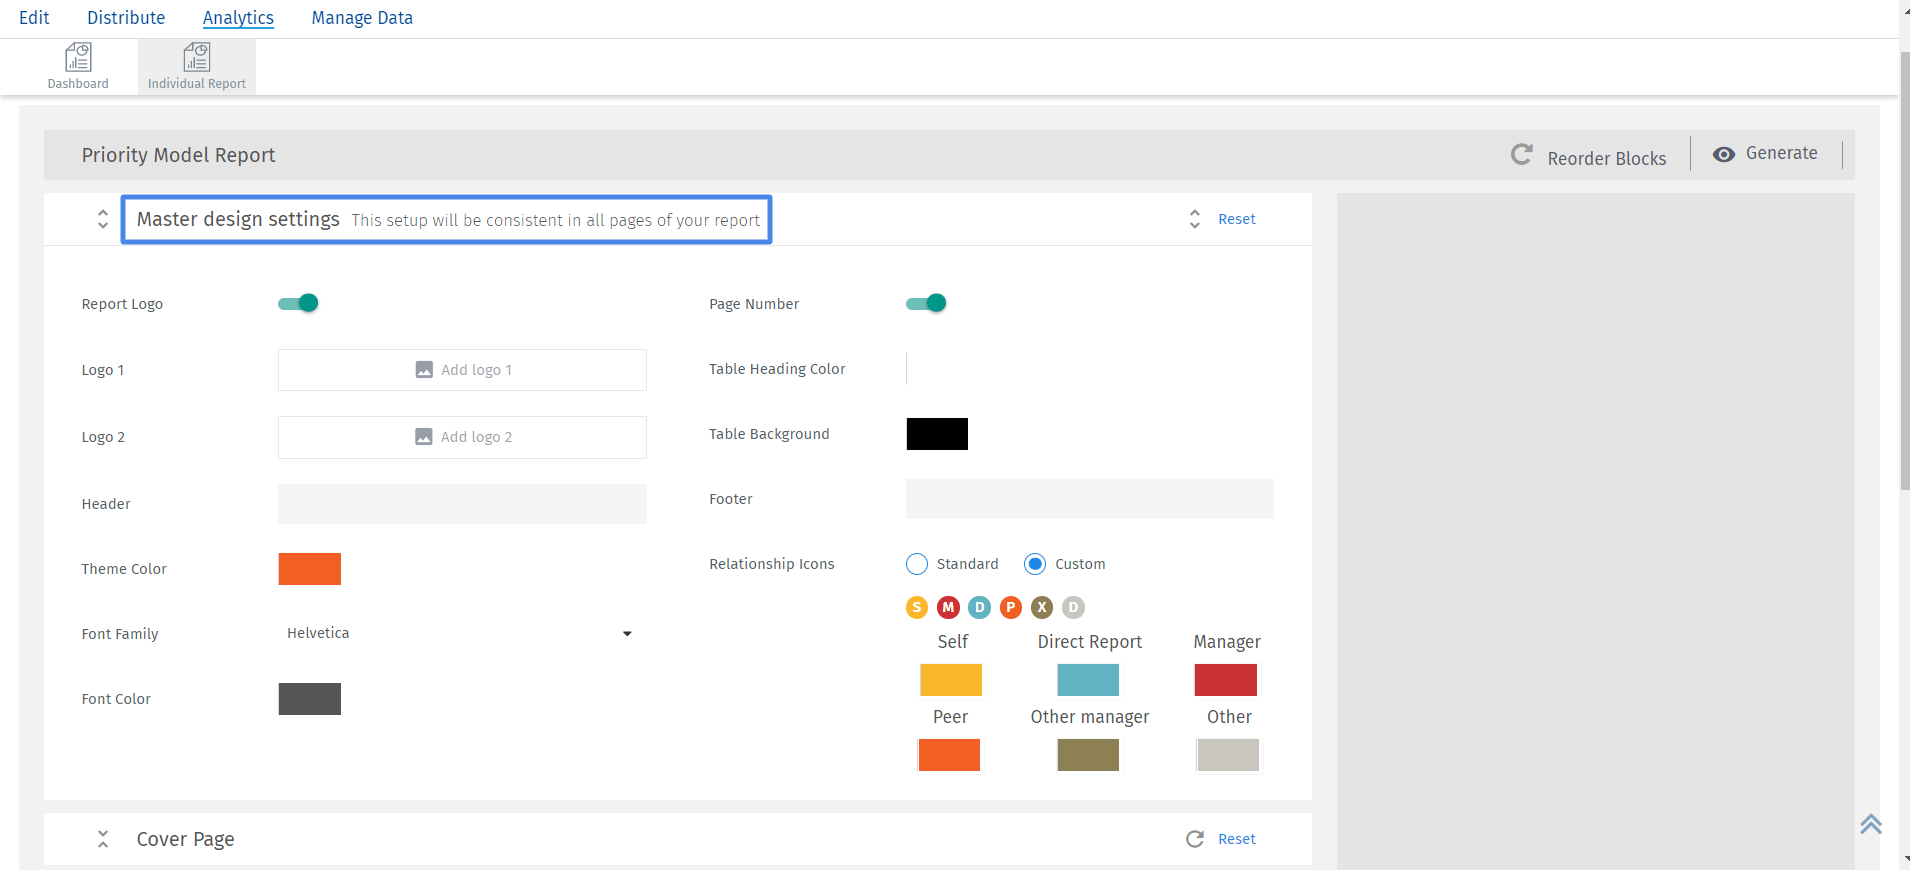
- Master Design settings lets to set up a theme for the entire report. You can set up font style, and color, custom header and footer, Logos, and Page size. You can enable the page numbering, and the report logo as well.
- The real time preview will be visible to you in the right side of the dashboard.You can navigate through the pages of the preview, zoom in and out the preview section, and download the PDF too.
- The options you add in the section can be re-ordered by a simple drag and drop. Except the block for Master design settings, rest all of the blocks can be disabled or re-ordered.
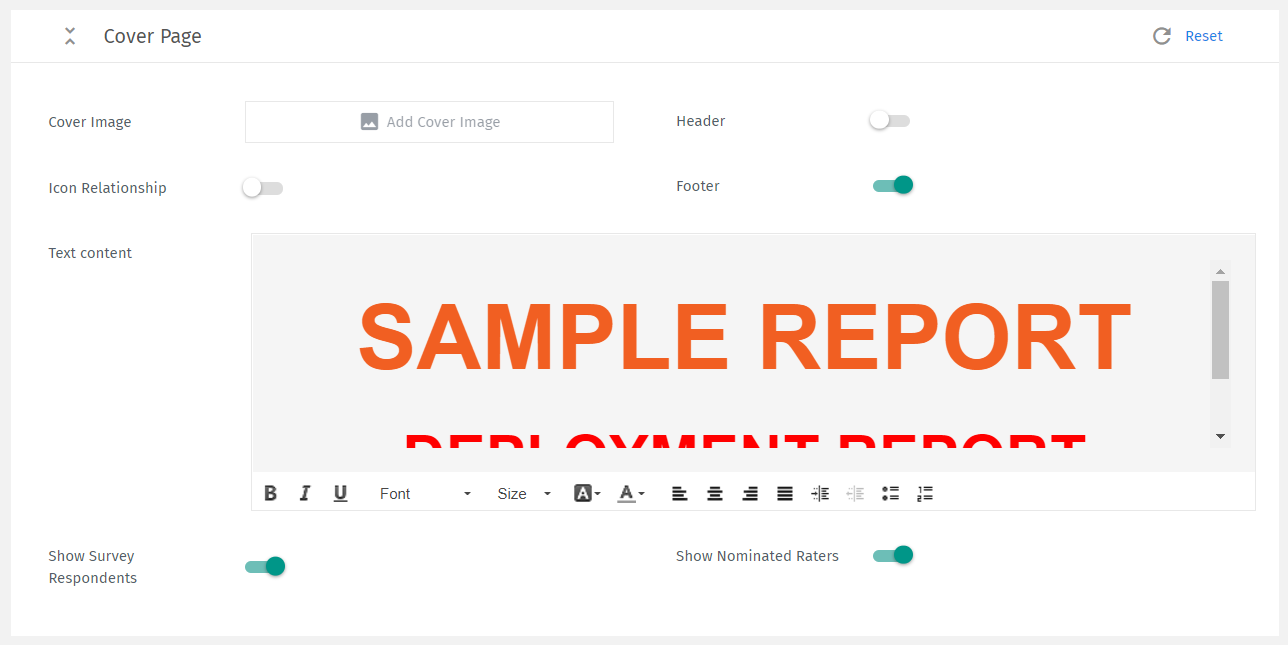
- Cover page section allows you to create a cover page for the report PDF. You can enable or disable the header and footer on the cover page, you can add the cover image, back ground image, and the content in the form of text for the cover title. You can format the text content with the help of rich content editor.
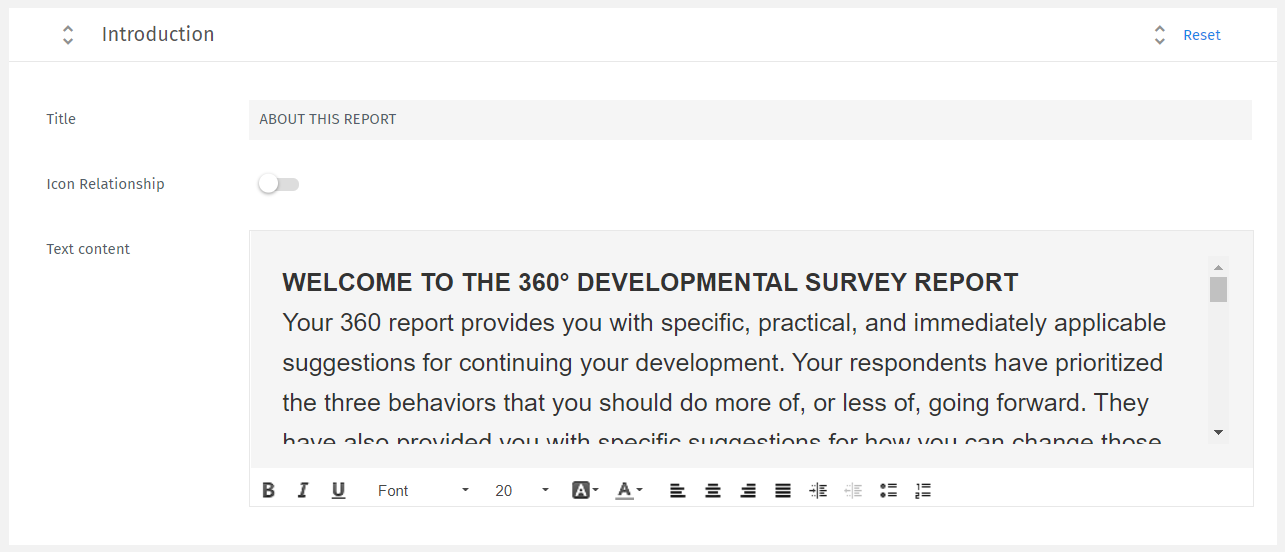
- Introduction section will allow you to add the introduction and the details of the report in the PDF. The fields are provided to add the title and the description for the introduction of the report.
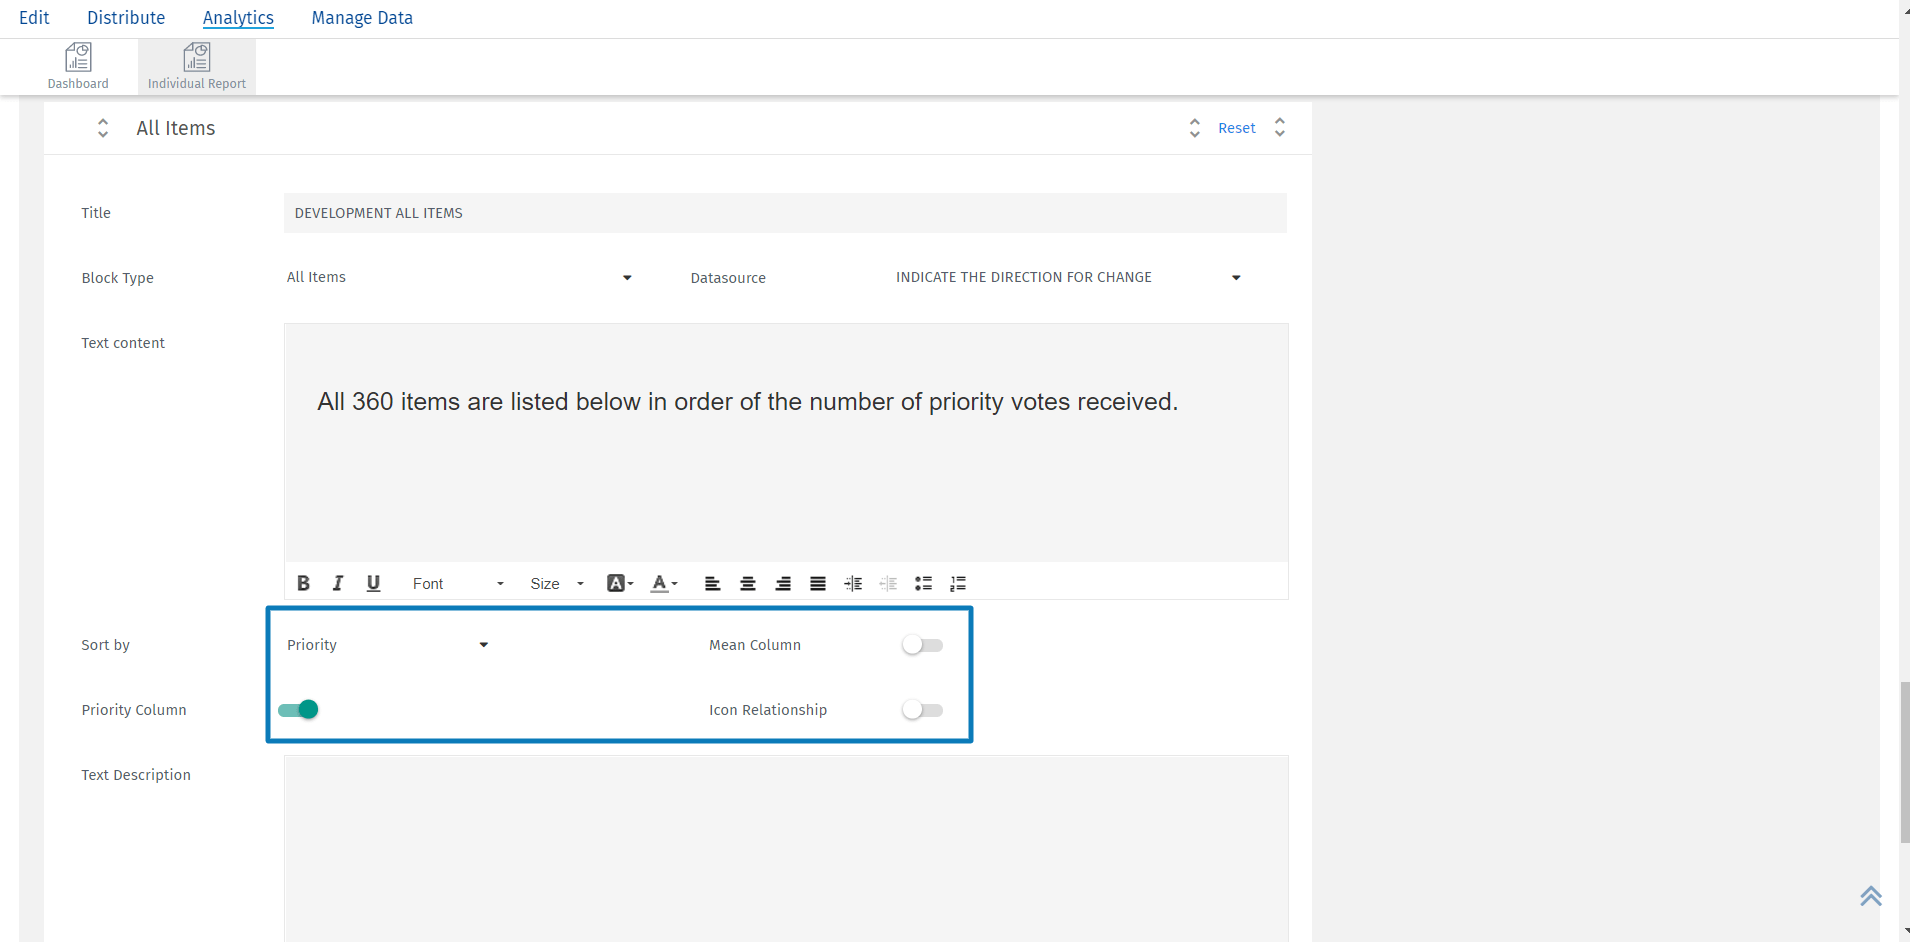
- Summary section will you to show the summary of the report with the priority behaviors and the results represented in the table for the selected top priority behaviors. You can enable the priority column and sort the table according to priority. And, you can also enable the mean column and show the mean values. You can select the number of top priorities to be displayed in the column and the preview will generate the PDF accordingly.
- You can enable the relationship icons to be displayed in the table to represent the data and enable the text description to add the content. For example, description to explain that icons indicates the relationships.
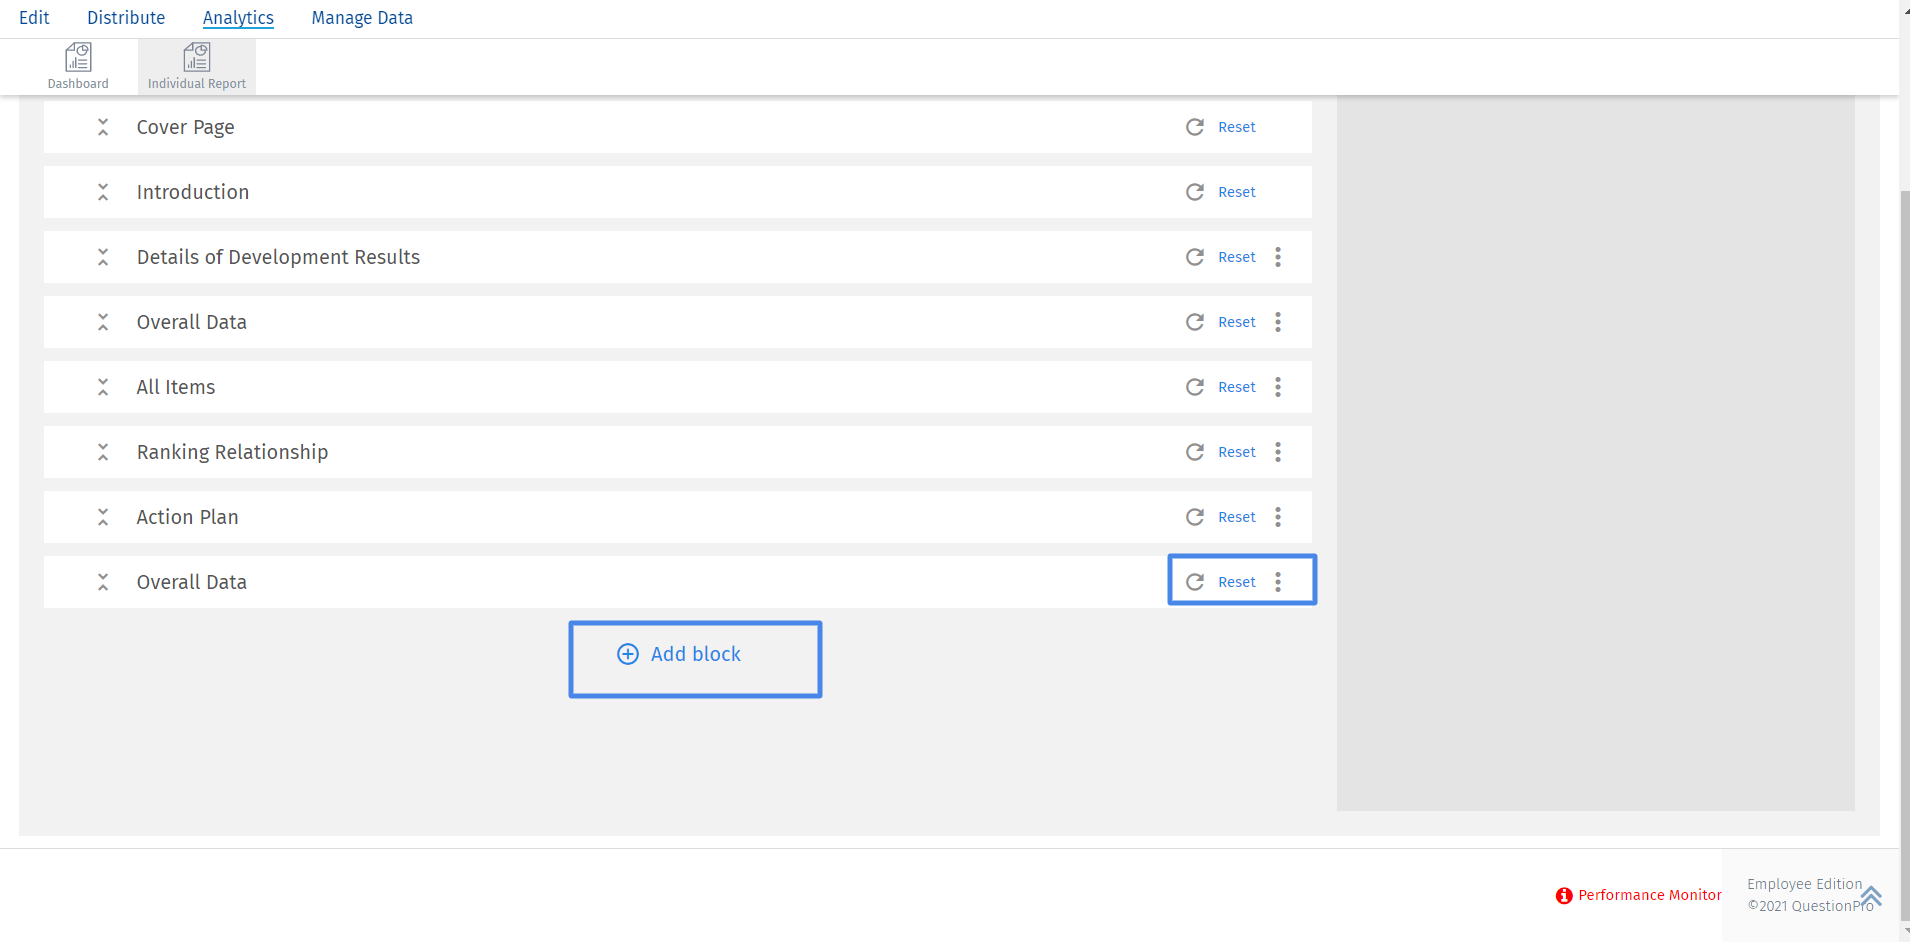
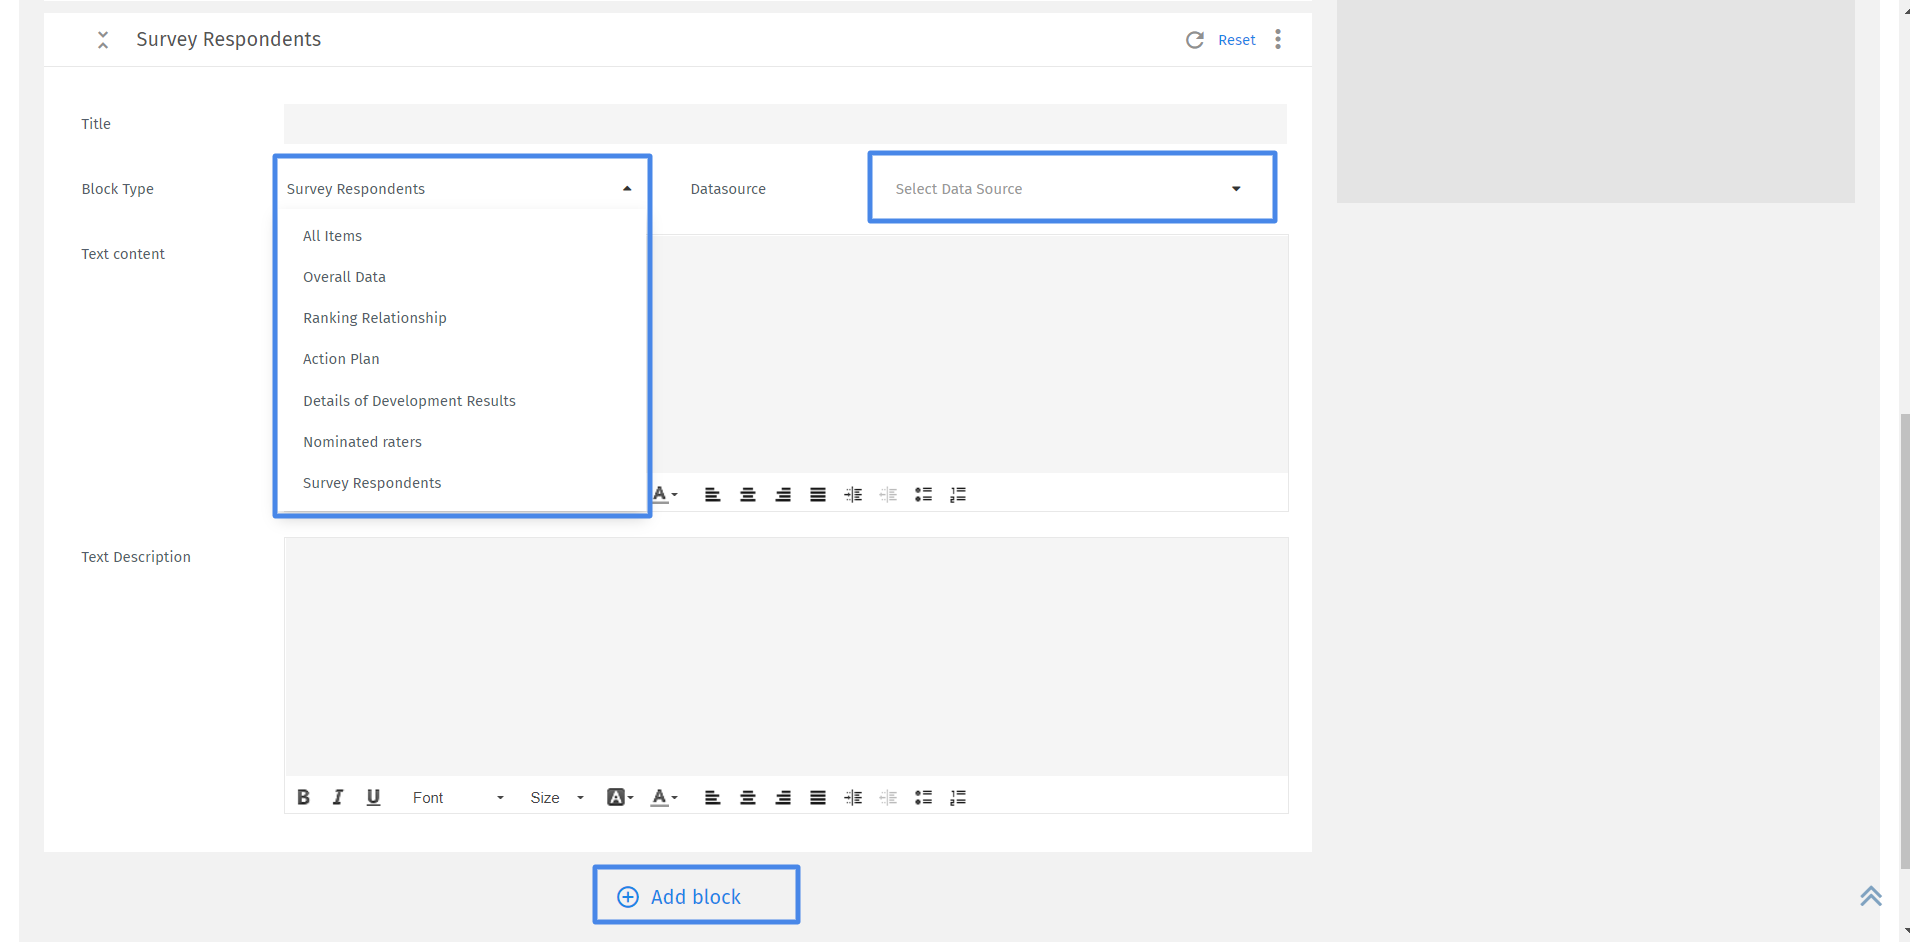
- You can create the Report using the default given section or create a custom one by adding a new block. Click on add new block and select the type of the block from the dropdown list. You can choose a blank page to create a custom section of your own in the reports. You can select the data source for the custom section to display the data and results in the reports.
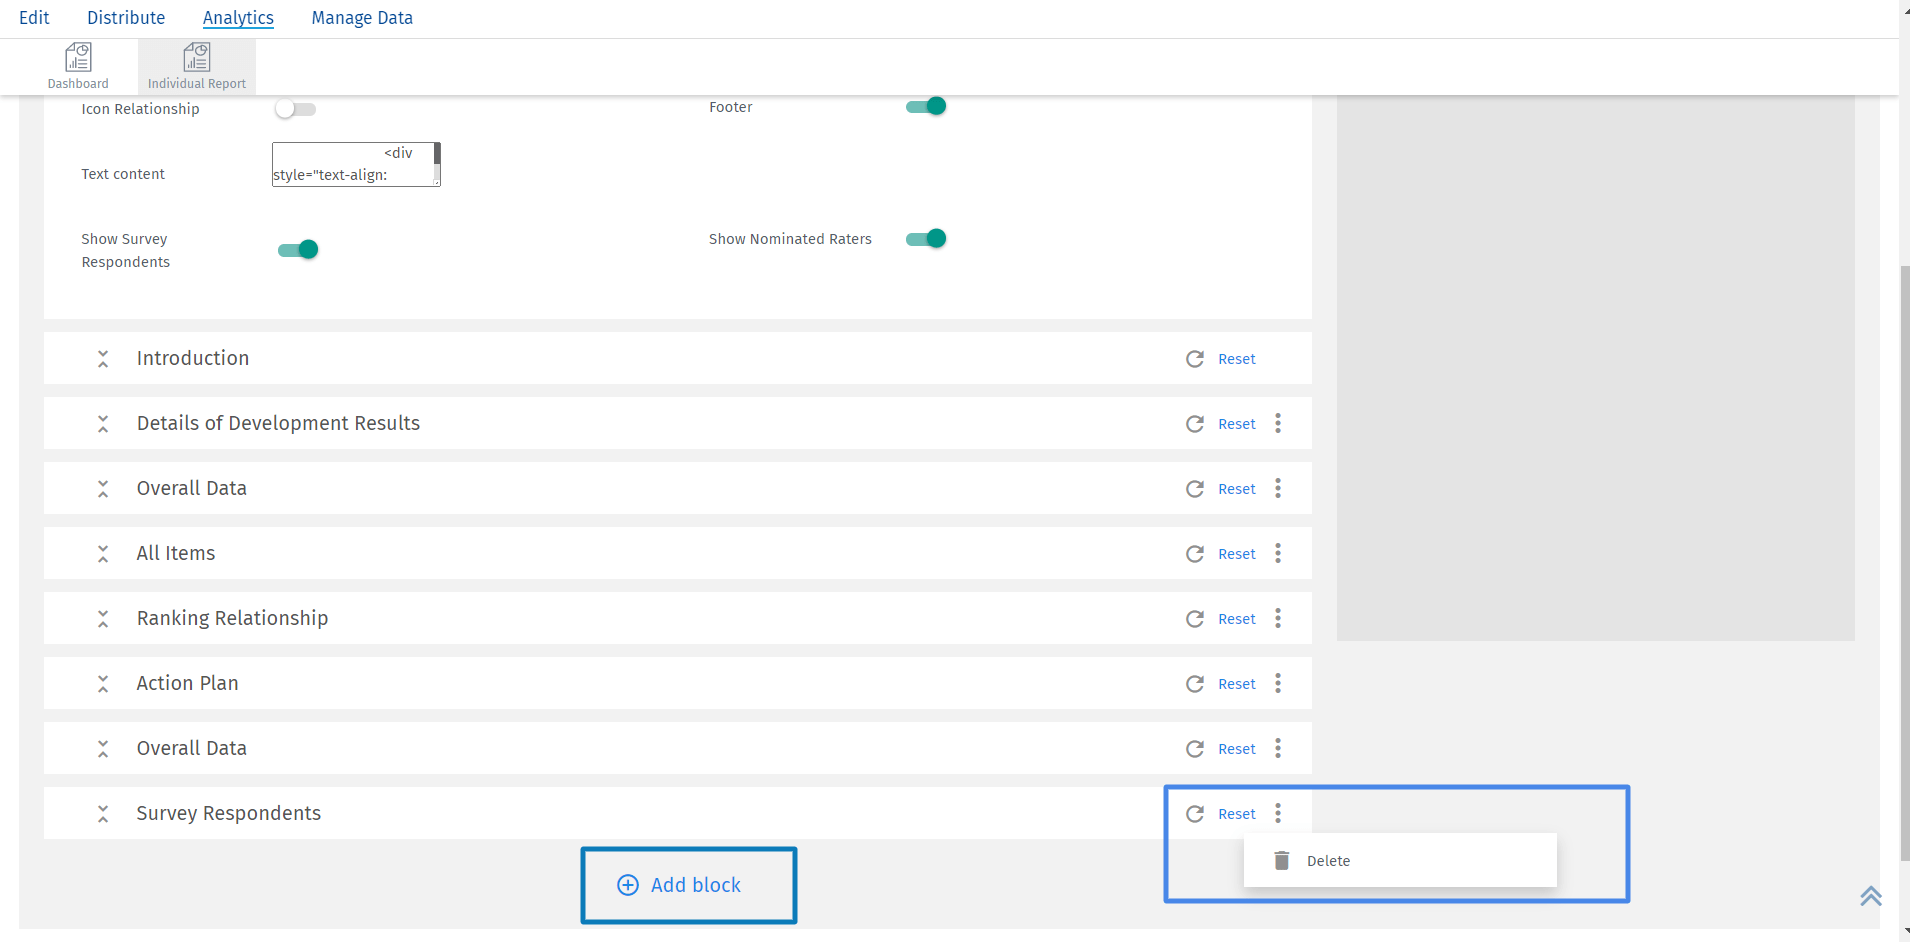
- All the custom sections can be re-ordered, deleted or disabled while generating the PDF of the reports.
You may also be interested in...

