

- Add widgets
- Survey Comparison
- Heatmap
- Anonymity Settings
- eNPS in Workforce Analytics Portal
- QxBot Assist in Workforce
- Notes Widget
- Text Analysis Widget
- Response rate
- Text Report
- Trend analysis widget
- Show/hide Markers and Building blocks
- Question Filter
- Single Question Widget
- Heatmap default
- Sentiment analysis
- Scorecard
- Driver analysis
- Scorecard: All options view
- Heatmap Custom Columns
- 360 feedback introductory text
- 360 feedback display configurations
- 360 feedback display labels
- Multi Level Priority Logic
- 360 Surveys- Priority Model
- 360 feedback - skip logic
- 360 feedback - show hide question logic
- 360 Survey Settings
- 360 feedback configuration
- Customize the validation text
- 360 Survey design
- 360-Reorder section
- 360 Section Type - Single Select Section
- 360 Delete Sections
- 360 Add Sections
- 360 section type - Free responses text section
- 360 Section Type - Presentations text section
- 360 Section-Edit Configurations
- 360 Survey- Languages
- Matrix section

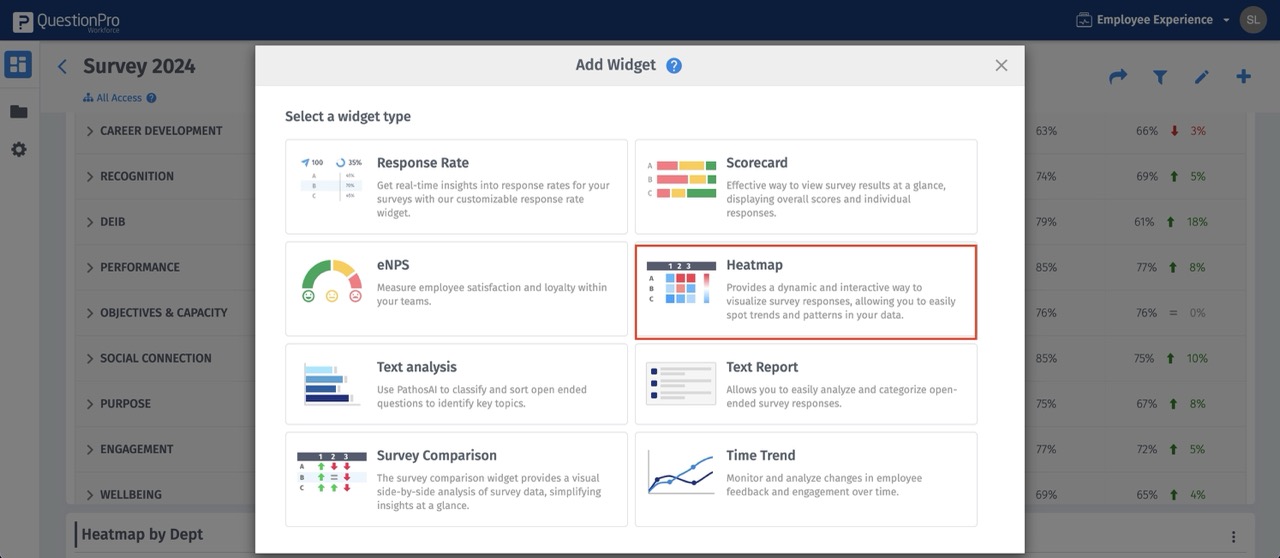
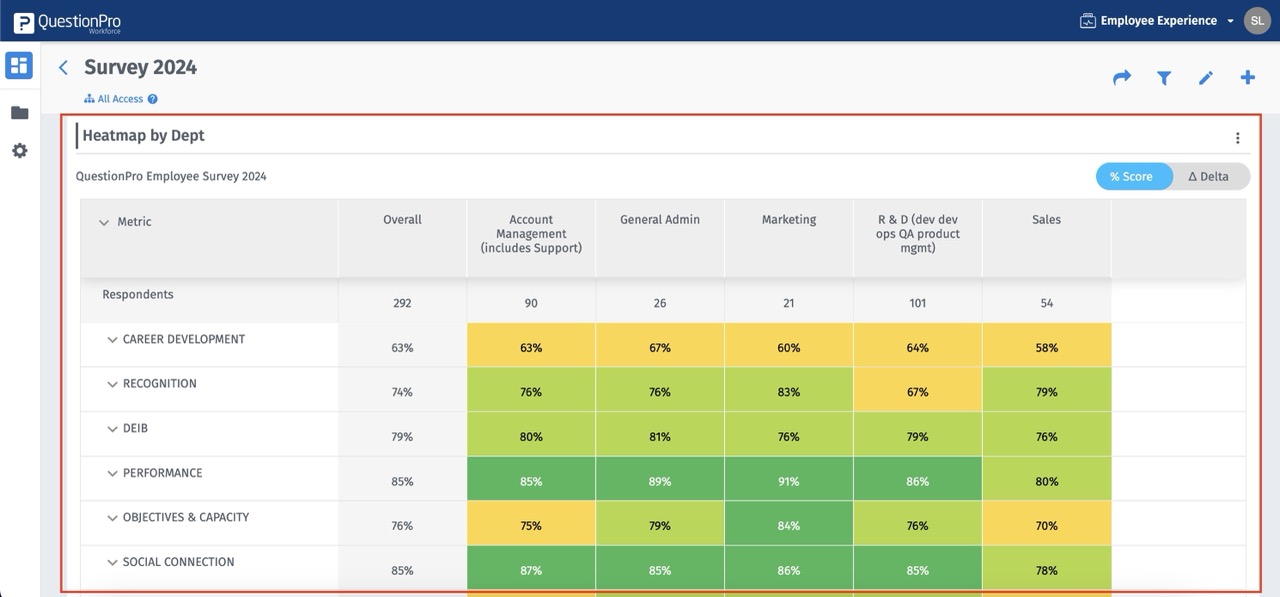
Workforce Heatmap Analysis
Heatmap widgets offer a clear visual representation of high and low points within your organization or across different demographic groups. They excel at highlighting comparisons and illustrating how various levels of a field perform across different items
Click to download video
Click to download video
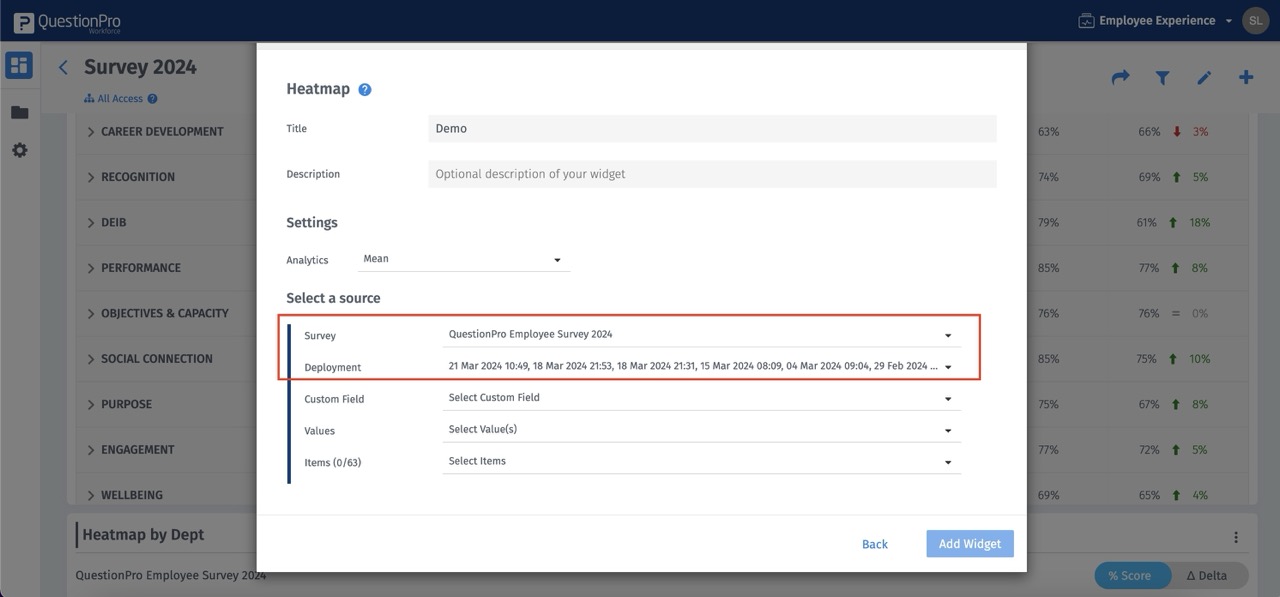
- For adding a new heatmap go to: Workforce Portal » Dashboard » Add Widget » Add New Heatmap
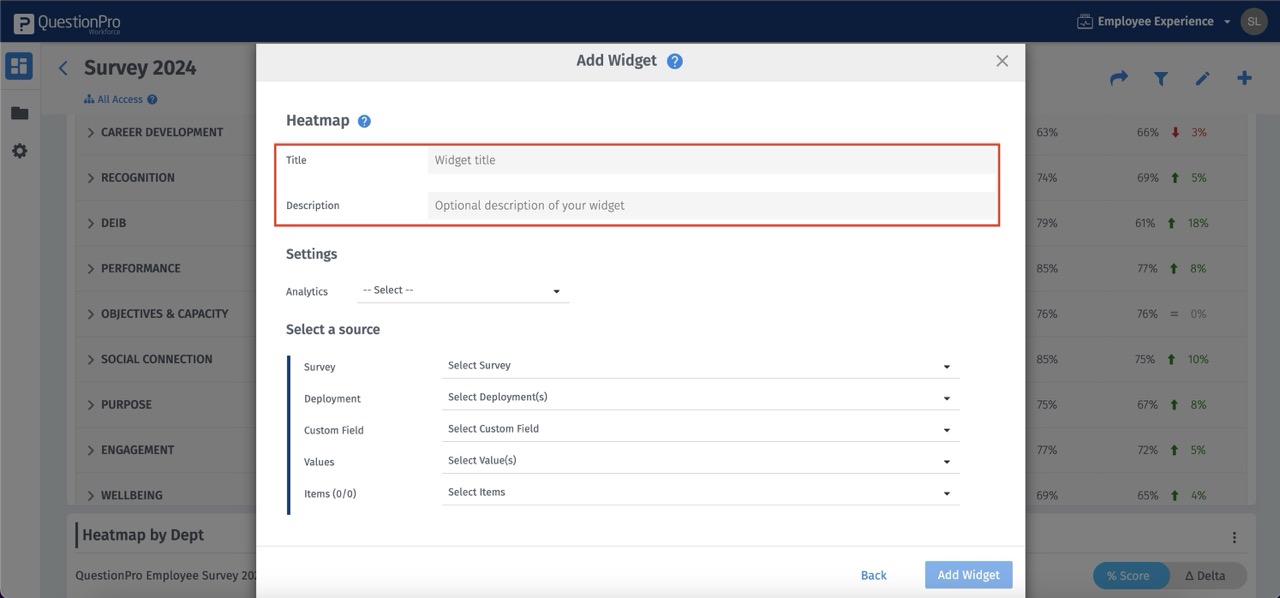
- Enter the below details to create a heatmap
- Enter title
- Enter description (Optional)
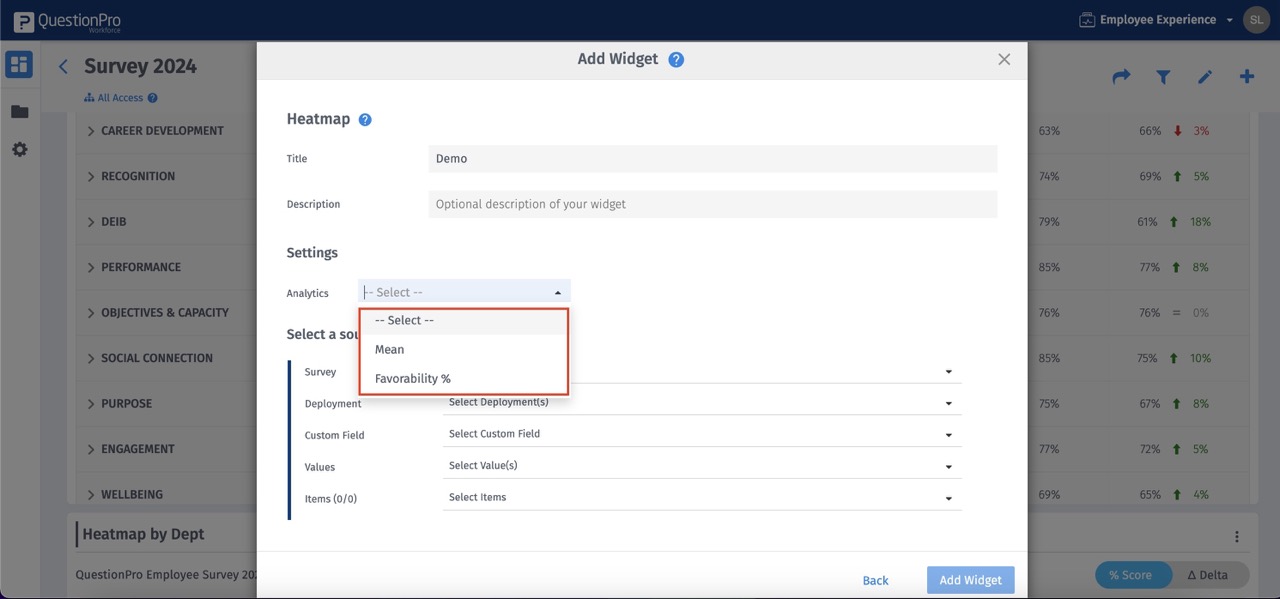
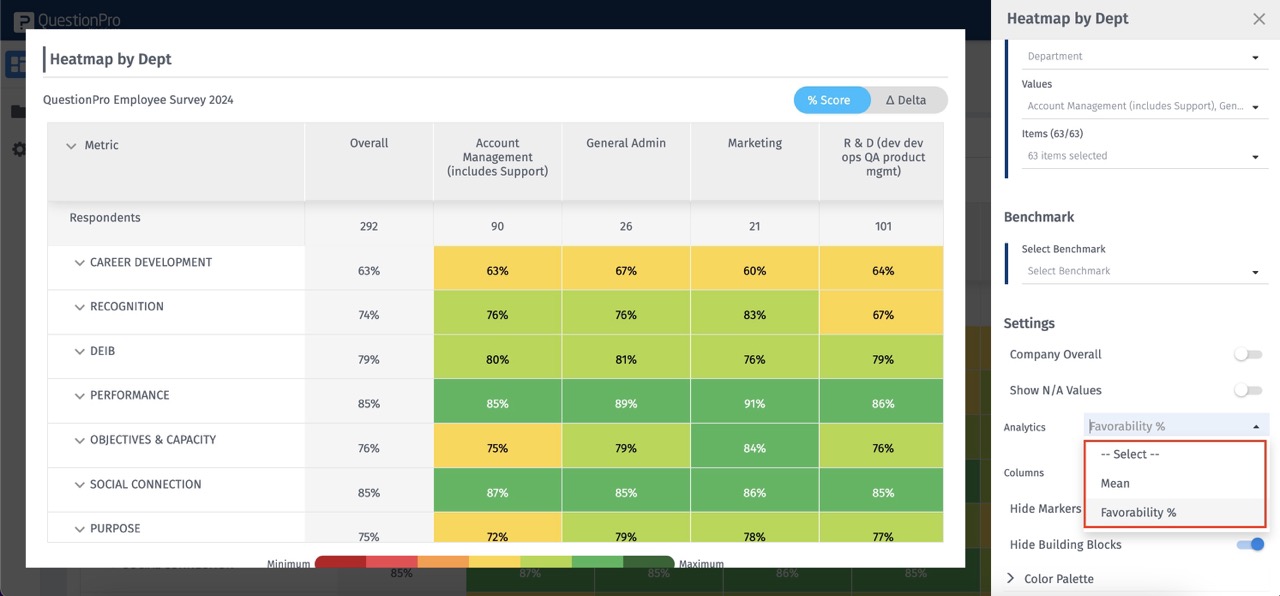
- Select mean or favourability from analytics
- Select Survey
- Select deployment
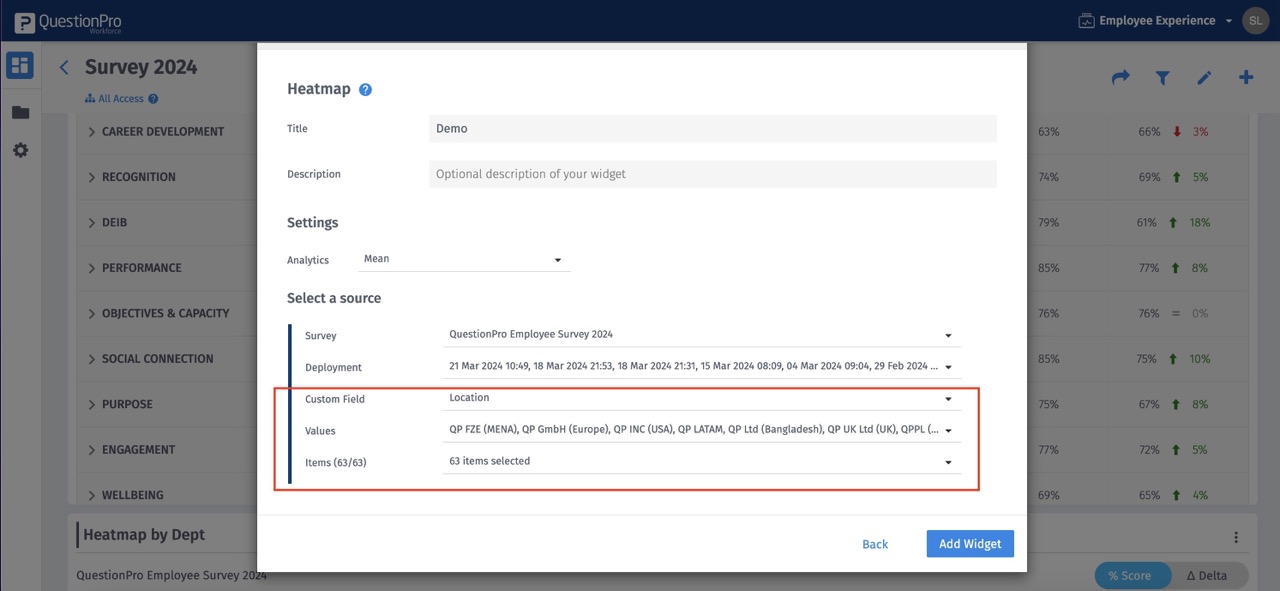
- Select custom fields and values
- Select the questions you need under items
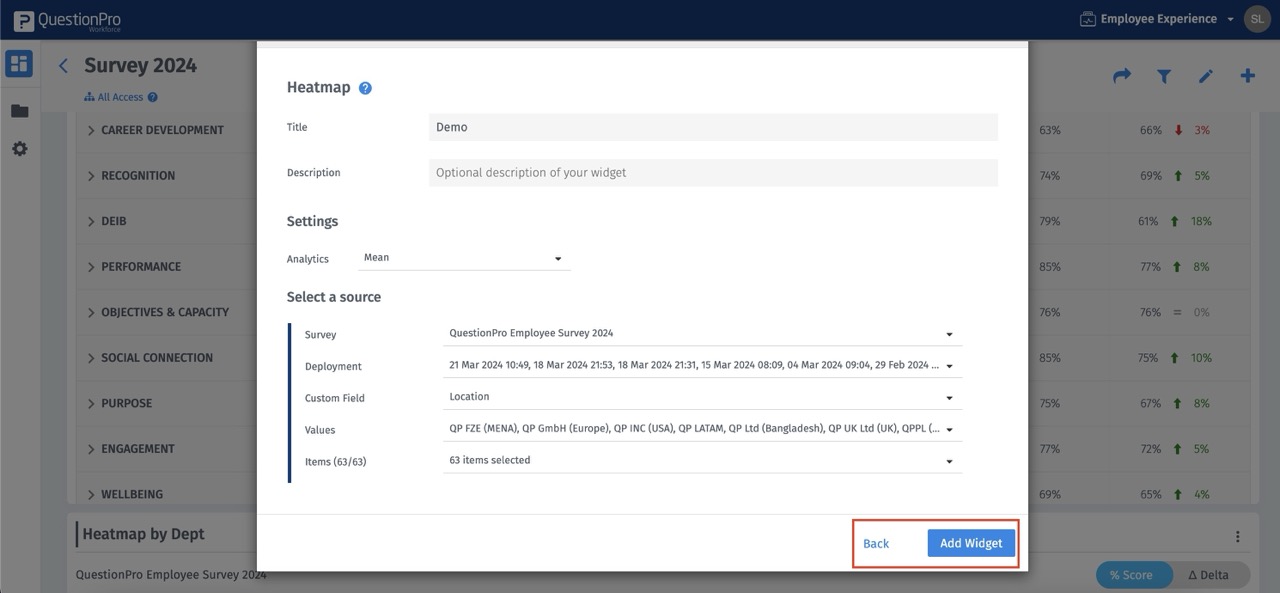
- Click on “add widget” to create widget or on “back" to void
- You will see a heatmap wil select custom fields and options
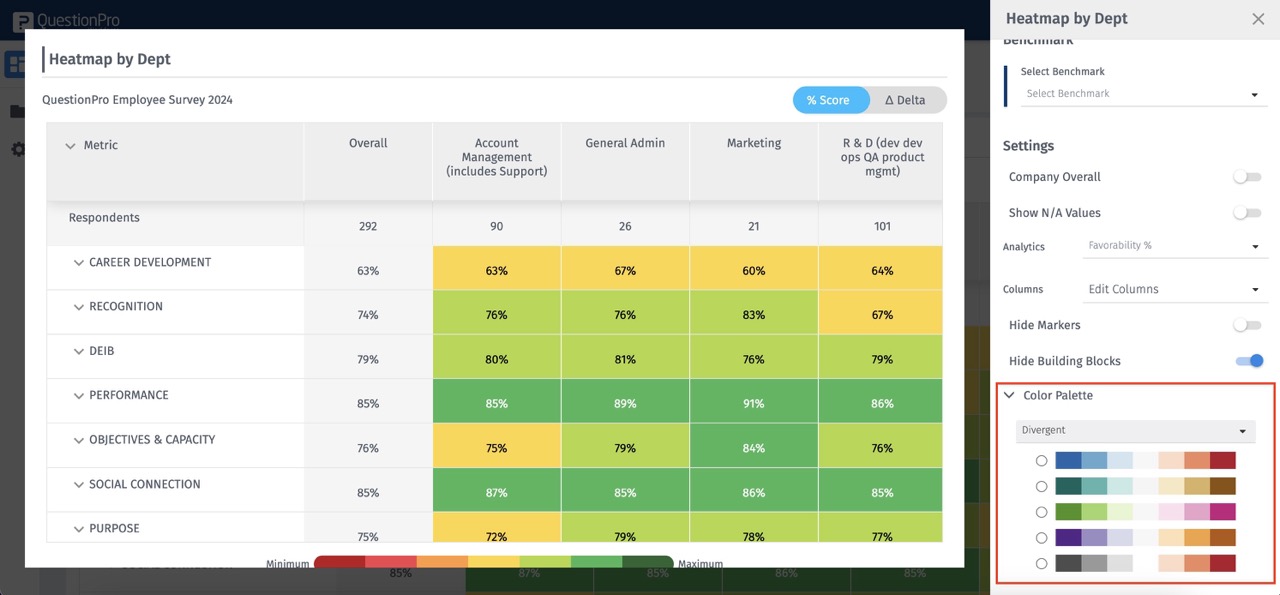
- To add more or change criteria to the widget, users can click on the three dots (kebab menu) in the widget and choose "Edit Widget."
- Add or change benchmark
- Enable or disable the Company overall toggle
- Change the analytics type
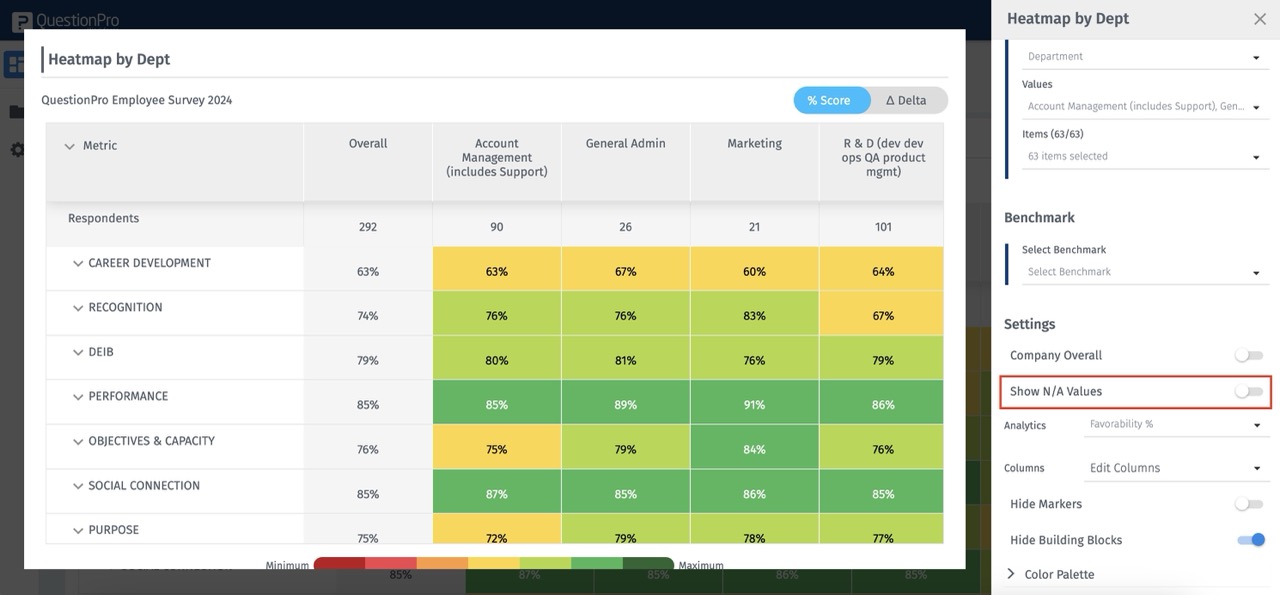
- Enable N/A value toggle if you want N/A values to be visible on heatmap
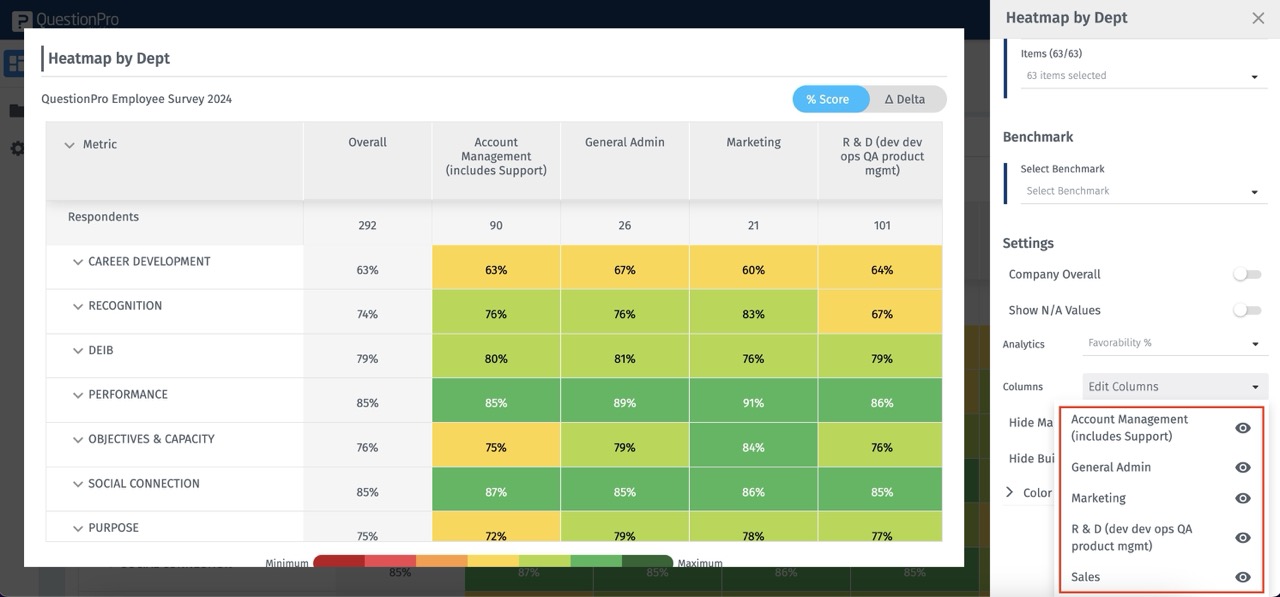
- Choose to hide or show between columns you selected
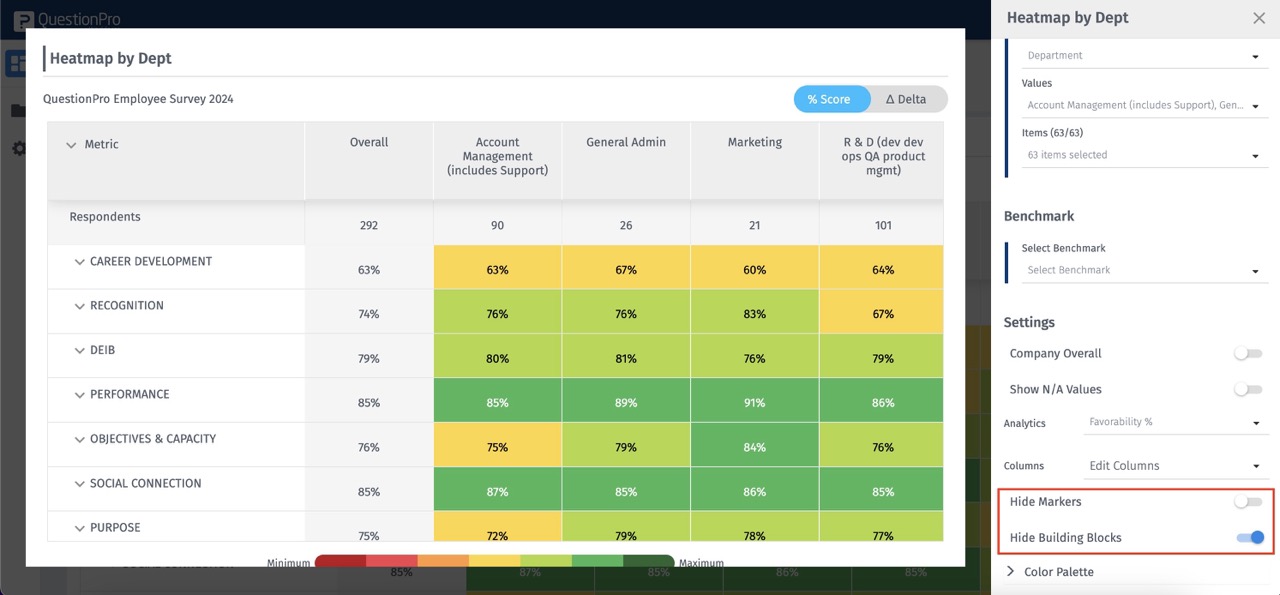
- Toggle to hide markers and building blocks
- Choose the colours from various available options
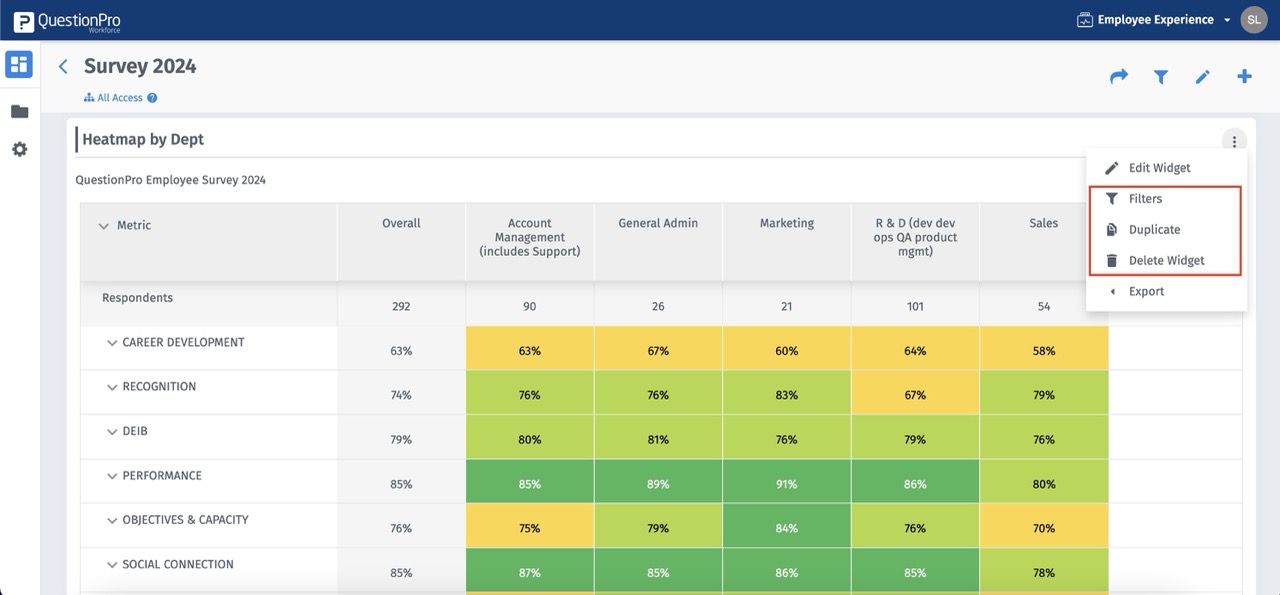
- To edit, duplicate, delete, or filter the widget, click on the three dots (kebab menu)
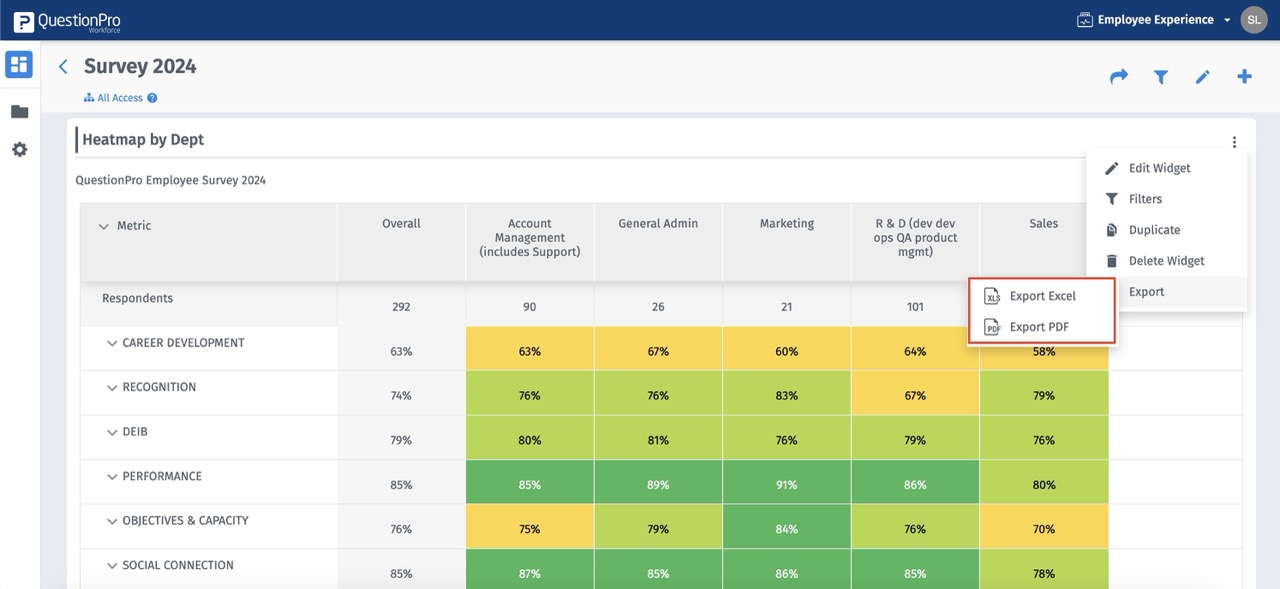
- Users can download the widget as an Excel file or PDF by selecting from the export option


New updates
You may also be interested in...
Google Apps integration
Office 365 integrations
SAML Integration
What is Workforce?