- Survey Comparison
- Heatmap
- Anonymity Settings
- eNPS in Workforce Analytics Portal
- QxBot Assist in Workforce
- Notes Widget
- Text Analysis Widget
- Response rate
- Text Report
- Trend analysis widget
- Show/hide Markers and Building blocks
- Question Filter
- Single Question Widget
- Heatmap default
- Sentiment analysis
- Scorecard
- Driver analysis
- 360 feedback introductory text
- 360 feedback display configurations
- 360 feedback display labels
- Multi Level Priority Logic
- 360 Surveys- Priority Model
- 360 feedback - skip logic
- 360 feedback - show hide question logic
- 360 Survey Settings
- 360 feedback configuration
- Customize the validation text
- 360 Survey design
- 360-Reorder section
- 360 Section Type - Single Select Section
- 360 Delete Sections
- 360 Add Sections
- 360 section type - Free responses text section
- 360 Section Type - Presentations text section
- 360 Section-Edit Configurations
- 360 Survey- Languages
- Matrix section
Analytics 2.0
Analytics 2.0 will be an updated version that will be in sync with new framework structure created for Workforce. This will give the dashboard user drill down capability to see the results grouped as markers, building blocks and measure
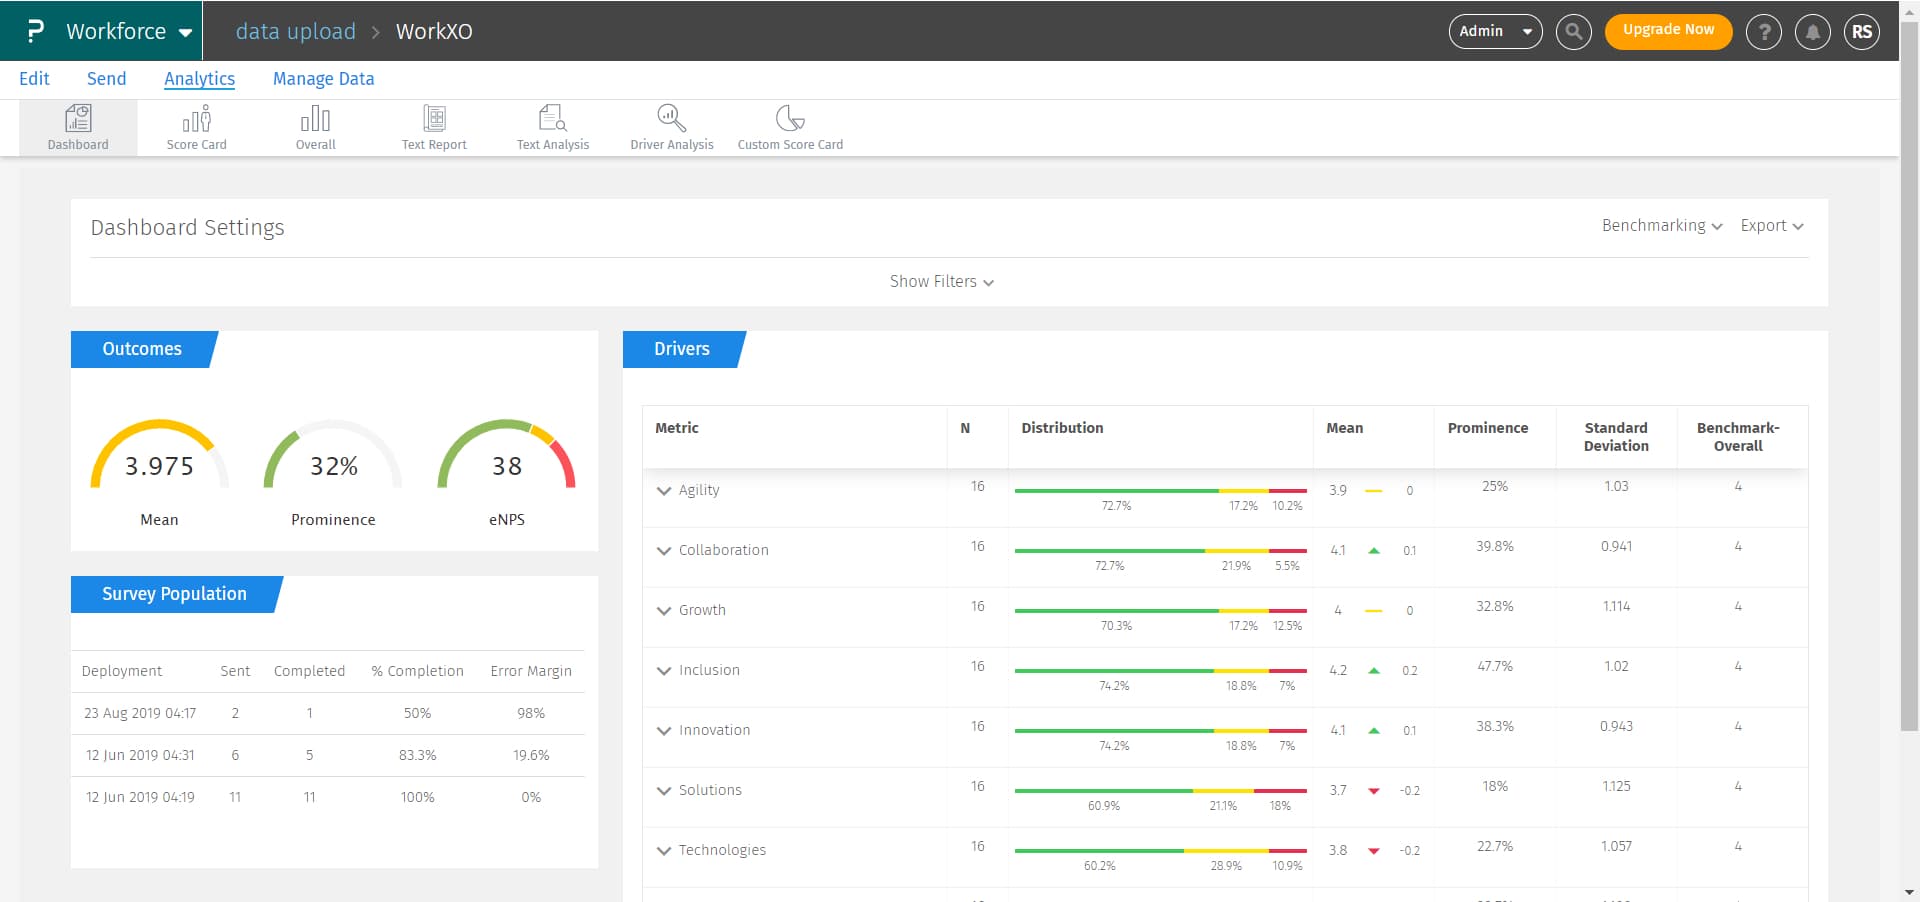
Workforce dashboard will consist of Outcome, Drivers and Survey Population.
Outcome will have results of enagagement marker. This will consist of overall organization score, eNPS, Prominence, Sentiment, Discretionary and Intent to Join/Stay based on the selection of the mesures while creating the survey from framework.
Drivers will include the analytics of all the measure grouped in building blocks and marker. Analytics for drivers will consist of prominence (percentage score of 5 minus percentage score of 2 and 1 scores), distribution of agreement percentage, mean, standard deviation and overall score against each marker, building block and measures. You can expand and collaspe the marker, building block to view the analytics at measure level.
Survey Population will show the number of deployments made along with the number of employees to whom the survey was send, completion percentage and margin of error. User can also apply filters on the defined custom field(role, department etc.)

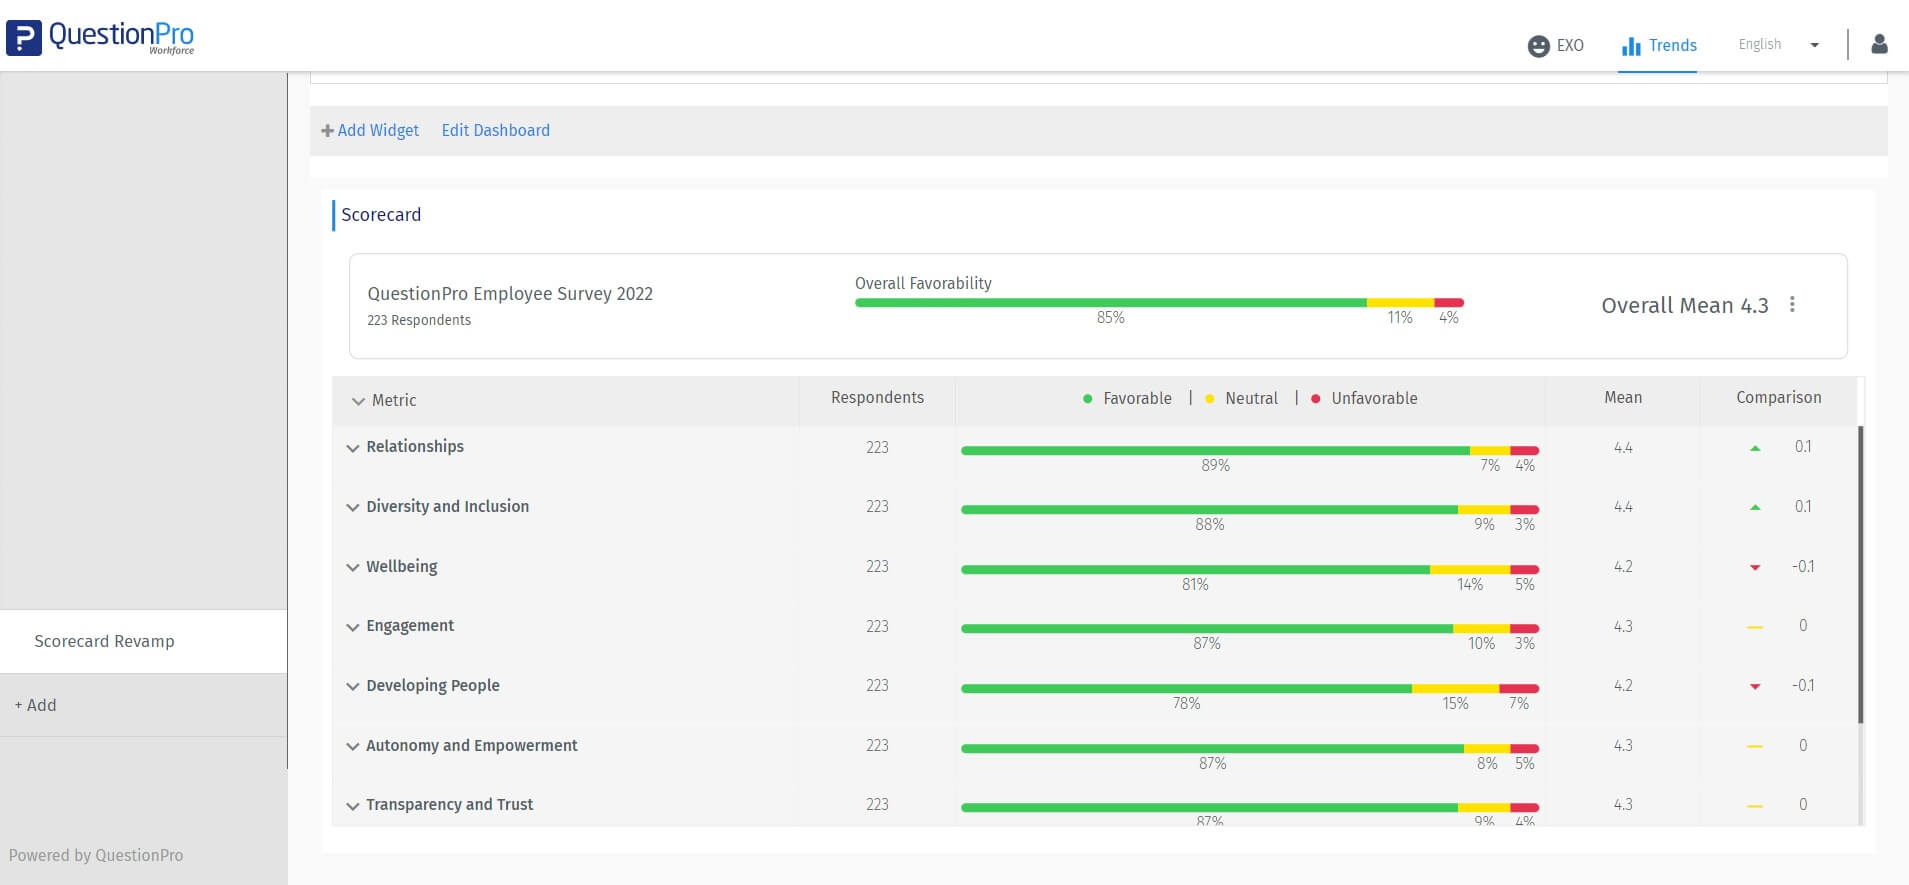
Scorecard is expanded view of drivers with all the marker, building block and measures. It will consist of prominence, distribution of agreement percentage, mean, standard deviation and overall score against each marker, building block and measures. You can also apply filters on the scorecard.

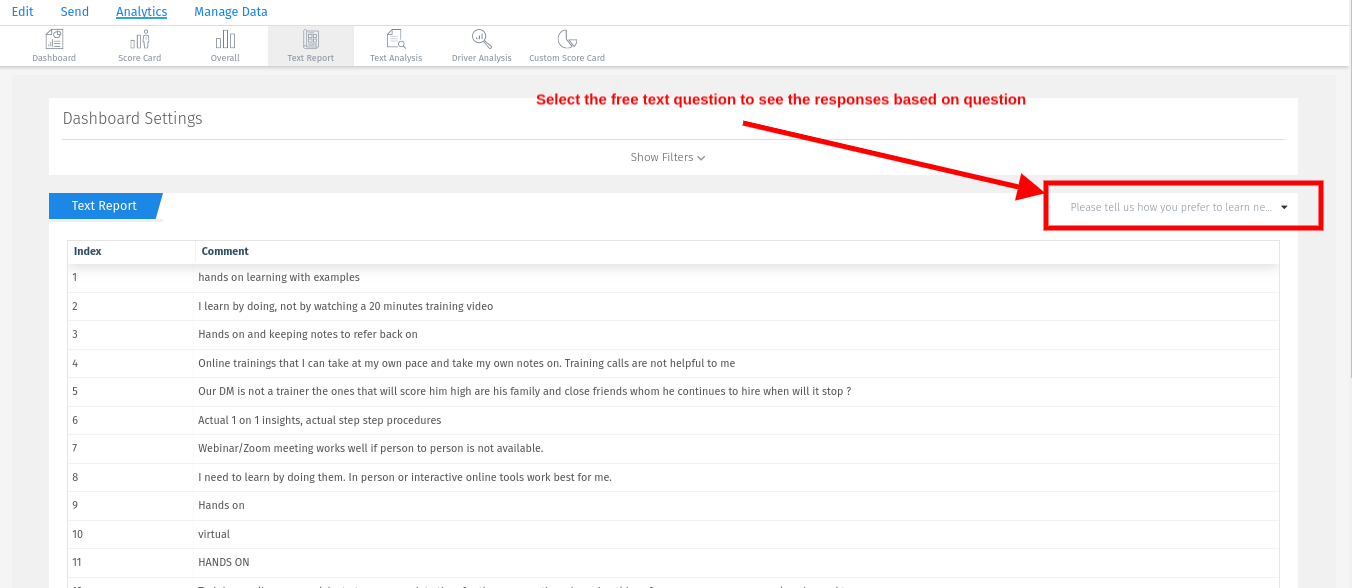
Text report is the reporting for all free text questions available in survey, by default one question is selected, and user can change the question from dropdown to see the responses for this question. You can also apply filters on the Text Report.

Yes, you can add filters on the employee fields created in the application. You can add the employee fields that you want to filter and select single or multiple values in the filter.


