
- Custom Variable Widget
- Priority Matrix
- Heatmap Widget
- Grid Widget
- Weighted mean widget
- Comment List widget
- Widget Filters
- Ranking List Widget
- Distribution Chart
- NPS Widget
- Trend Widget
- Word Cloud Widget
- Cross tab widget
- KPI Comparison Widget
- Bubble chart
- Custom Metric Trend Chart
- Trend Comparison Widget
Disposition Metrics
When creating a customer experience program, it’s important to track how well you are able to reach and engage your customers along the customer journey.Few ways are through email, SMS etc. Monitoring these channels on a continual basis will provide valuable data at every engagement point and will help track any changes to customer behavior along the way.
To view, go to: Customer Experience » Workspace » Deploy » Distribute » Disposition Metrics
Here is a glimpse of disposition metrics:
 Click to download video
- Transactions - Total number of transactions
- Sent - Total number of transactions sent
- Unsent - Total number of transactions that were not sent. The Unsent transactions are further categorised into
- Preprocessing - If there are server side errors, then those transactions are categorised under pre-processing.
- Skipped - The transactions that are skipped in delivery. Generally when resting period is added but due to some issue, it gets skipped, those transactions fall under the skipped category.
- Excluded - The transactions that are excluded. Generally when exclude rules are configured, so due to this transactions are not delivered, those fall under the Excluded catrgory.
- Error - If there are errors in delivery due to server or client side issues, those transactions are counted in the error category.
- Unsubscribed - If a customer has subscribed to a mailing list and they receive the email etc for the first time but after that, the customer unsubscribes so no new transactions will be delivered, the state of such transactions will be unsubscribed.
- Bounced - Total number of transactions that bounced
- Completed - Total number of transactions that were completed.
Each of the above metrics can be further drilled down into details like email address, name, phone number,transport mode and if there is any error then reason for it.
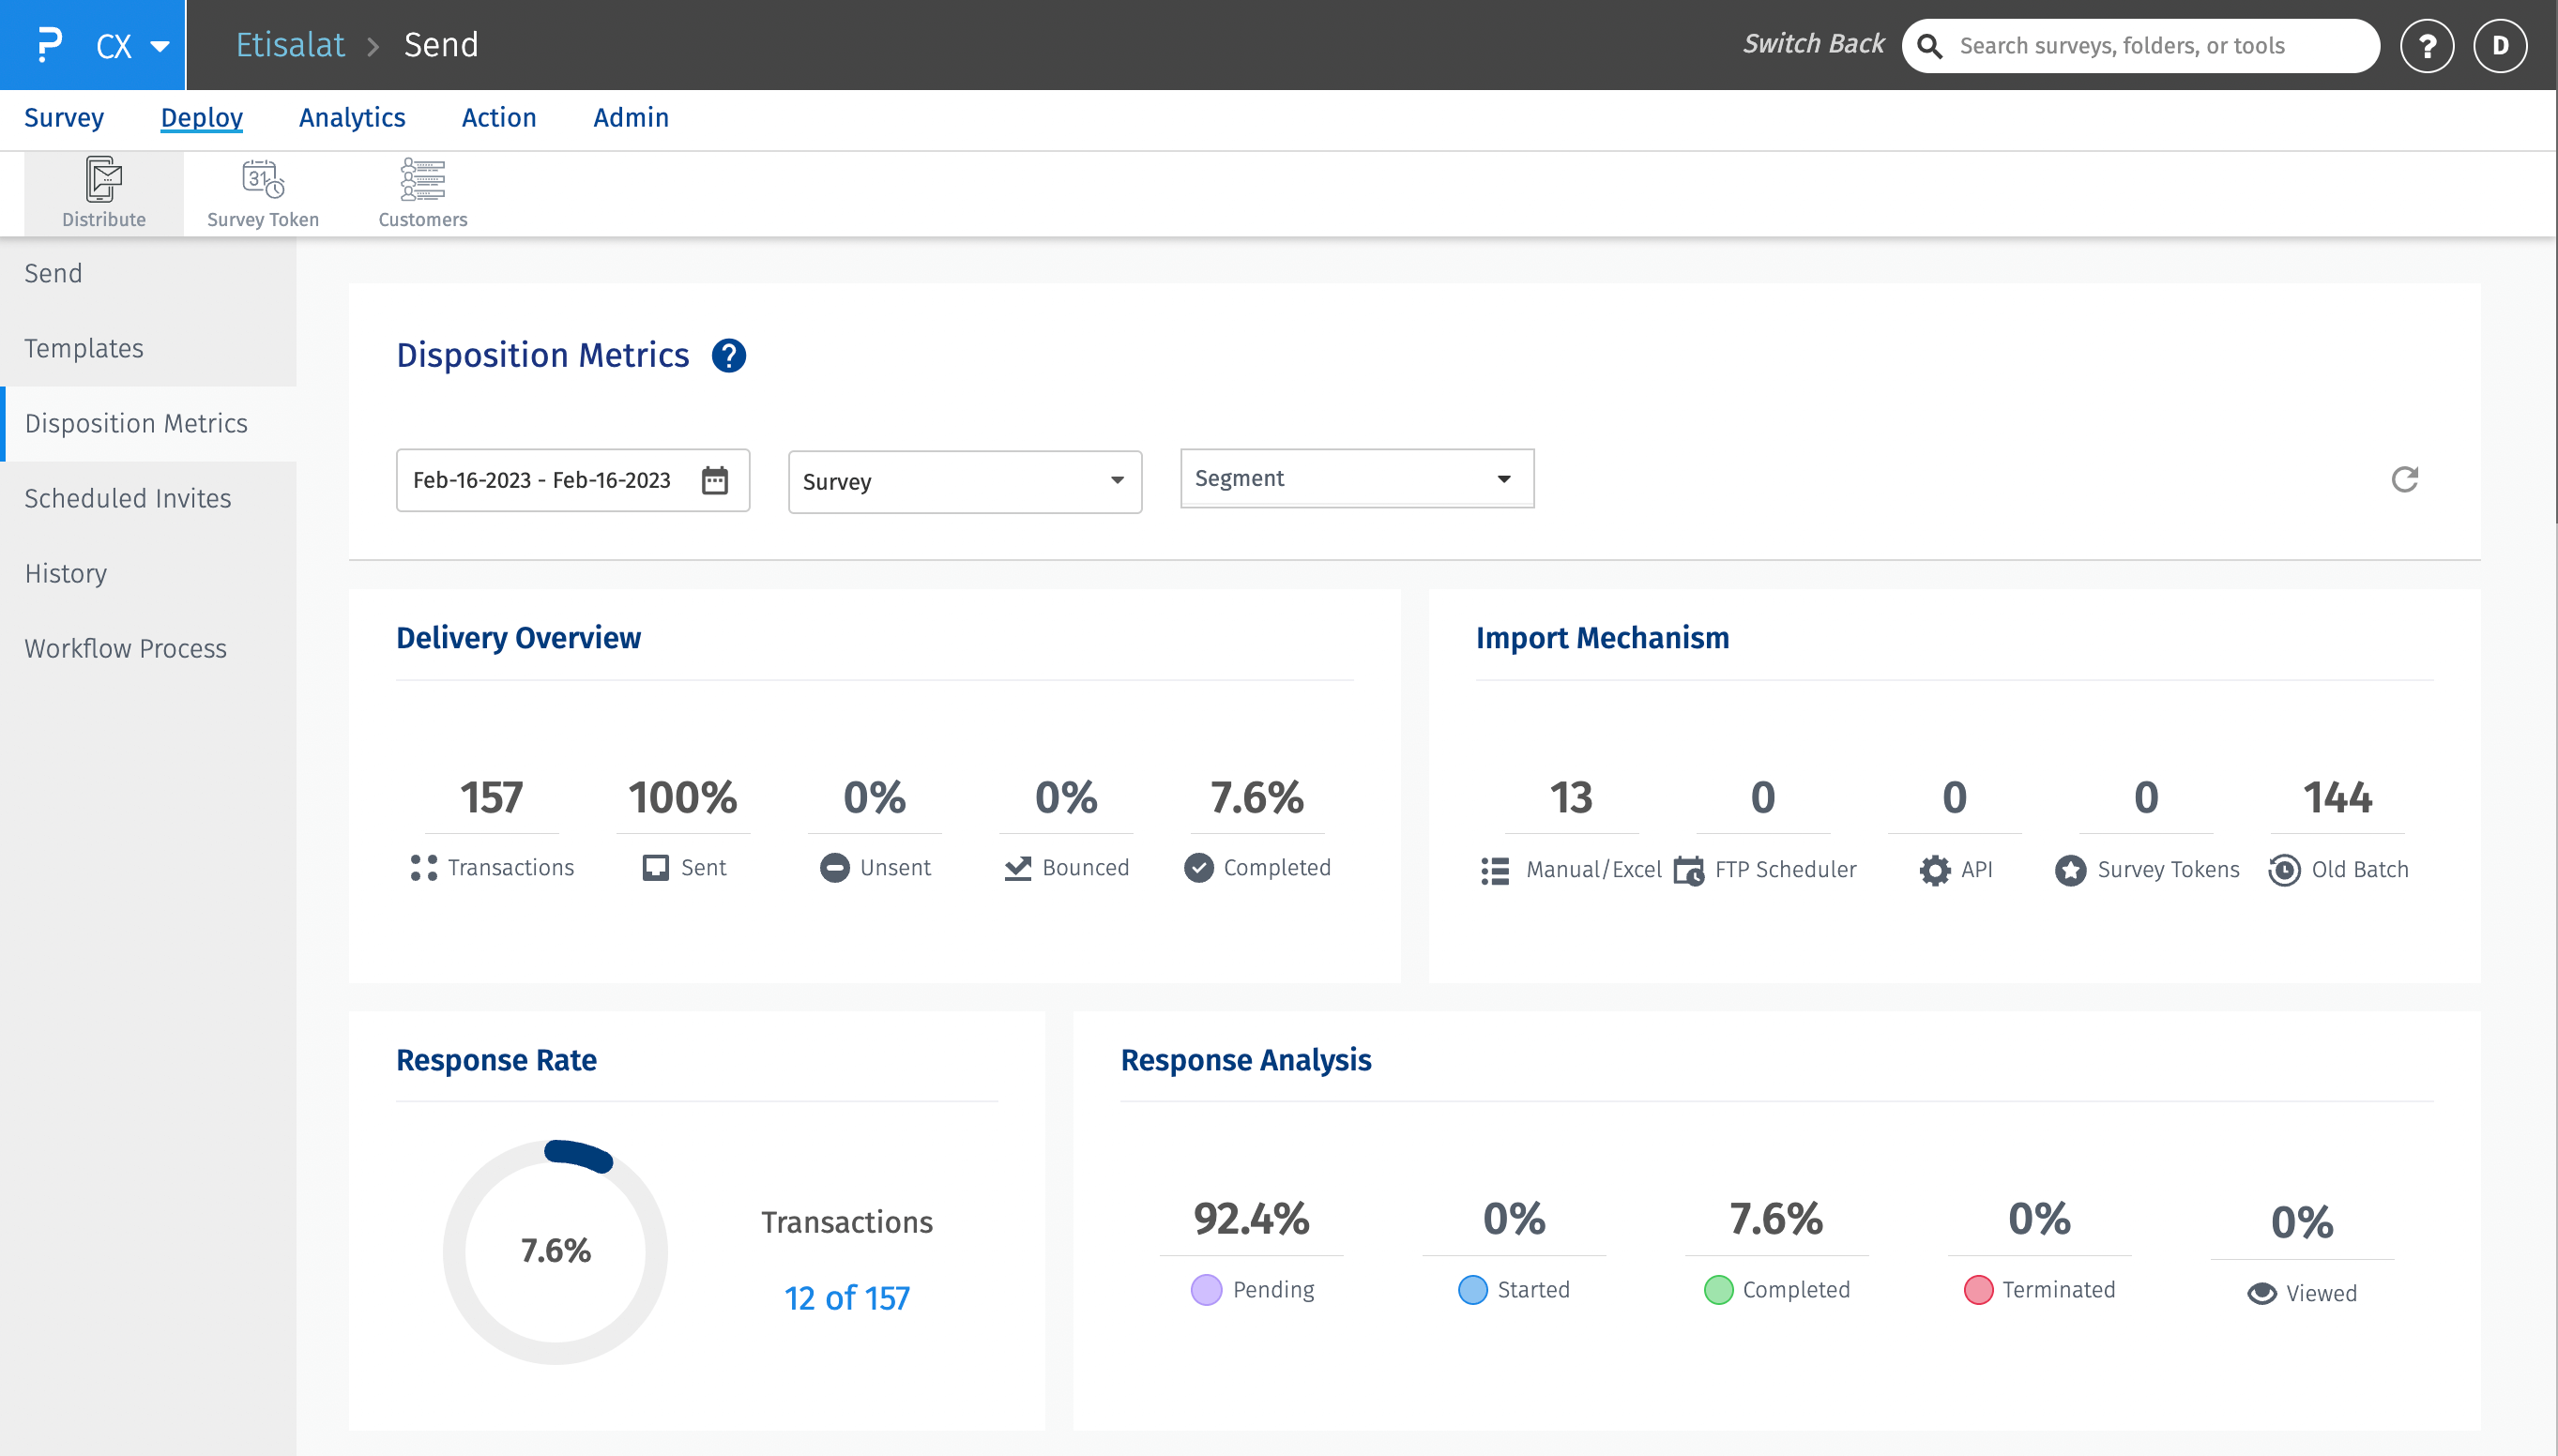
- Manual/Excel - Total number of transactions uploaded manually or using excel files.
- FTP scheduler - Total number of transactions uploaded using FTP scheduler
- API - Total number of transactions uploaded using APIs
- Survey token - Total number of transactions uploaded using survey tokens
- Old Batch - Total number of transactions uploaded using old batch which includes Get Survey Url(V1). Also, in the previous version of disposition metrics, there was no distinction between Manual, Excel, and FTP. So those transactions uploaded before moving to the new disposition metrics are also part of this. Responses imported before migrating to the new disposition metrics.
Each of the above metrics can be further drilled down into details like email address, name, phone number,transport mode and if there is any error then reason for it.

- Pending - The percentage of responses that are pending. The default state of the response is pending. Generally when transactions are deployed, the response state is set to pending.
- Started - The percentage of responses that were started
- Completed - The percentage of responses that were completed
- Terminated - The percentage of responses that were terminated. This includes reponses which were terminated due to Timer configured on the survey, if survey terminate condition is hit.
- Viewed - The percentage of responses that were viewed.
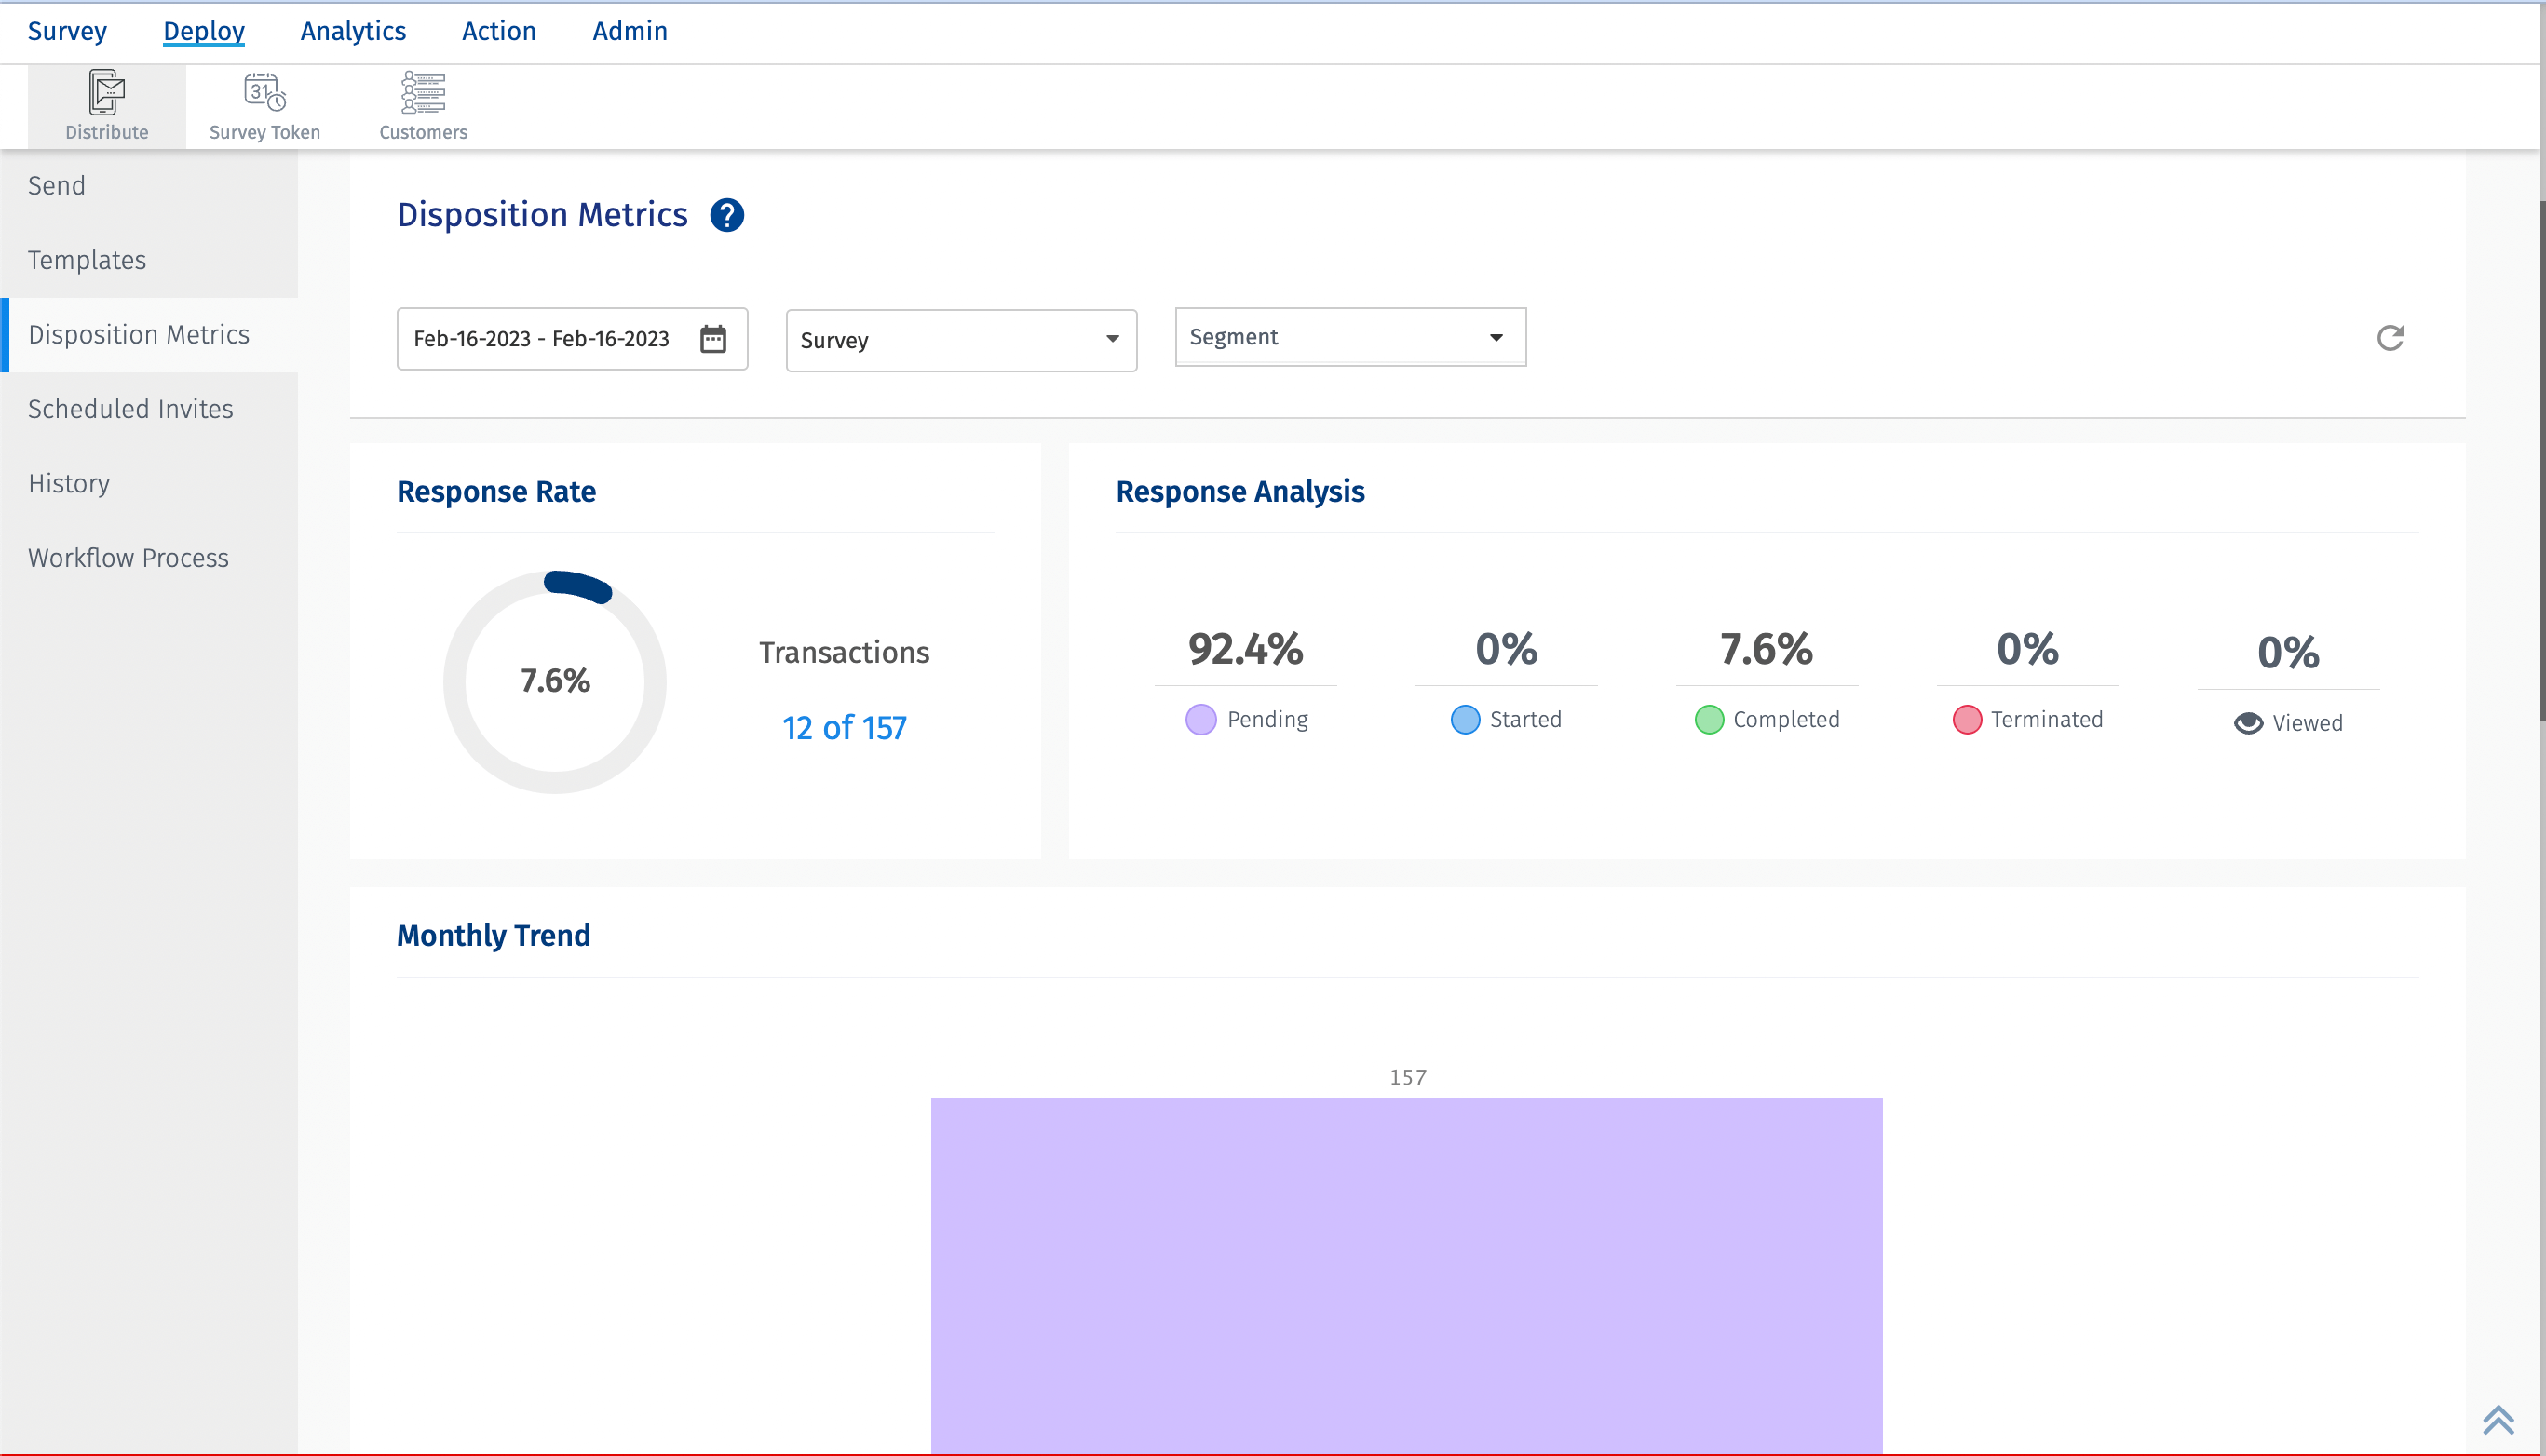
The monthly trend chart the response trend in terms of pending, completed, unsubscribed, terminated, bounced and unsent. The X-axis is the date and Y-axis shows the count.
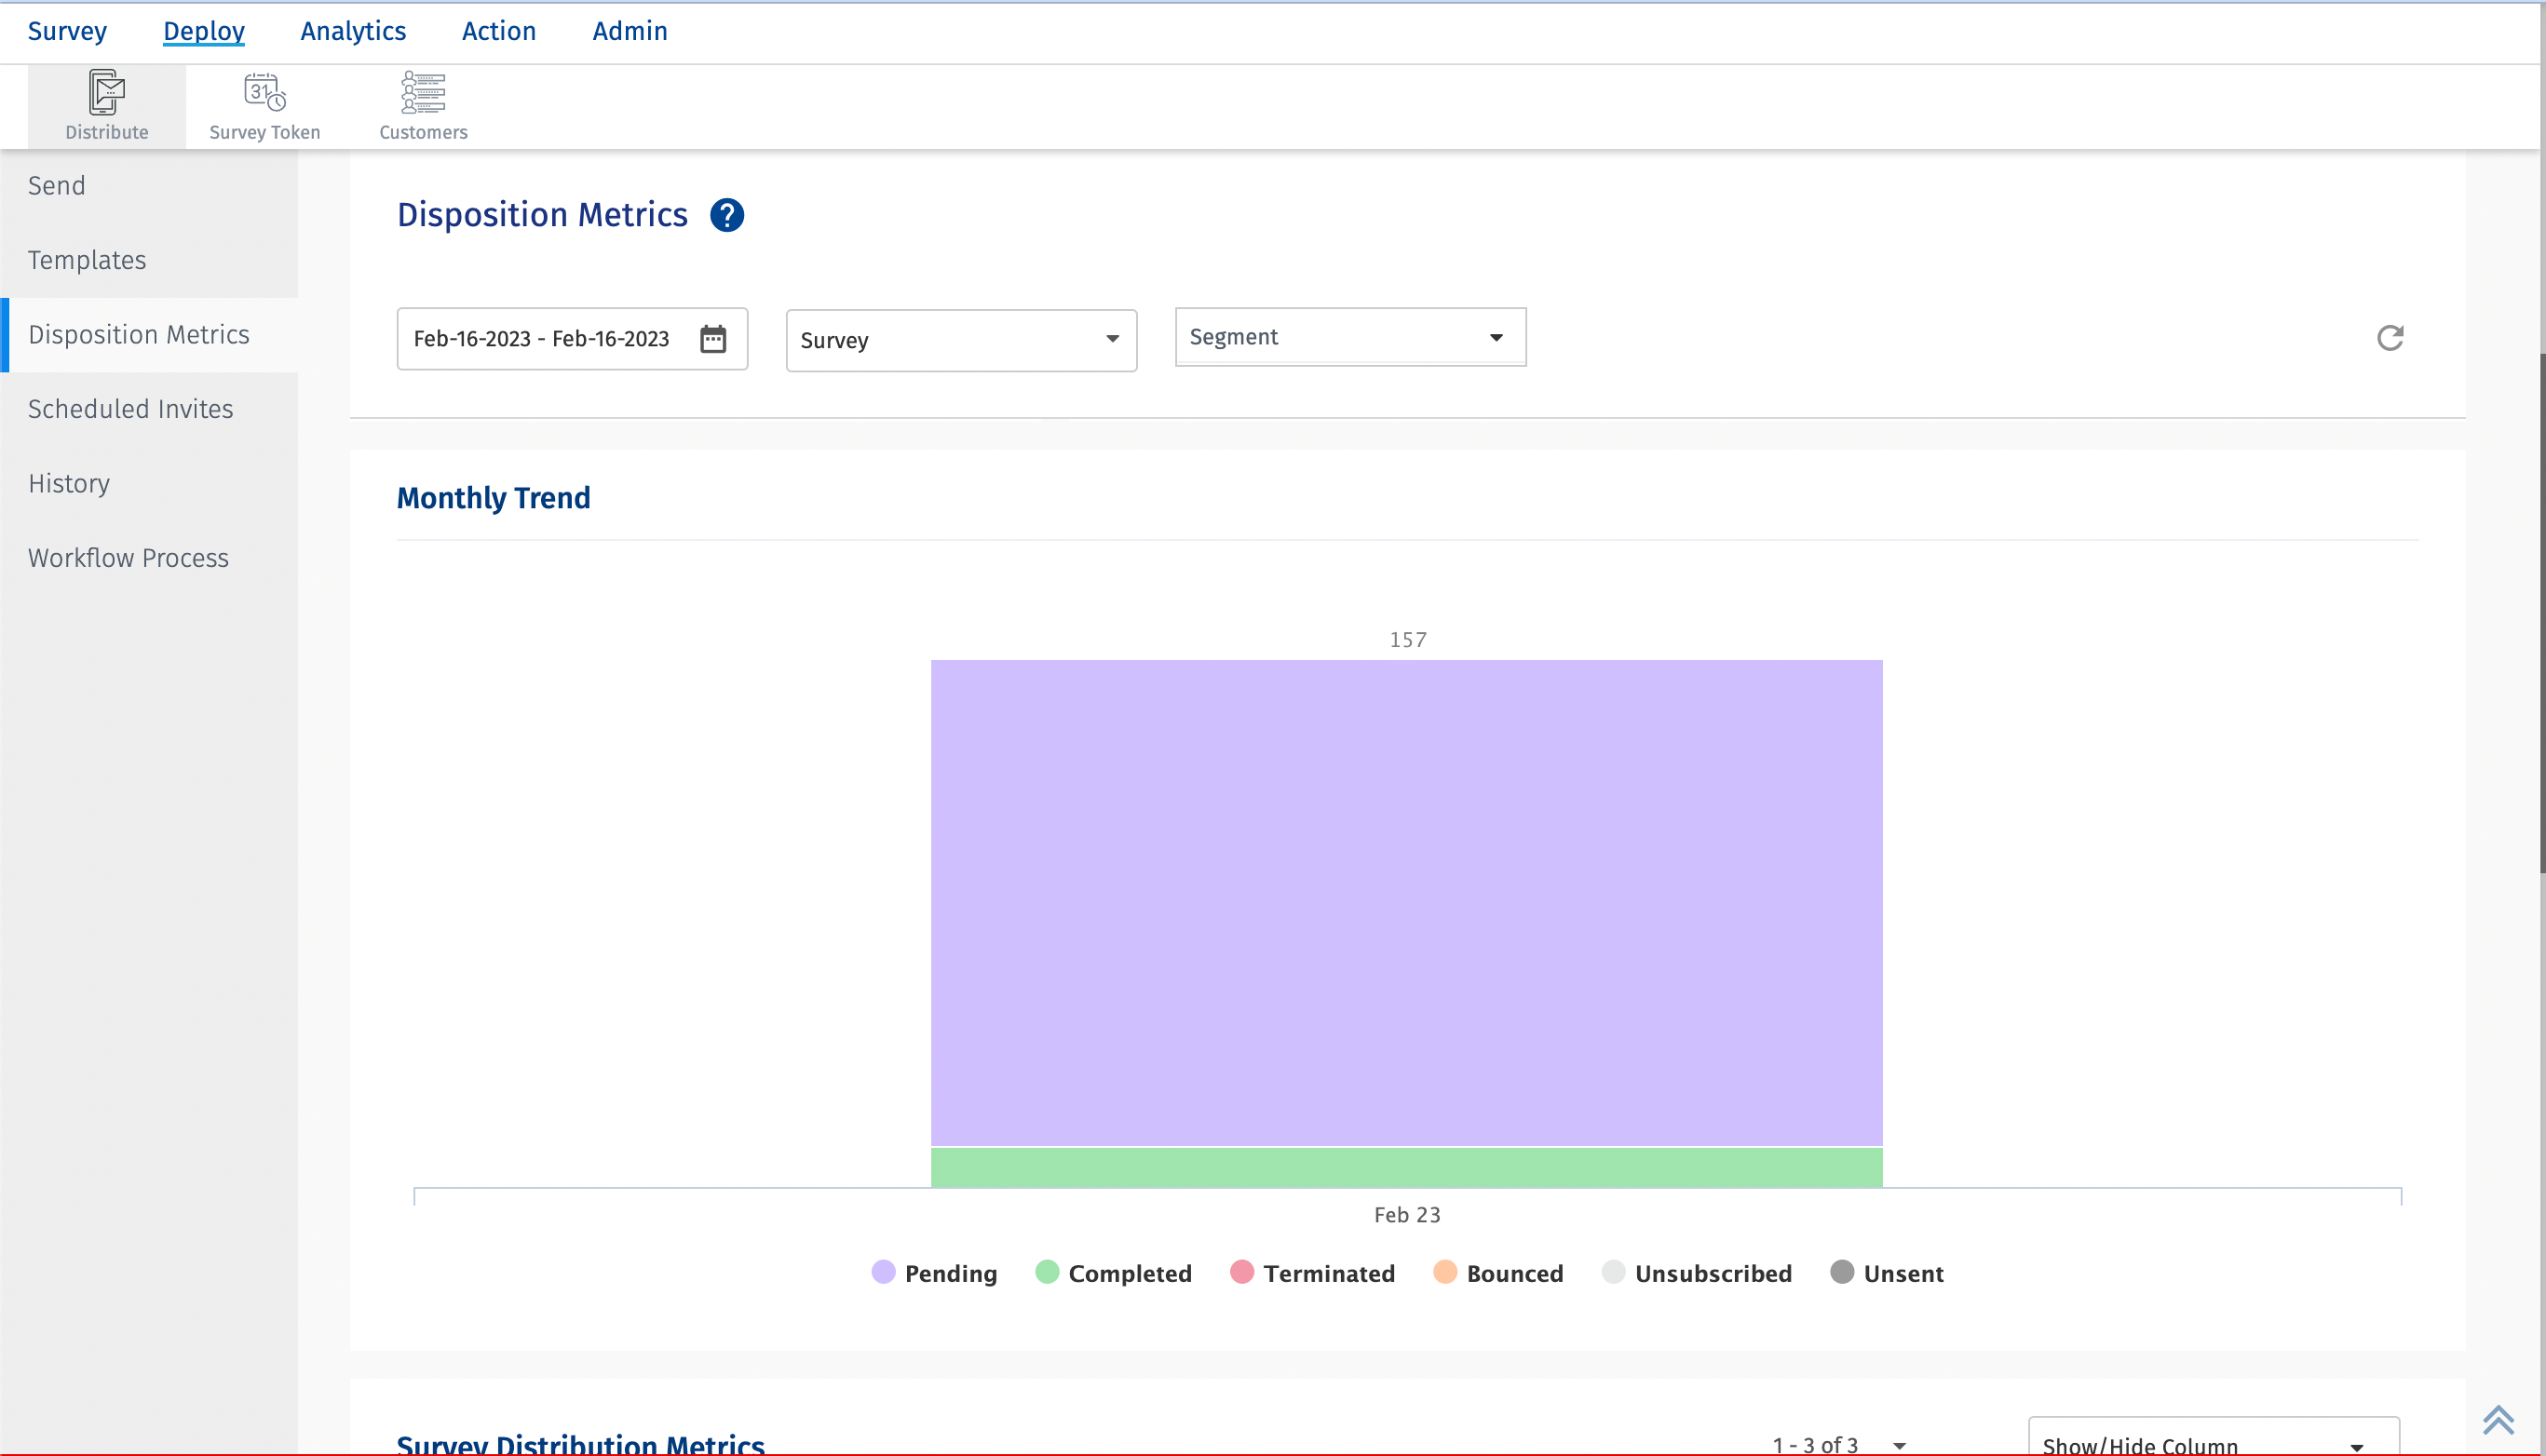
The survey distribution metrics shows the total number of transactions and further bifurcates them into following types at survey level.
- Sent - The total number of transactions that were sent successfully.
- Completed - The total number of transactions that were completed.
- Responses - The total number of responses. This does not include the responses in pending or viewed state.
- Error - The total number of transactions in error state. The reason for the error is available in the Error text column.
- Skipped - The transactions that are skipped in delivery. Generally when resting period is added but due to some issue, it gets skipped, those transactions fall under the skipped category.
By default the above columns are displayed. But there is an option to add/delete columns in the dropdown. The drop down provides options like Resting period, unsubscribed, pre-processing etc
Each of the above mentioned category can be further divided into modes of transport
- Email - The total number of transactions that were sent using email.
- SMS - The total number of transactions that were sent using SMS.
- Others - The total number of transactions that were sent using APIs and Survey tokens.
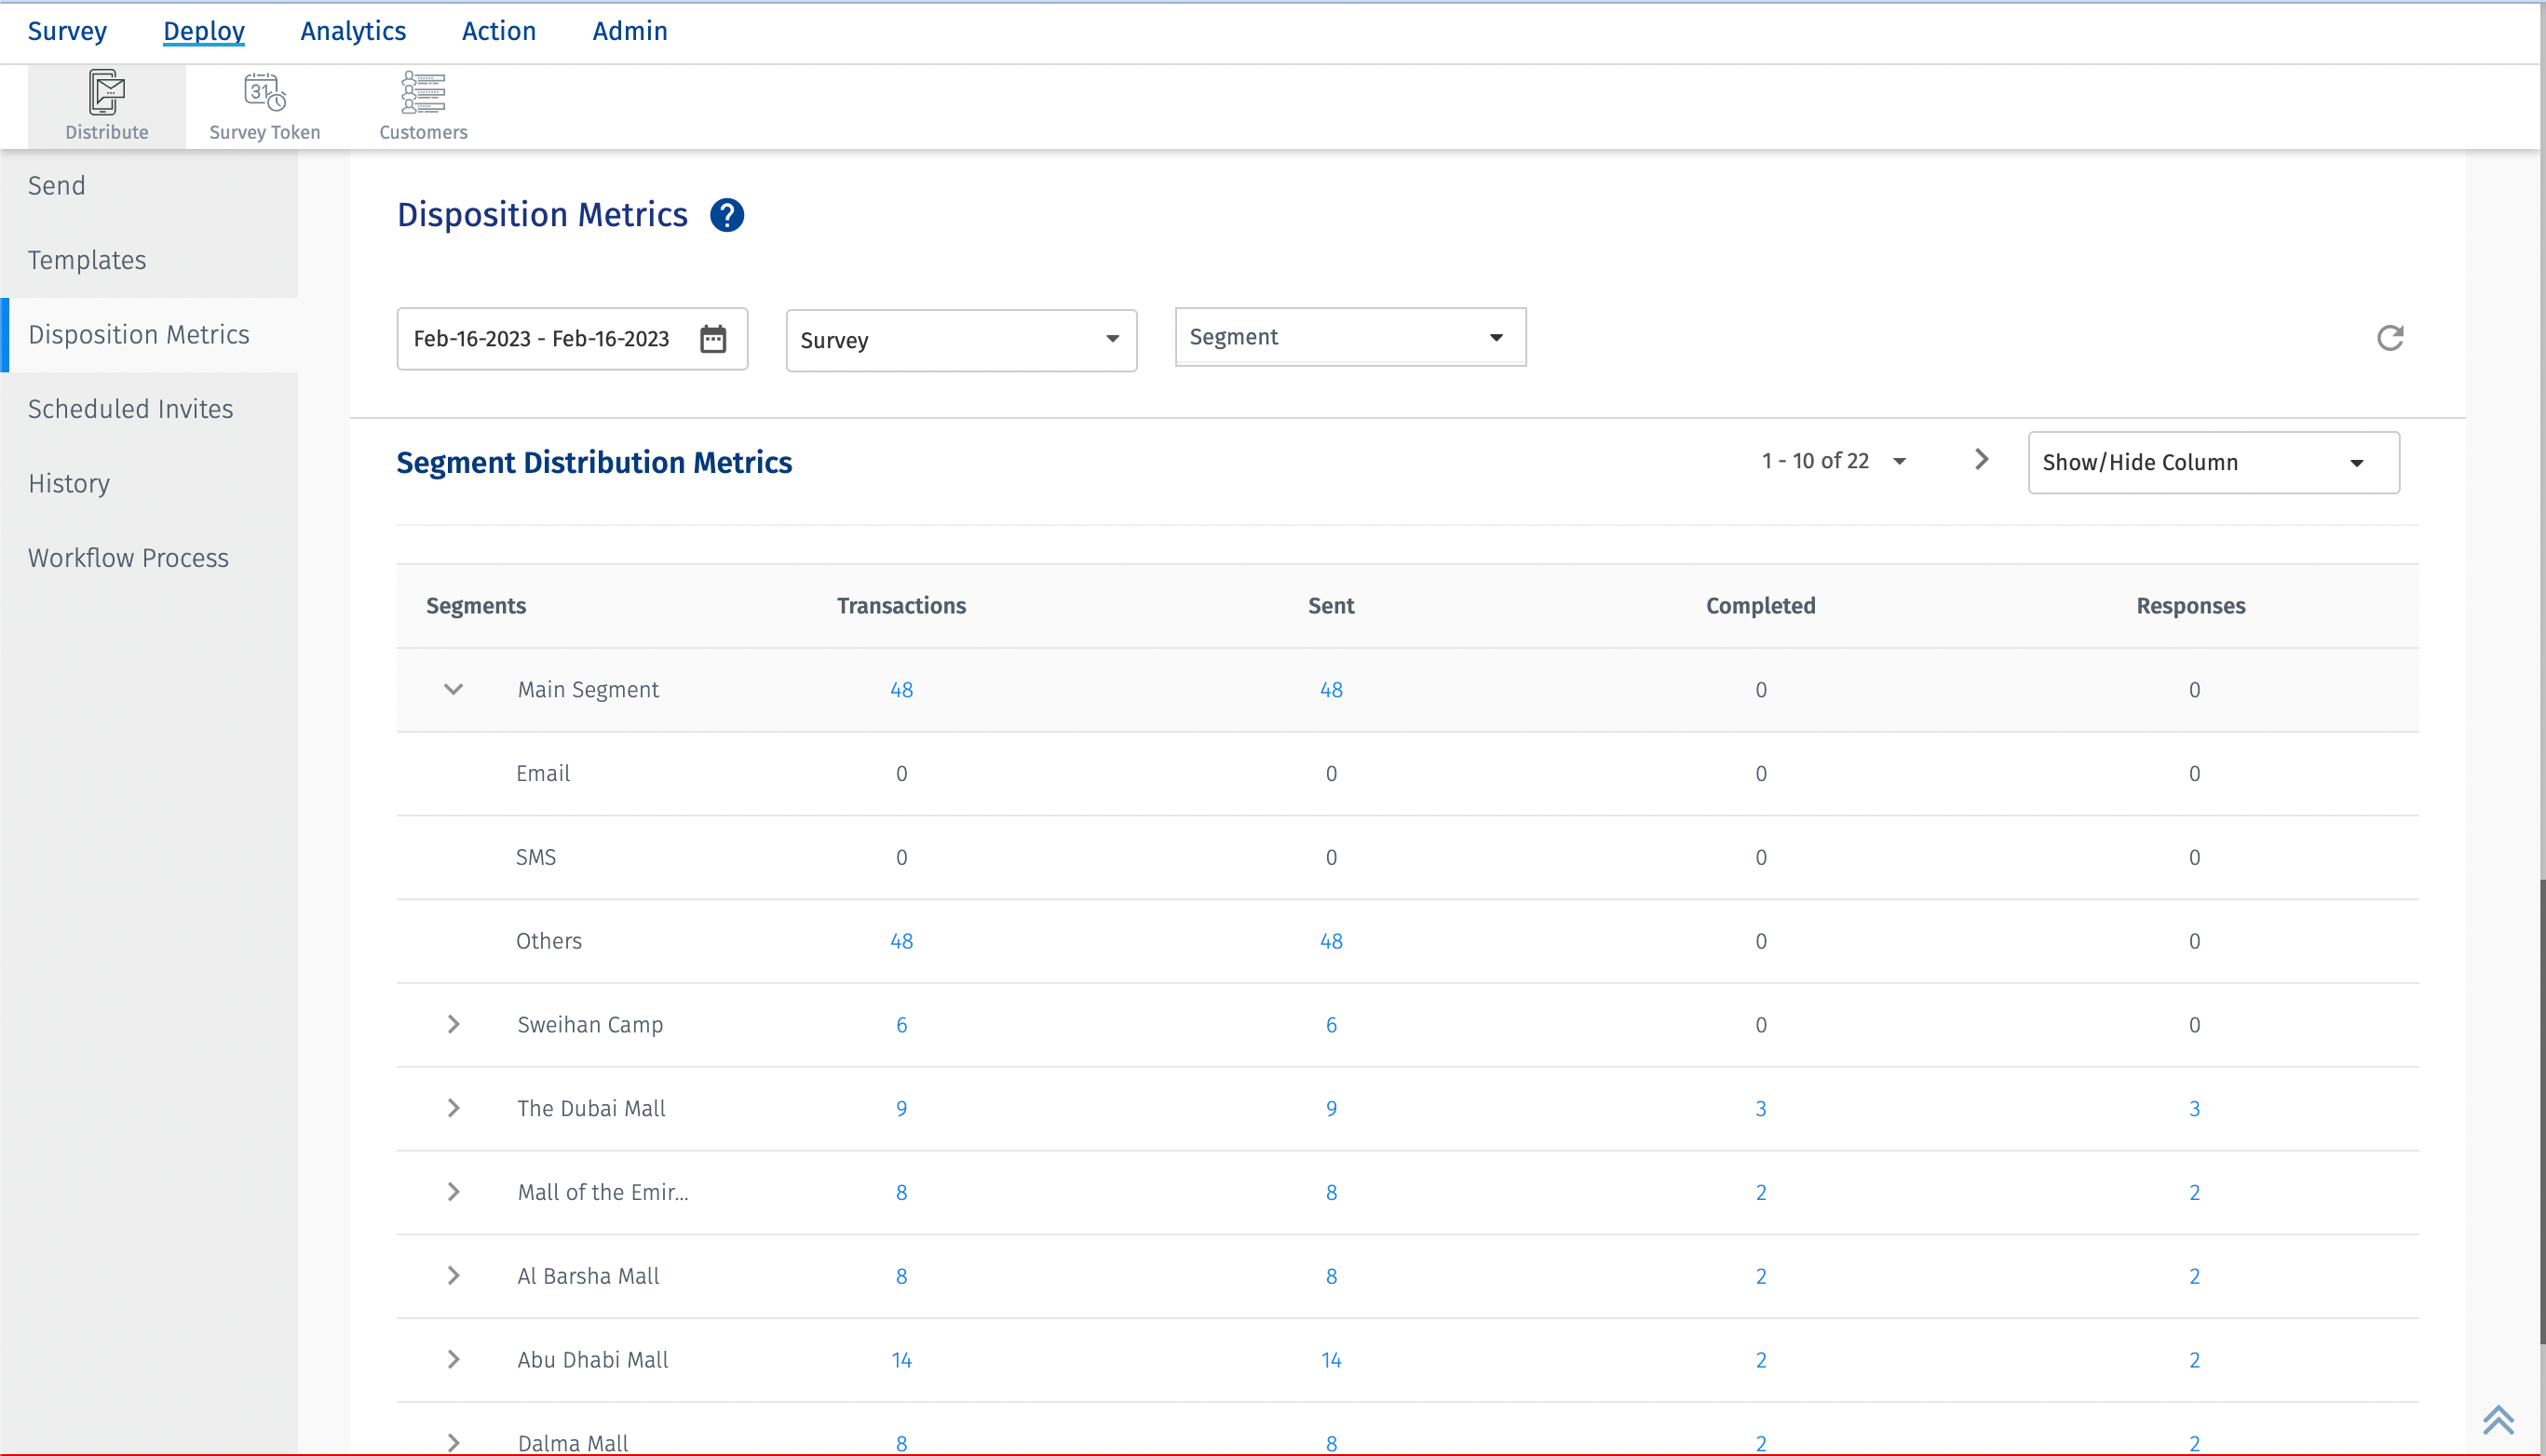
The segment distribution metrics shows the total number of transactions and further bifurcates them into following types at segment level.
- Sent - The total number of transactions that were sent successfully.
- Completed - The total number of transactions that were completed.
- Responses - The total number of responses. This does not include the responses in pending or viewed state.
By default the above columns are displayed. But there is an option to add/delete columns in the dropdown. The drop down provides options like Resting period, unsubscribed, pre-processing etc
Each of the above mentioned category can be further divided into modes of transport
- Email - The total number of transactions that were sent using email.
- SMS - The total number of transactions that were sent using SMS.
- Others - The total number of transactions that were sent using APIs and Survey tokens.
Response Rate = ( Total number of completed transactions / Total number of sent transactions ) * 100
Disposition Metrics can be downloaded in excel format.
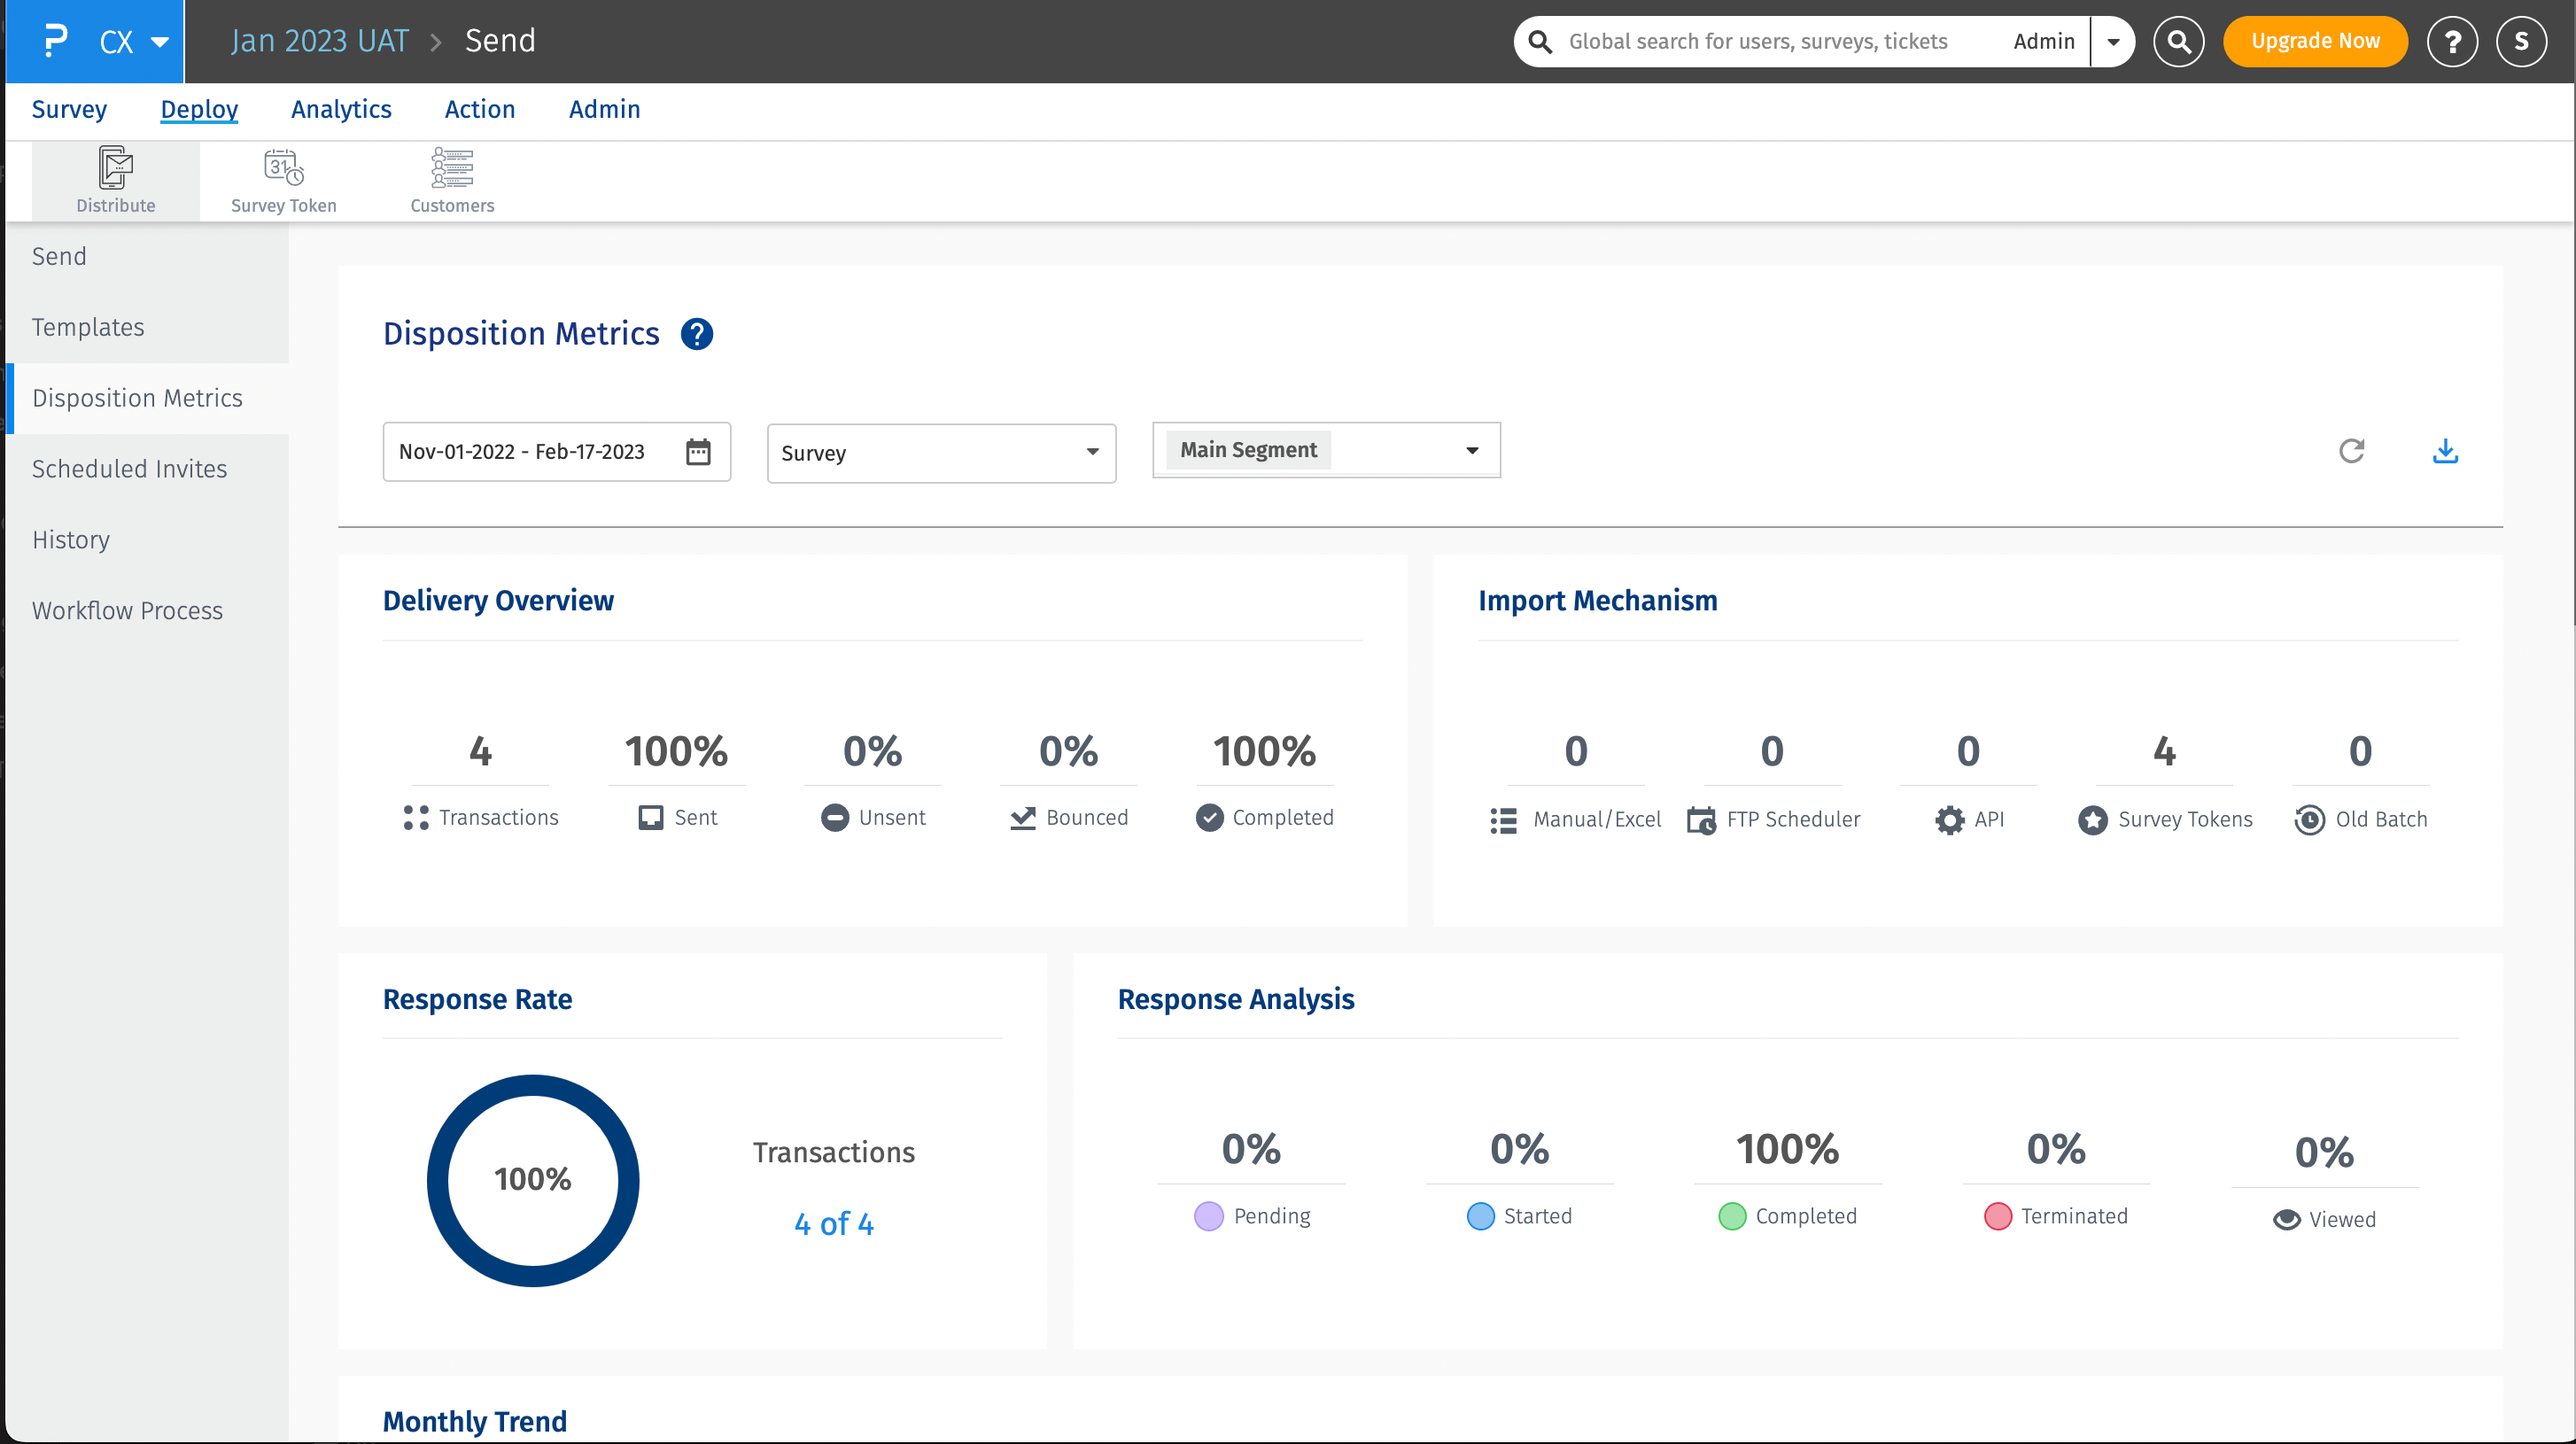
The following are the fields available.
- First Name - The first name of the customer. Will be shown as blank if not provided.
- Last Name - The last name of the customer. Will be shown as blank if not provided.
- Email Address - The email address of the customer.
- Phone Number - The phone number of the customer.
- Import Mechanism - The import mechanism used. Could be manual/excel, FTP, API, survey tokens or old batch.
- Survey Name - The name of the survey for which the transaction is deployed.
- Segment Name - The name of the segment for which the transaction is deployed.
- Product - The name of the product.
- Product Group - The name of the product group.
- Delivery Status - The delivery status of the transaction. Could be sent, unsent, bounced, completed etc.
- Response Status - The response status of the transaction deployed. Could be pending, started, completed, terminated or viewed.
- Sent Timestamp - The date and time when the transaction was sent.
- Error Text - If there is an error in the transaction deployed, the reason for that error is added in the error text.
- Custom Variables [ 1-100 ] - The values of the custom variables.
While you can download the complete disposition metrics in excel format. If you are interested in specific type of transactions and download a report in excel format. You can click on the number, a pop up with details of the transactions will open and you can click on the download button.
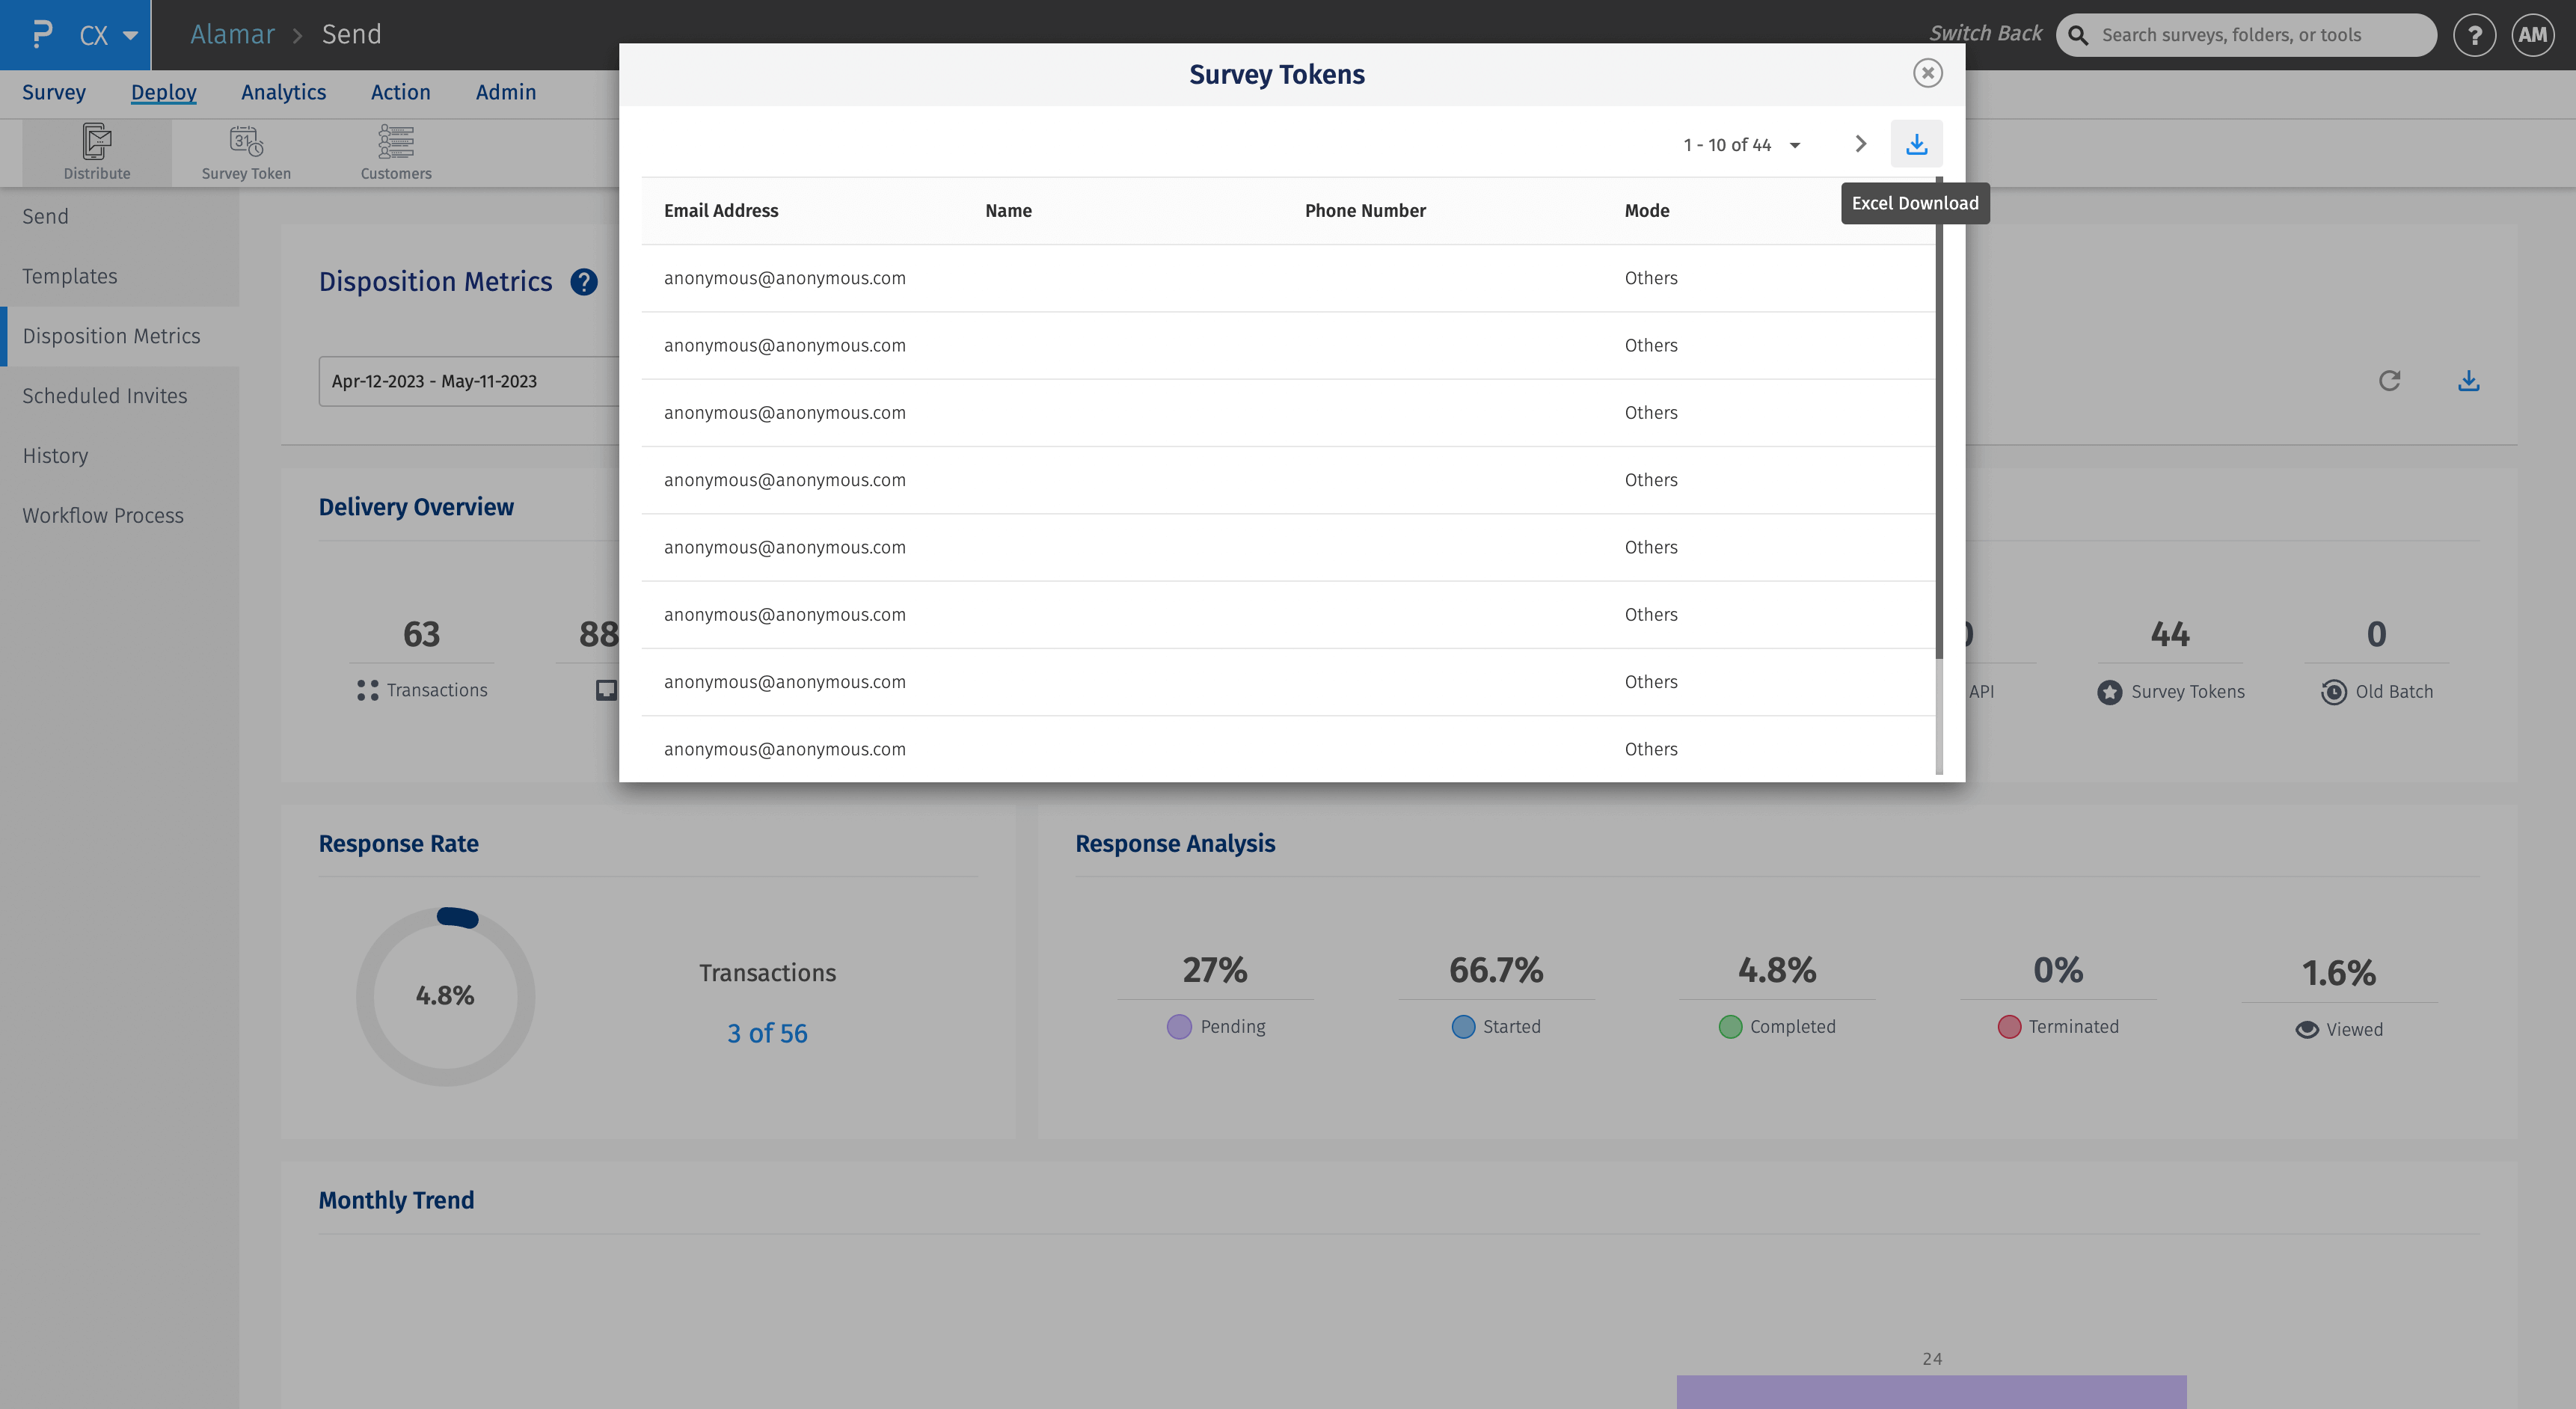
Lets take an example. In the image below, for the date range - Jan 01 - May 20 2023,the total number of transactions deployed is 6428. Out of them 6082 were sent. Out of 6082, 492 got responses. Now these 492 responses can be outside the date range selected. These responses may have been received after May 20, but since they were deployed within the date range selected, those are the numbers.This is mainly because the Disposition Metrics dashboard deals with the deployment date of the transactions.
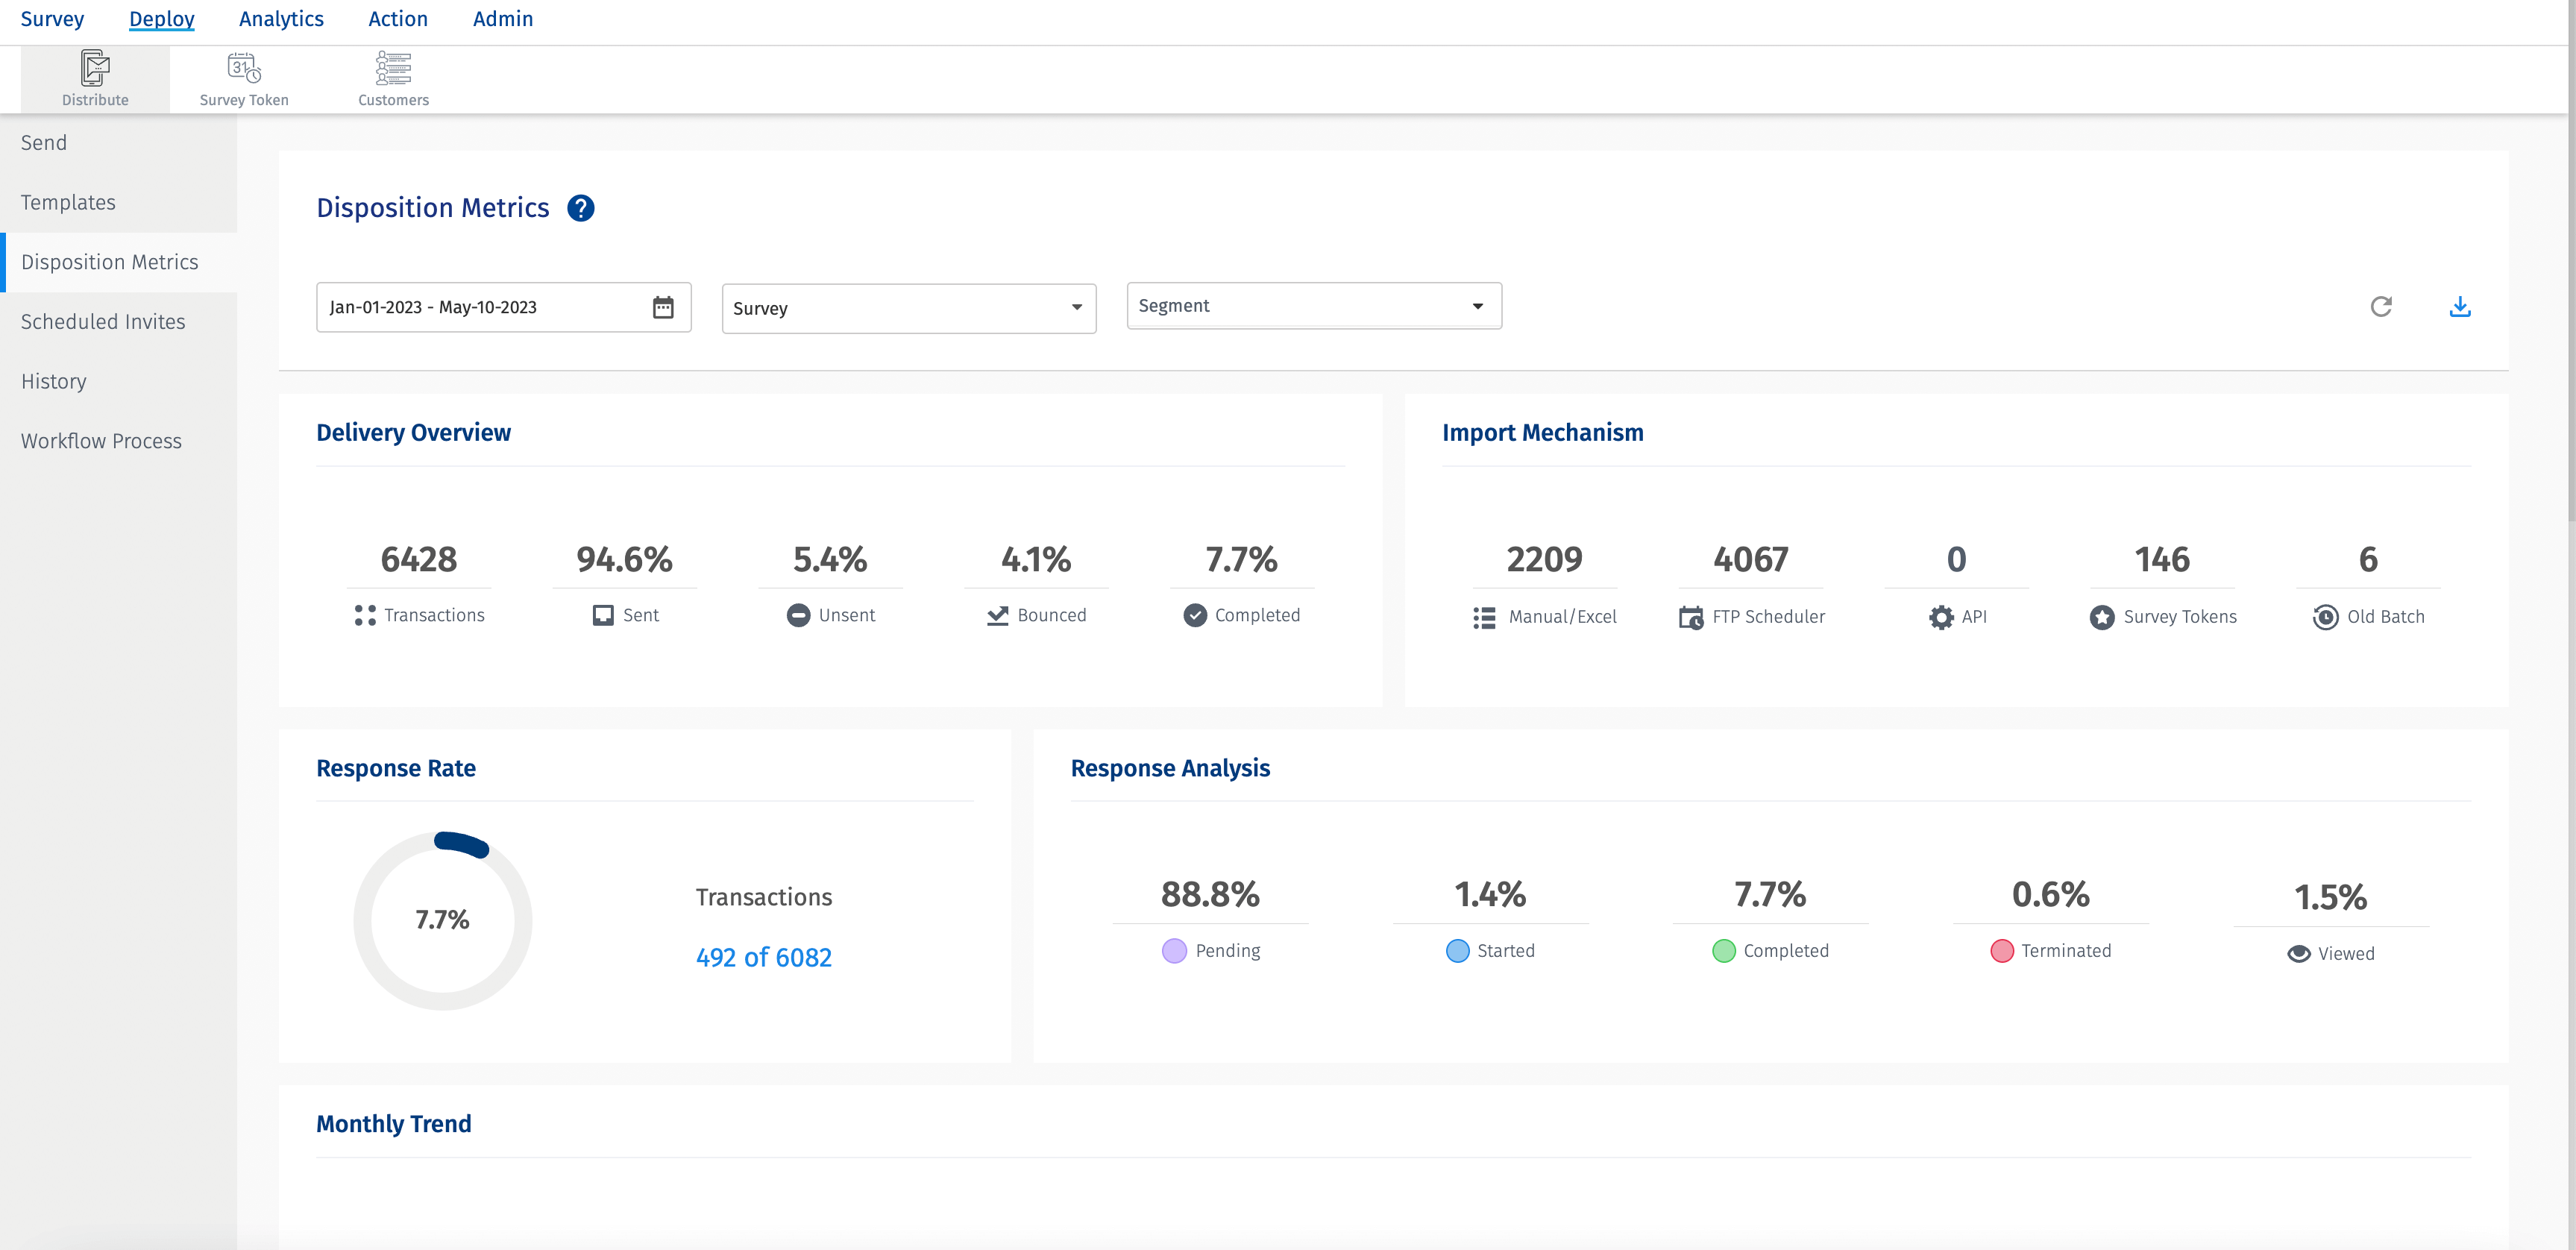
Now, lets take a look at the response rate widget. Here the date range selected is same i.e. Jan 01 2023 - May 20 2023. Here, the response rate widget shows data as 394 out of 5718. This means for the selected date range, out of 5718 transactions, 394 got responses since the response rate widget deals with the timestamp when the responses were collected.
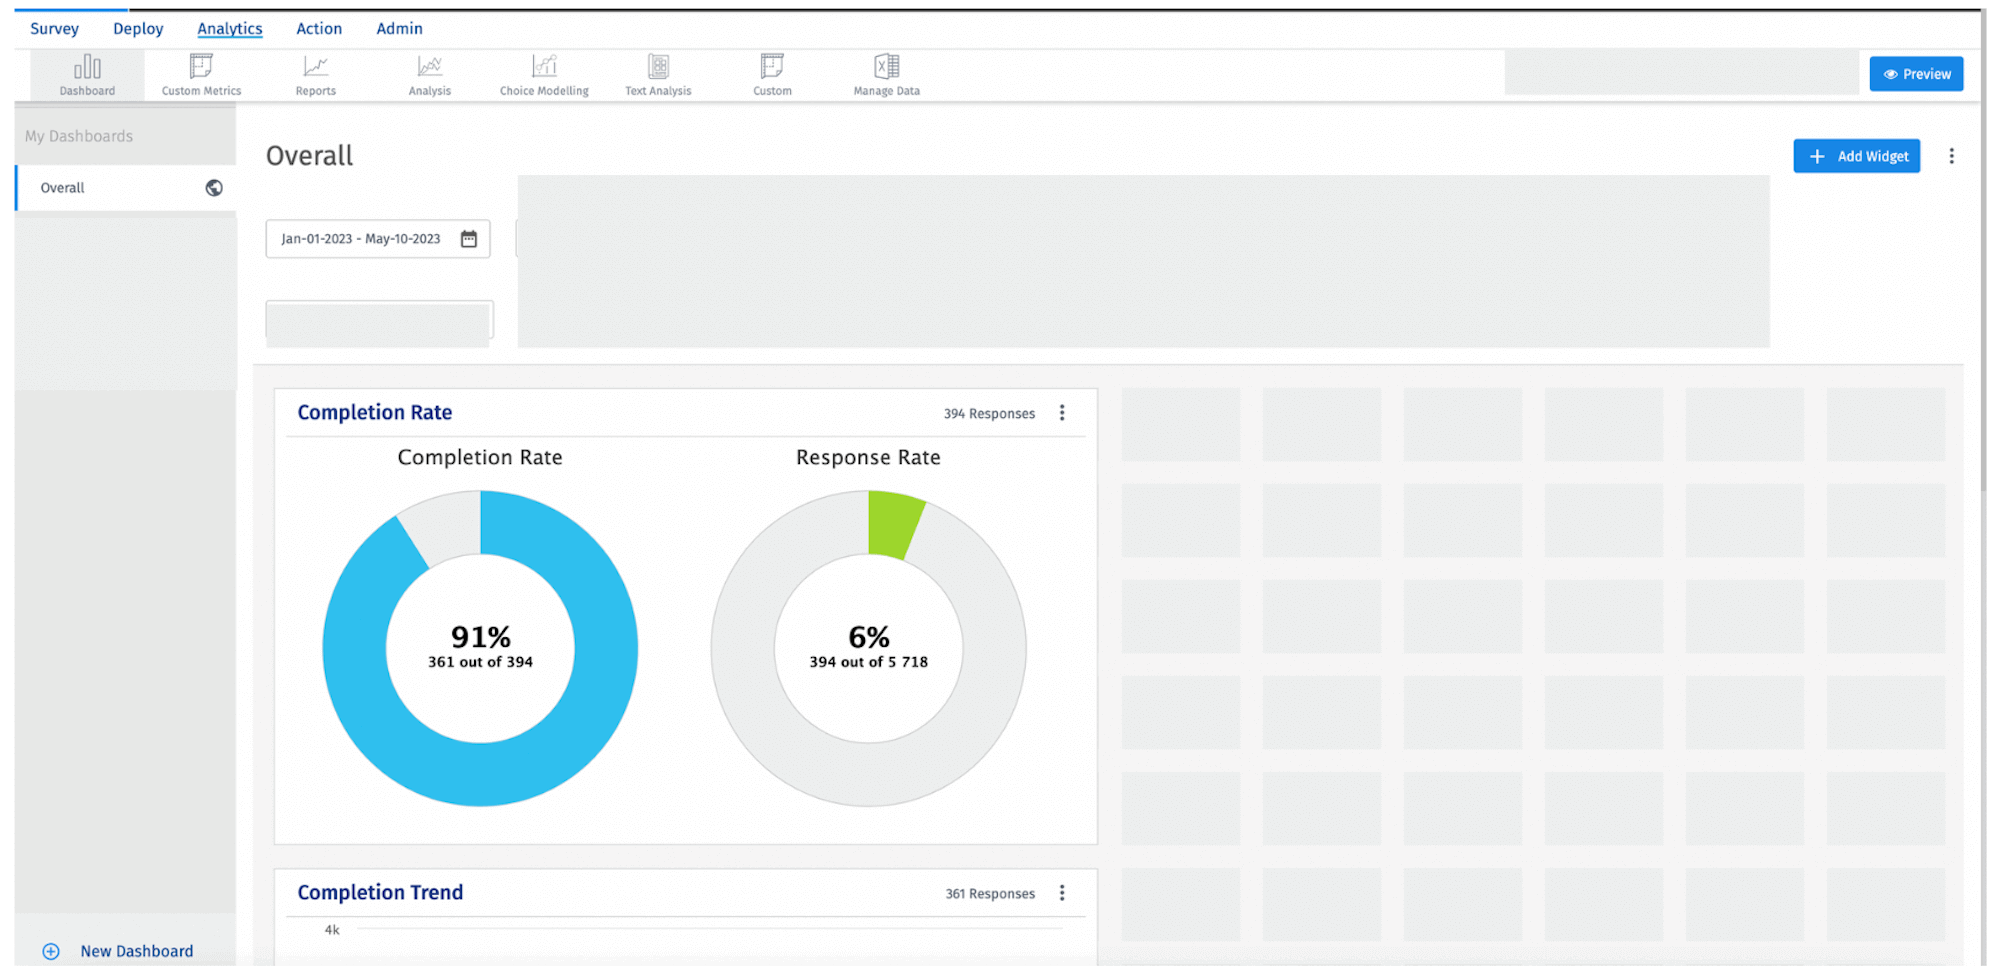
Hence, the numbers on the Disposition Metrics will not match with the response rate widget primararily due the difference in the timestamp that they deal with.

