

- Custom Variable Widget
- Priority Matrix
- Heatmap Widget
- Grid Widget
- Weighted mean widget
- Comment List widget
- Widget Filters
- Ranking List Widget
- Distribution Chart
- NPS Widget
- Trend Widget
- Word Cloud Widget
- Cross tab widget
- KPI Comparison Widget
- Bubble chart
- Custom Metric Trend Chart
- Trend Comparison Widget

Customer Experience - Pivot tables
Pivot tables allow you to visualize and view your data relative to a single question. For example, if in your survey, one of the questions is "Where are you from?" - The answer options are:
- North-West
- West Coast
- Mountain States
- Mid-West
- South
- East Coast
- North-East
Go to:
- Login >> Customer Experience >> Analytics >> Analysis >> Cross-Tabulation
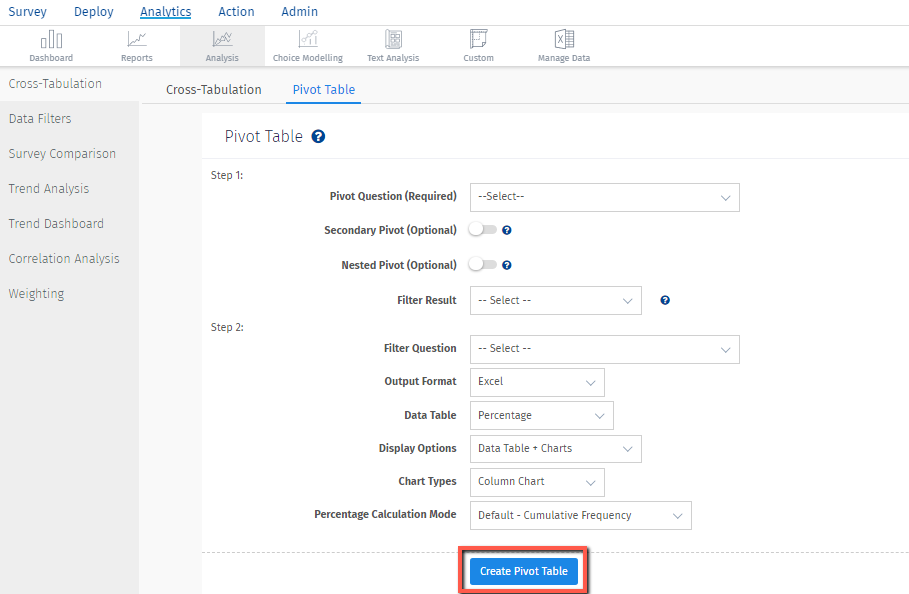
- Step 1: Choose the Pivot Question. This is the question that you want to segment on. In the example below, this would be the question, “Where are you from?”
- Decide if you want to include a Secondary Pivot or a Nested Pivot or both. Check the box next to each option desired.
- Select how you would like to Filter Results. Options for result filtering include:
- Completed
- Started but not Completed
- Terminated via Branching.
- Step 2: The Output Format option is Excel.
- Select the type of Data Table to view.
- Frequency: This will show you numbers of responses. For example, the number of respondents who selected North-West who also selected an option in another question.
- Percentage: This is the default selection. This will show you the number of responses as a percentage of the total number of responses to the pivot question.
- Select the Display Option desired.
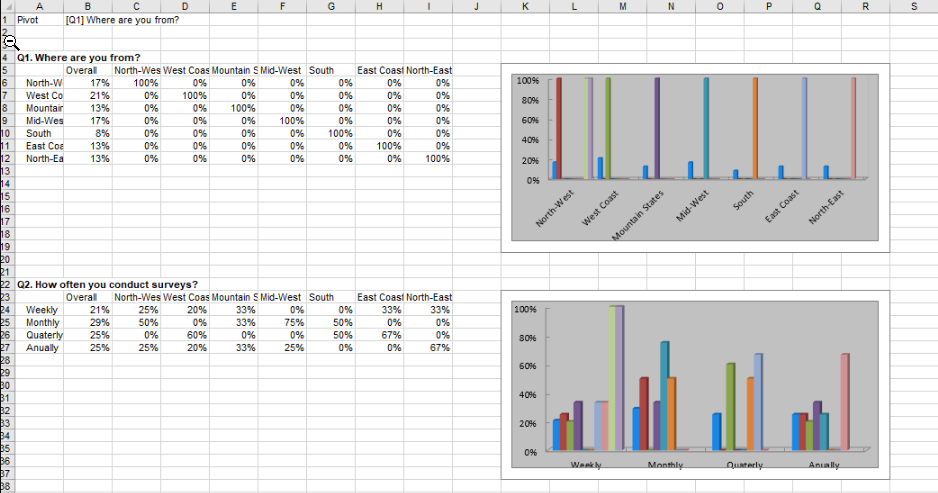
- Data Table + Charts. This option will give you tables and charts for each table.
- Data Table Only. This option removes the charts. If you have a lot of data, this option is the fastest option for generating the Pivot tables.
- Data Table + Charts + Mean. This option will give you the tables, charts for each table, and the mean calculation for each answer option column.
- Click Create Pivot Table. The Pivot tables will be generated and emailed to the email address on the account.
Below is an example of the Pivot table selected with the display option Data Table + Charts. You can see that the survey questions are listed in the first two columns, showing the answer options and the overall responses. The pivot question answer options are then displayed across the next set of columns. The percentages shown are the percentages of those who answered both the survey question listed AND the pivot question. For example, from the example below, we see that 21.43% of those who were from the North-West were male, and 78.57% of those from the North-West were female.
Yes. You can have multiple Pivot questions using the Secondary Pivot and/or Nested Pivot option.
- Secondary Pivot. The Secondary Pivot allows you to Pivot on more than one question. For example, if you wanted to produce a Pivot Table that pivots on Gender AND Race, you can choose Gender as the primary Pivot and Race as a the secondary pivot. The secondary pivot is optional. In the data tables, the secondary pivot will appear as another set of columns next to the pivot question.
- Nested Pivot. The Nested Pivot allows you to Pivot on more than one question combined. For example, if you wanted to produce a Pivot Table that pivots on Gender combined with Race, you can choose Gender as the primary Pivot and Race as a the nested pivot. In the data tables, you will see the nested pivot as “Pivot Answer/Nested Pivot Answer,” rather than a new set of columns.
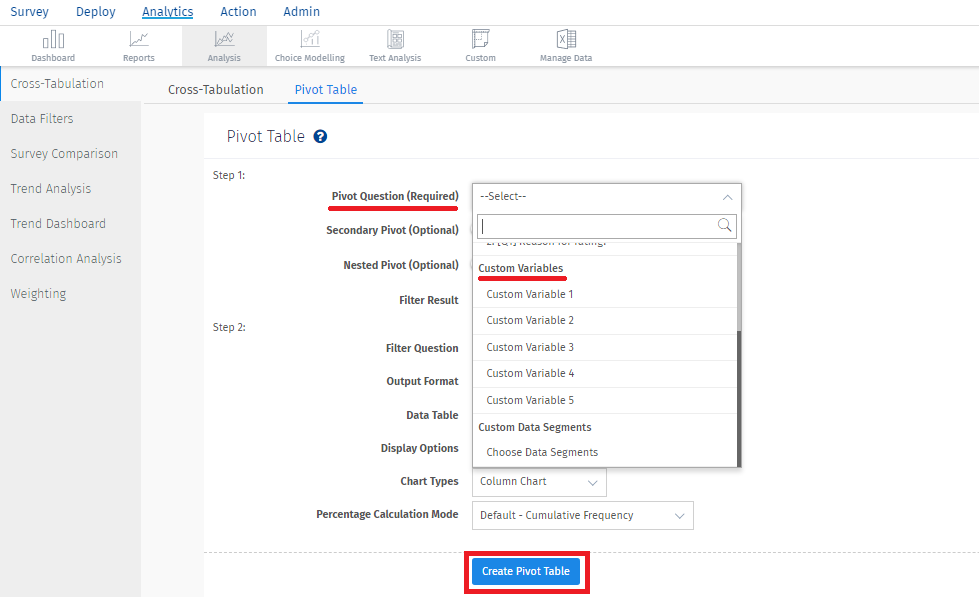
Yes. Choose the Custom Variable you want to segment on (in step 1) and the system will automatically create a Pivot table for every available data point.
The Advanced Options allow you to customize the output and layout of the generated Pivot Tables.
-
Secondary Pivot
The Secondary Pivot allows you to Pivot on more than one question. For example, if you wanted to produce a Pivot Table that pivots on Gender AND Race, you can choose Gender as the primary Pivot and Race as a the secondary pivot. The secondary pivot is optional.
-
Nested Pivot
The Nested Pivot allows you to Pivot on more than one question combined. For example, if you wanted to produce a Pivot Table that pivots on Gender combined with Race, you can choose Gender as the primary Pivot and Race as a the nested pivot.
-
Data Table
The values produced in the Data Table can either be absolute frequency numbers i.e. the actual number of users who chose a particular option, or be relative percentage.
-
Display Options
The Pivot Tables can be generated with or without associated charts. Generating Pivot Tables without charts is generally faster and the resulting file is smaller also.
For simple (non-nested) tables, there is no limit to the number of columns that can be used in the tables. This includes tables with a primary pivot question and a secondary pivot question. Please keep in mind, however, that if your data set is large or if there are a lot of data points (questions) in your survey, it may take a longer time for the system to generate the Pivot table.
For Nested Pivot Tables, there is a limit of a total of 64 columns. This is to prevent our system from being over utilized and slowing the service for others. This is a system limitation and no exceptions will be made.
This feature/tools described here are available with the following license(s) :