- Custom Variable Widget
- Priority Matrix
- Heatmap Widget
- Grid Widget
- Weighted mean widget
- Comment List widget
- Widget Filters
- Ranking List Widget
- Distribution Chart
- NPS Widget
- Trend Widget
- Word Cloud Widget
- Cross tab widget
- KPI Comparison Widget
- Bubble chart
- Custom Metric Trend Chart
- Trend Comparison Widget
Dashboard
Dashboard
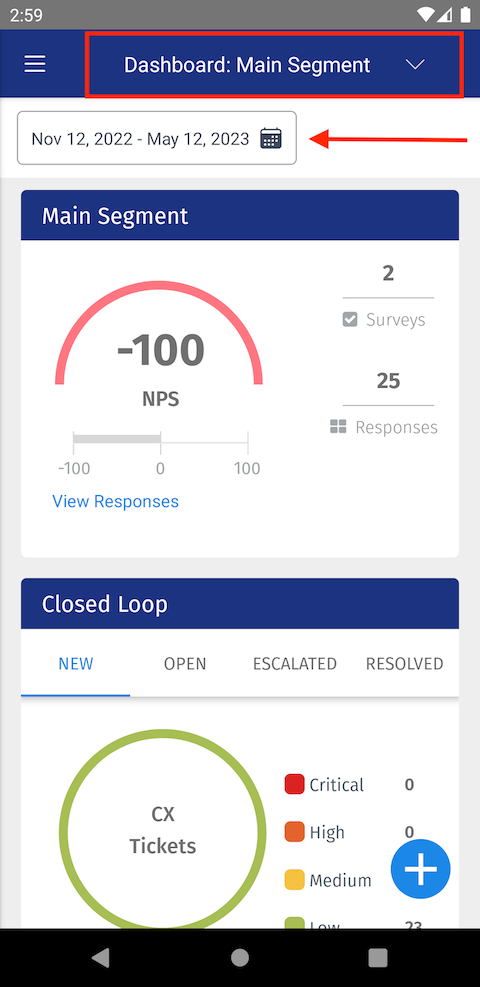
Dashboard consist of analytical data for a better understanding of Customer Experience.

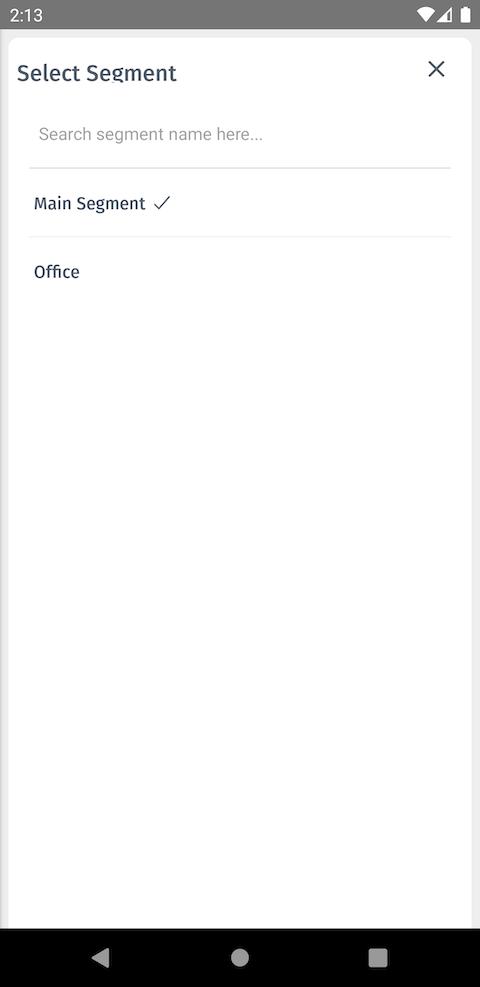
on the Dashboard there is a Business Unit switcher on top to switch between Business Unit and see data accordingly.

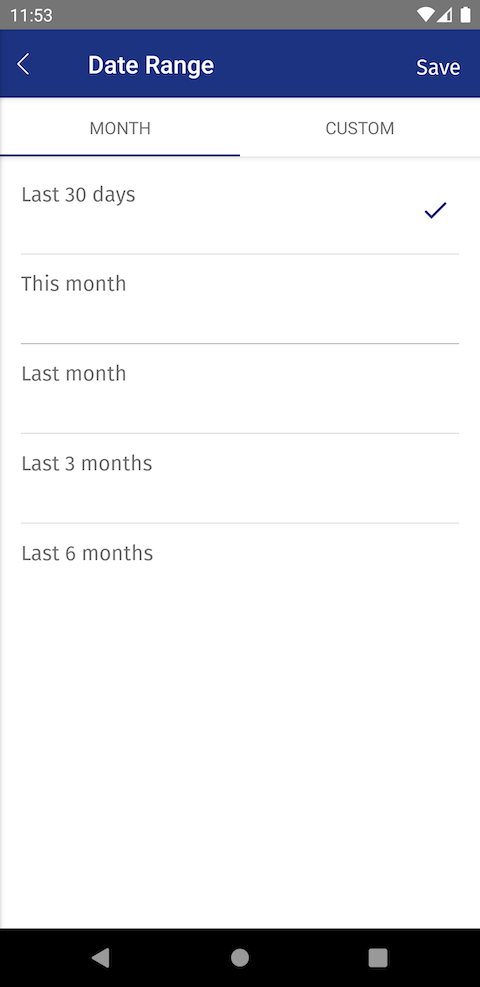
There is also a date filter to see analytical data by dates.

On the main section there is a NPS Score meter, Survey count and Response count visible.
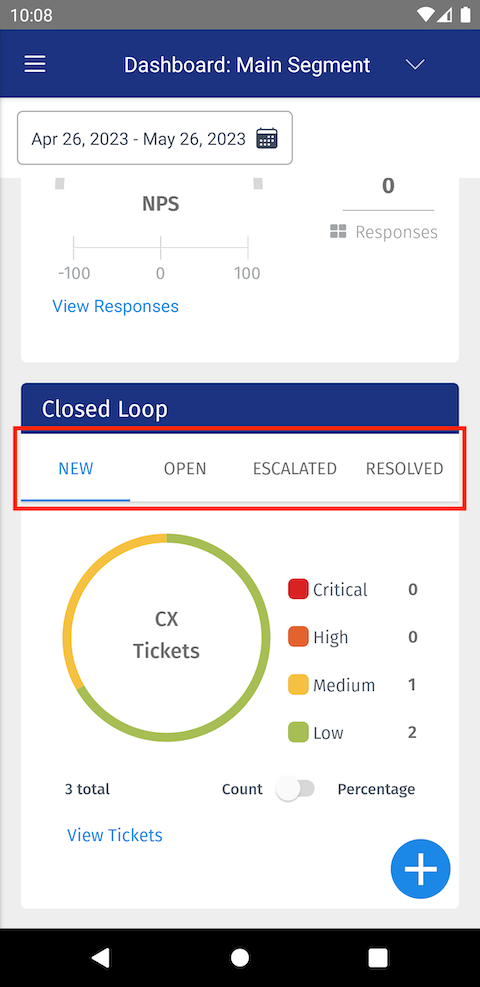
 In Closed Loop section, tabs are divided by the ticket status. It’s showing the ticket count based on status and priority.
You may also be interested in...

