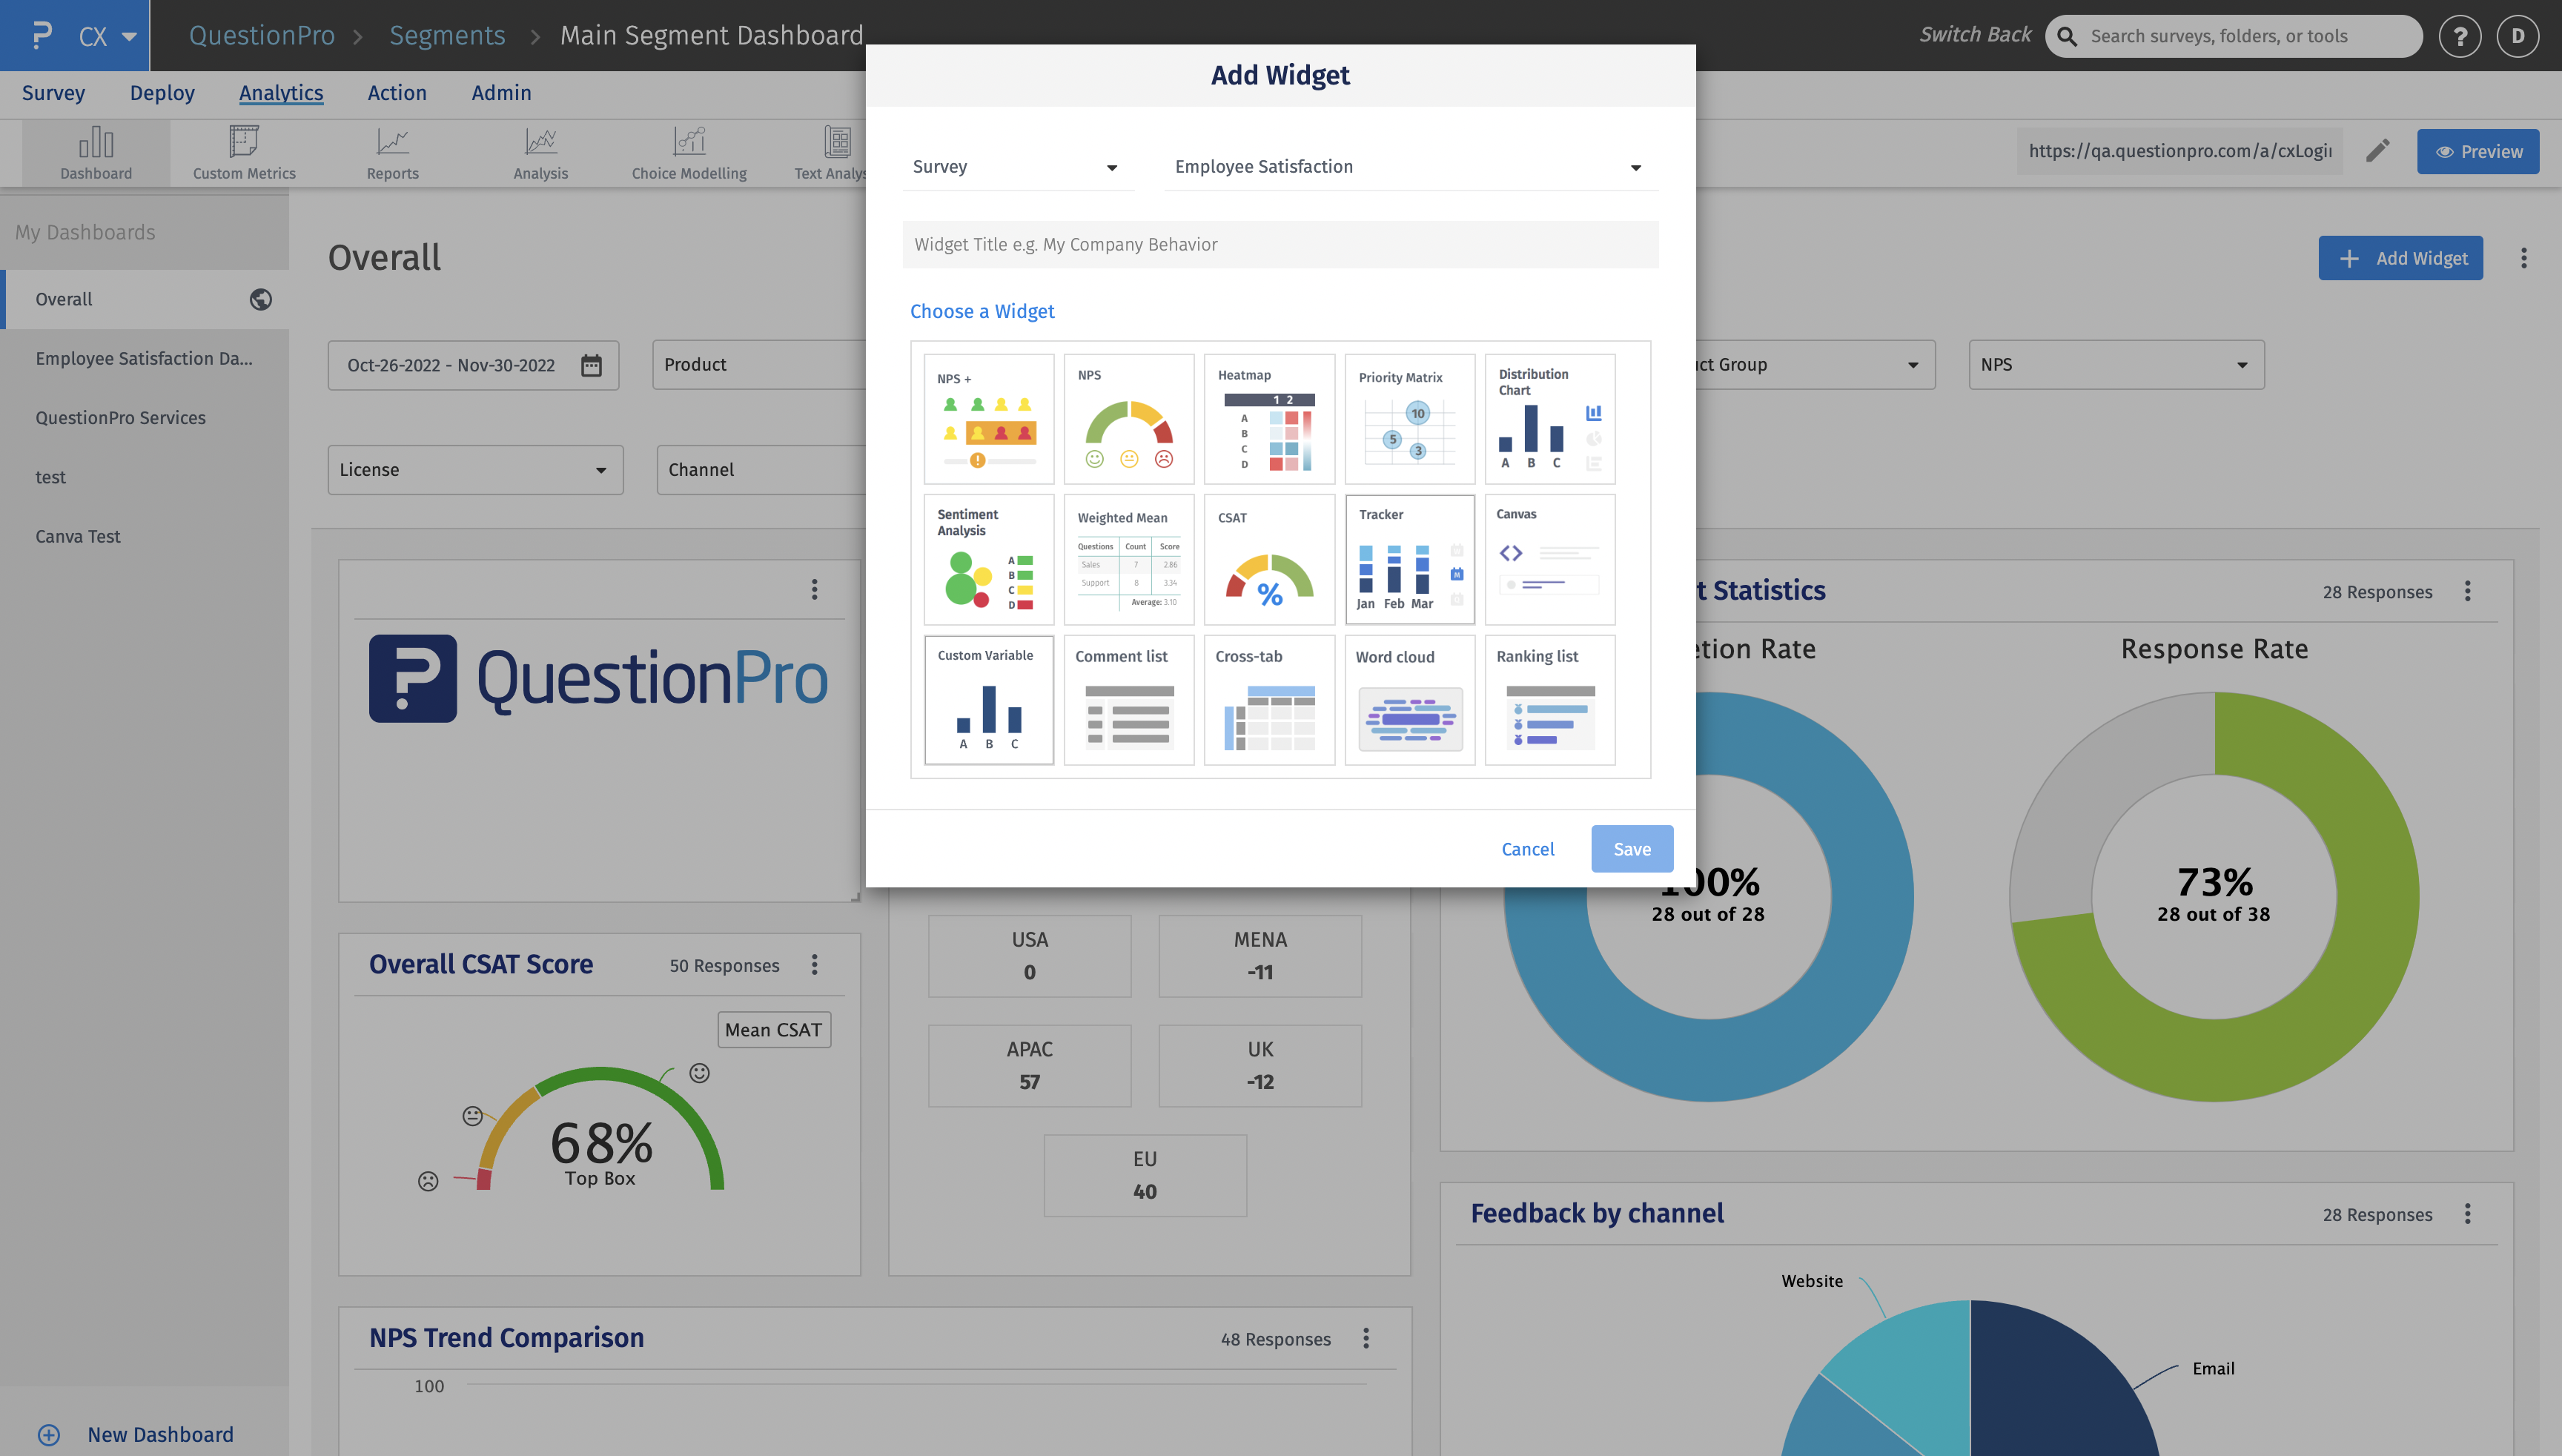
- Custom Variable Widget
- Priority Matrix
- Heatmap Widget
- Grid Widget
- Weighted mean widget
- Comment List widget
- Widget Filters
- Ranking List Widget
- Distribution Chart
- NPS Widget
- Trend Widget
- Word Cloud Widget
- Cross tab widget
- KPI Comparison Widget
- Bubble chart
- Custom Metric Trend Chart
- Trend Comparison Widget
Cross tab widget
What is a cross tab widget?
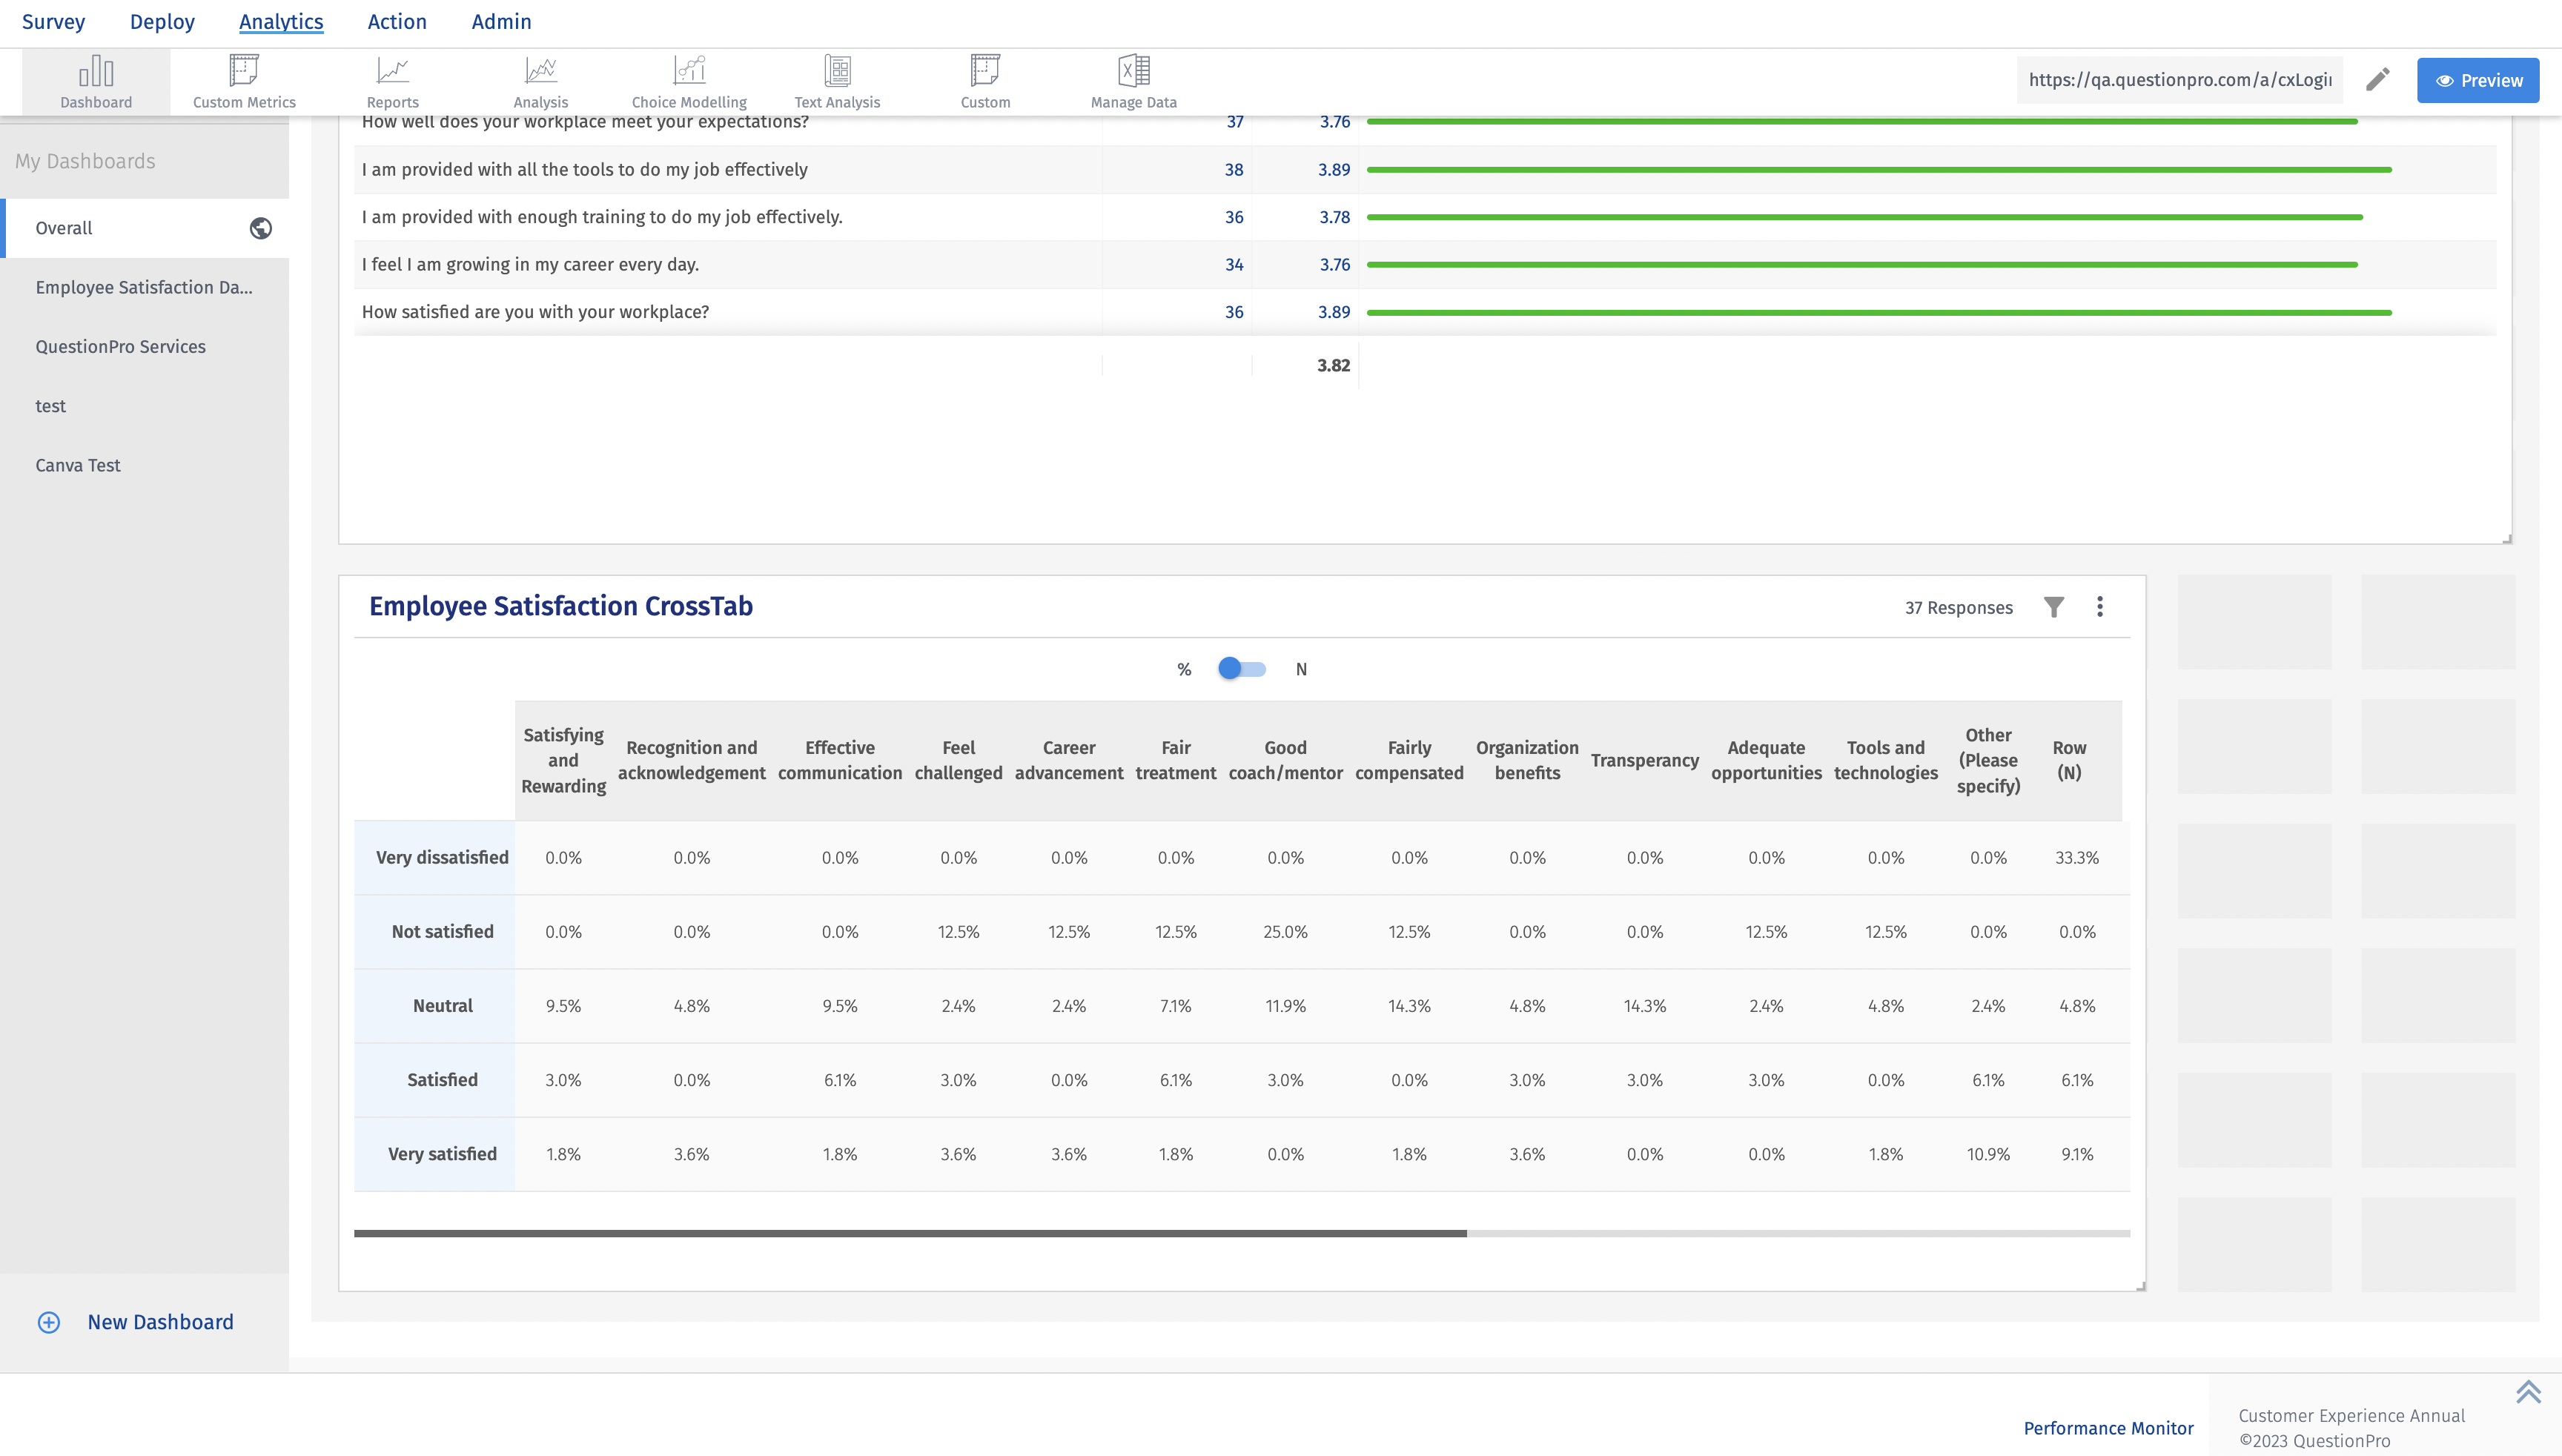
A cross tab widget, also known as a cross-tabulation or crosstab widget, is a data visualization tool used to analyze the relationships between two or more categorical variables in a tabular format. It is commonly employed in data analysis and business intelligence applications to gain insights into the interactions and associations between different data attributes.
The cross tab widget creates a two-dimensional table that presents the intersection of rows and columns representing the selected data attributes. Each cell within the table displays aggregated data or summary statistics that help users understand the relationships between the variables.How to add a cross tab widget?
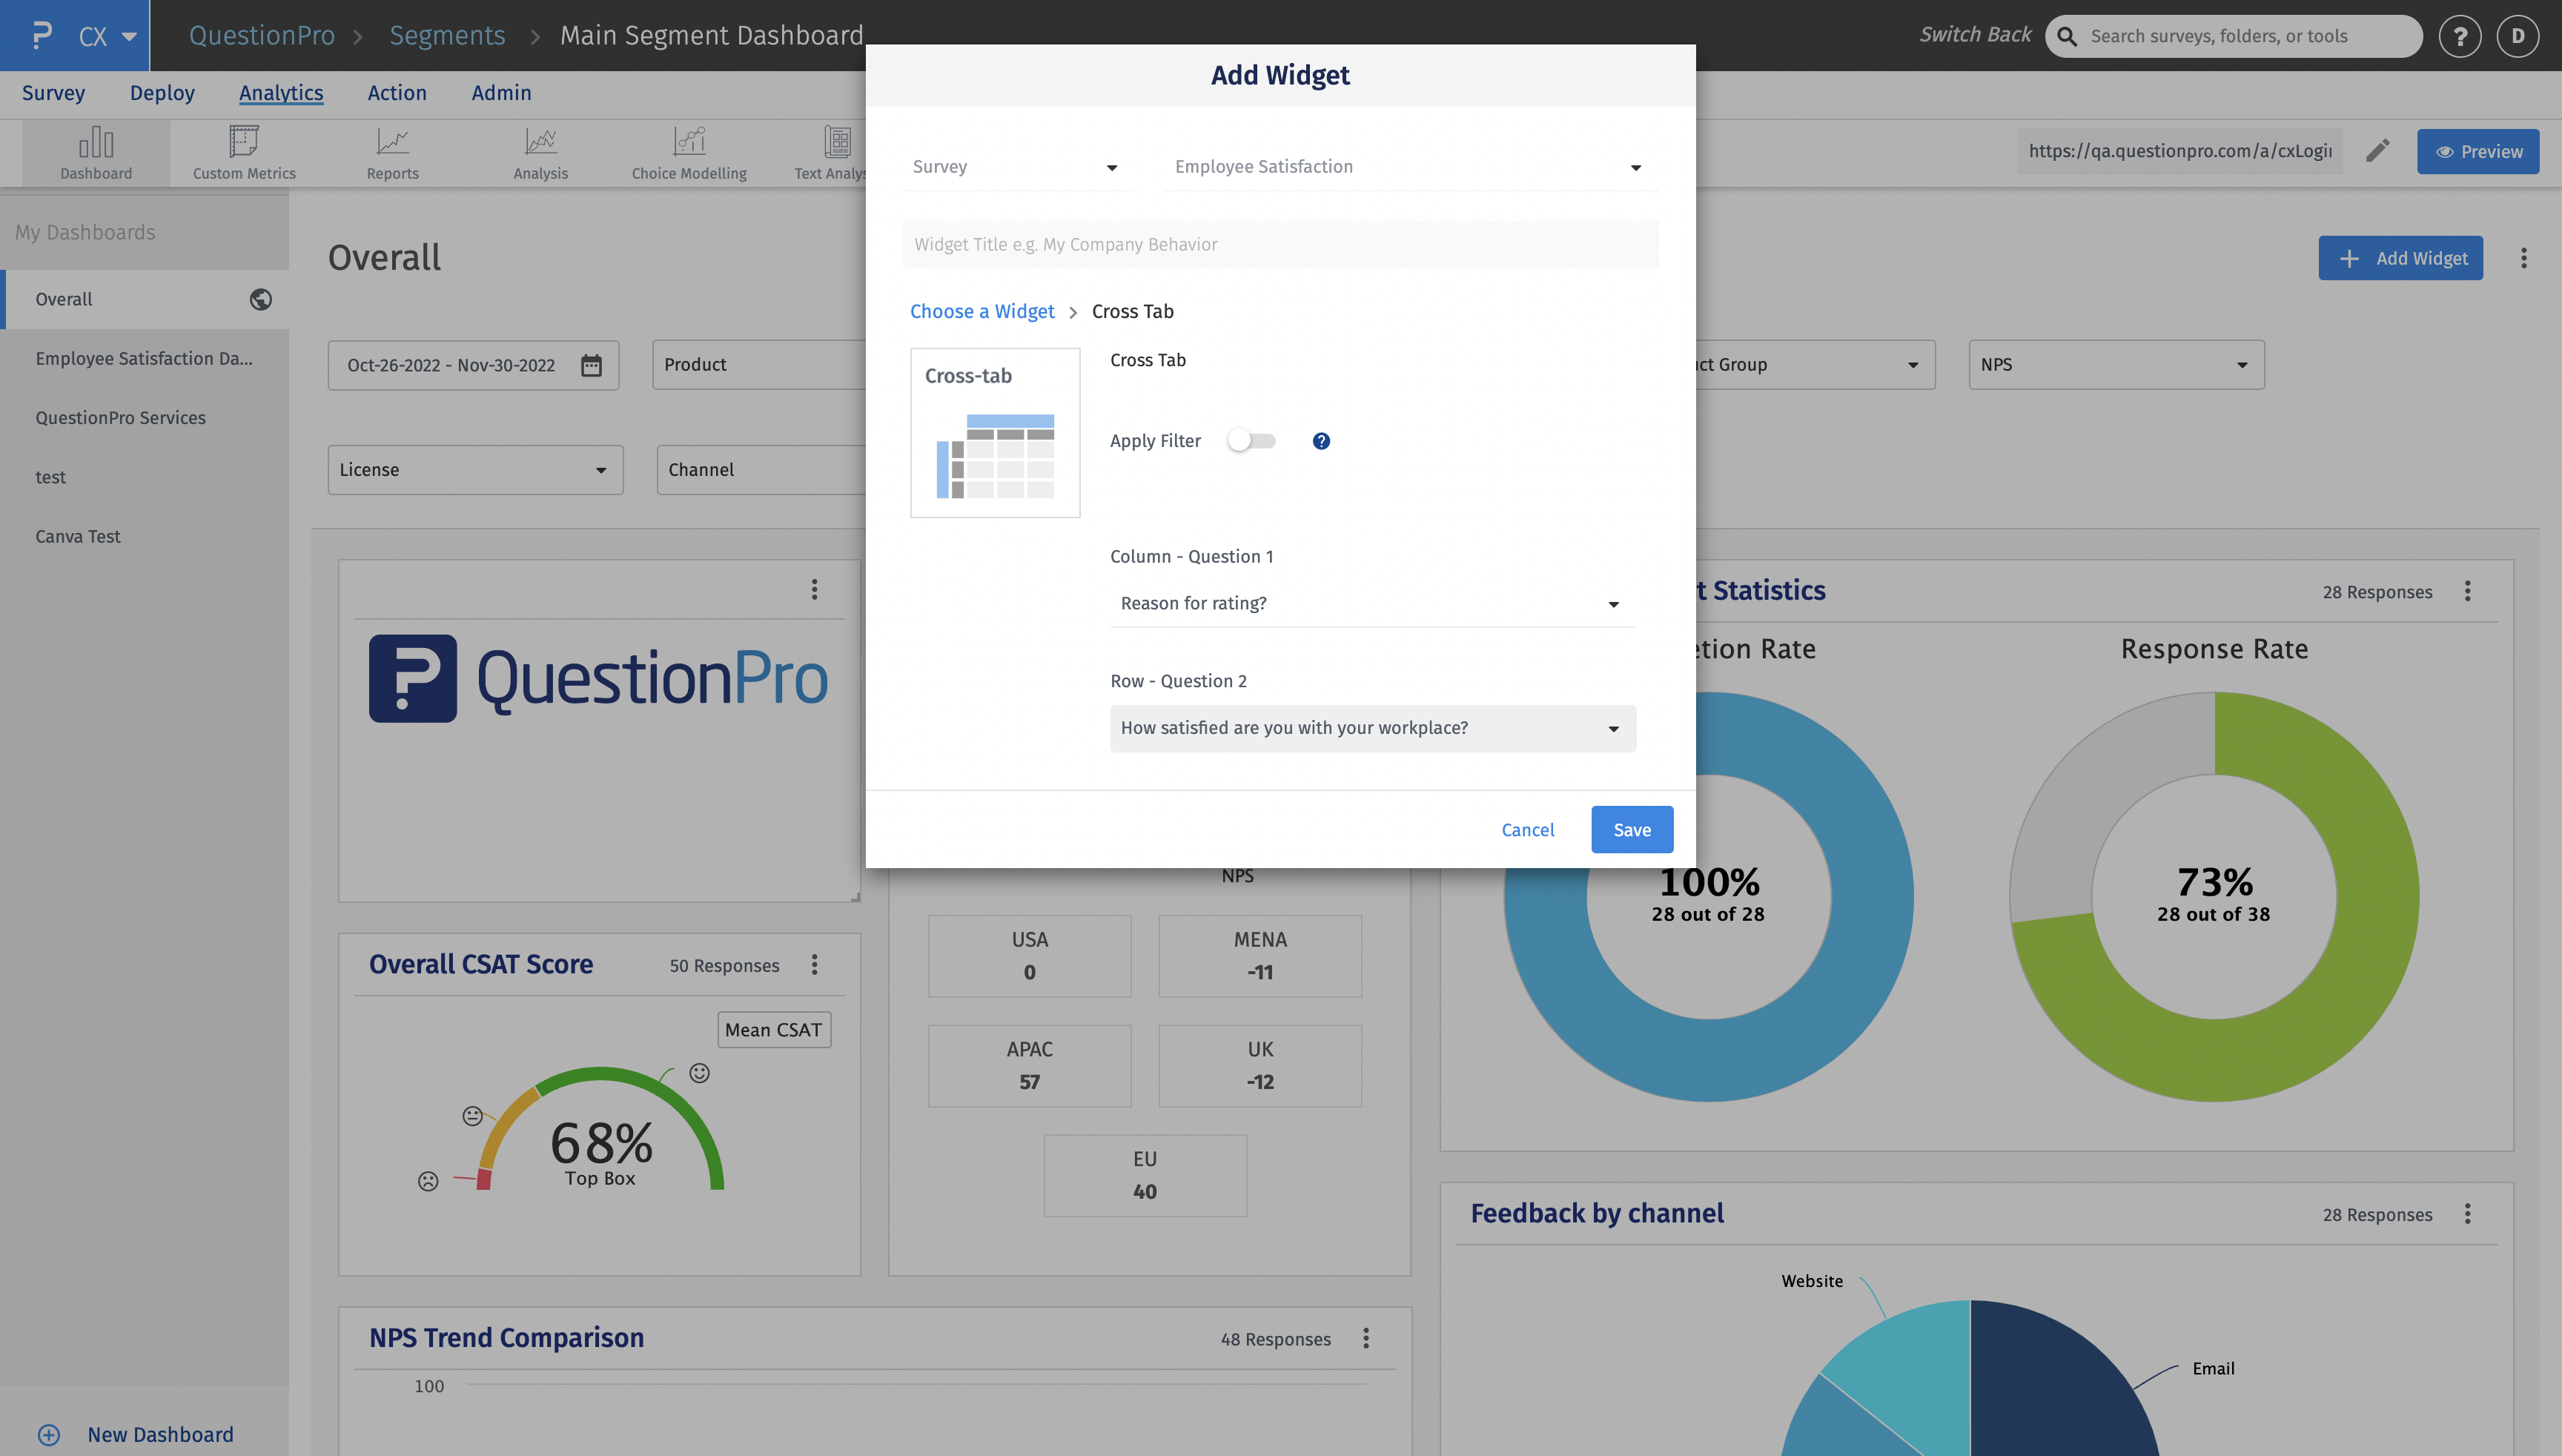
- Browse a workspace and goto Analytics. Click on Add widget.
- The cross tab widget is available at survey level. Select the questions for the rows and columns.
- Additionally, filters can be applied viz. Segment, Product, Product Group and Custom Variable.
- The widget will be added.


You may also be interested in...

