- Custom Variable Widget
- Priority Matrix
- Heatmap Widget
- Grid Widget
- Weighted mean widget
- Comment List widget
- Widget Filters
- Ranking List Widget
- Distribution Chart
- NPS Widget
- Trend Widget
- Word Cloud Widget
- Cross tab widget
- KPI Comparison Widget
- Bubble chart
- Custom Metric Trend Chart
- Trend Comparison Widget
Trend Widget
What is a Trend widget?
A trend widget provides a visual representation of how a metric changes over time, offering a valuable tool for tracking performance, identifying trends, and driving data-informed actions.
The trend widget is especially useful for tracking and monitoring key performance indicators (KPIs) and other time-series data. It allows users to visualize how a metric evolves over different time intervals, such as days, weeks, months, or years. By displaying the historical data in a visual format, the widget enables users to identify patterns, spot anomalies, and make informed decisions based on the insights gained from the trend analysis.
How to add trend widget to the dashboard?
The trend widget is available at the segment level.Follow the steps below to add it.
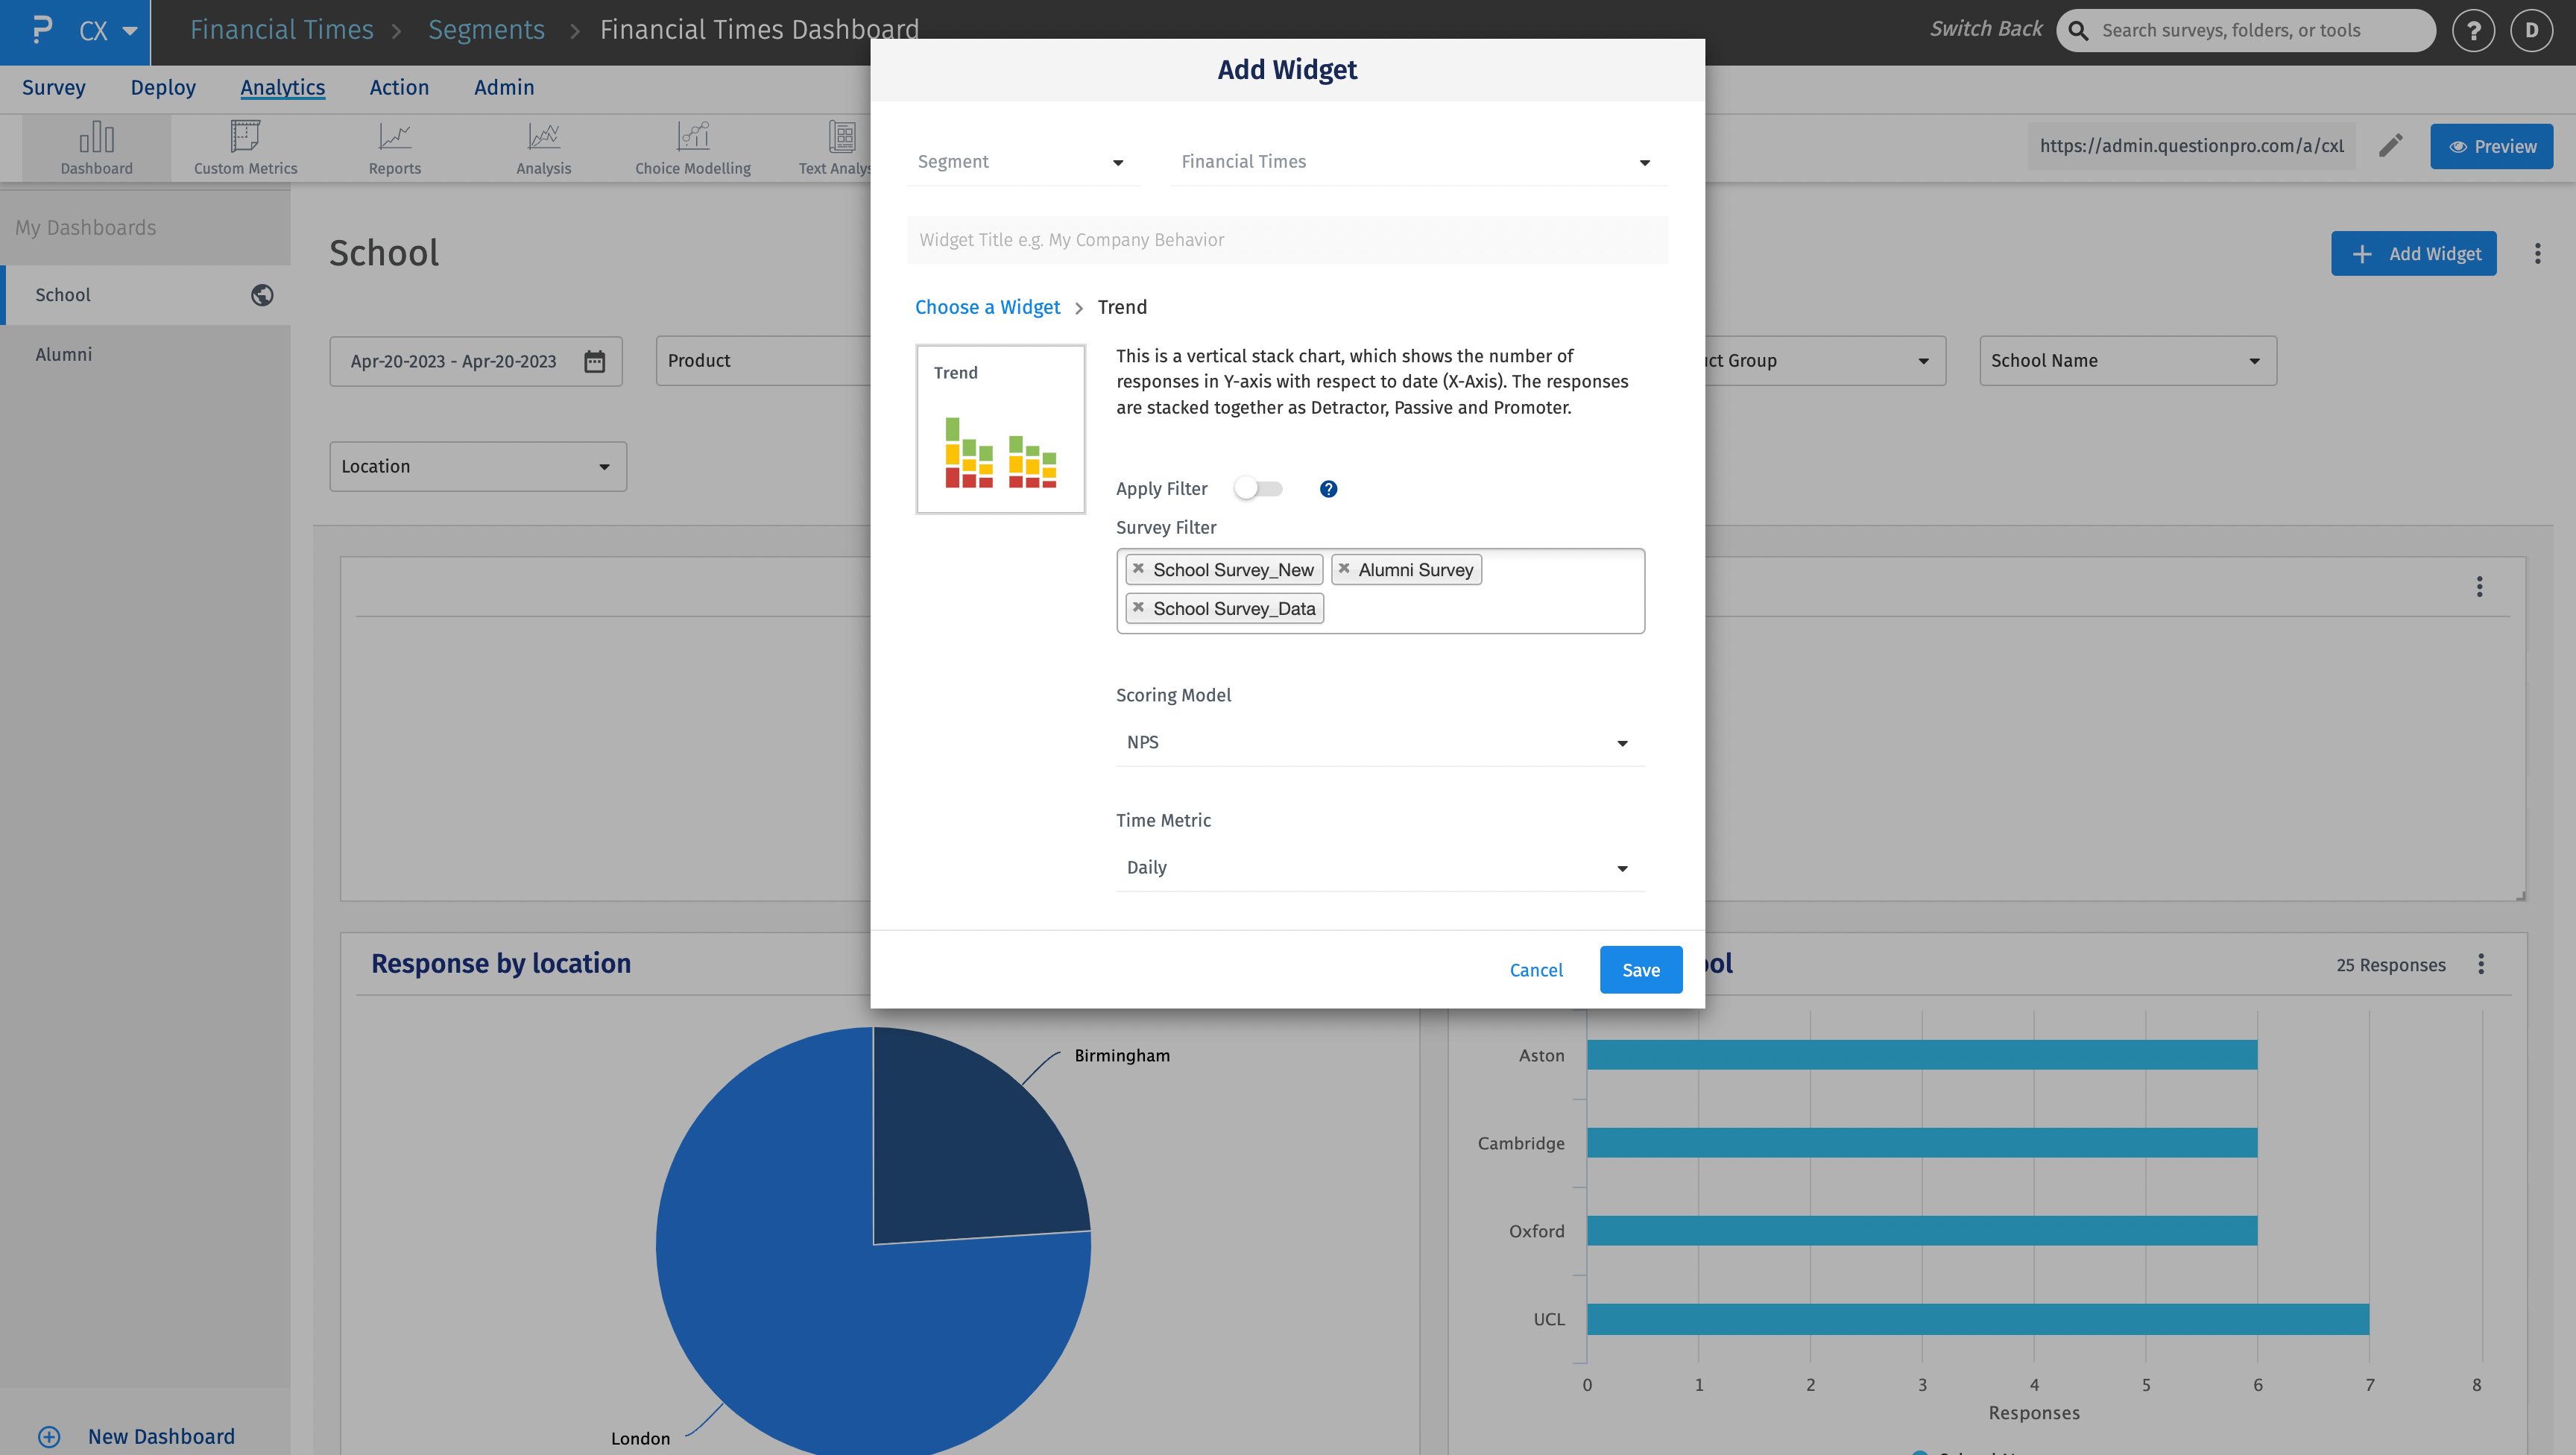
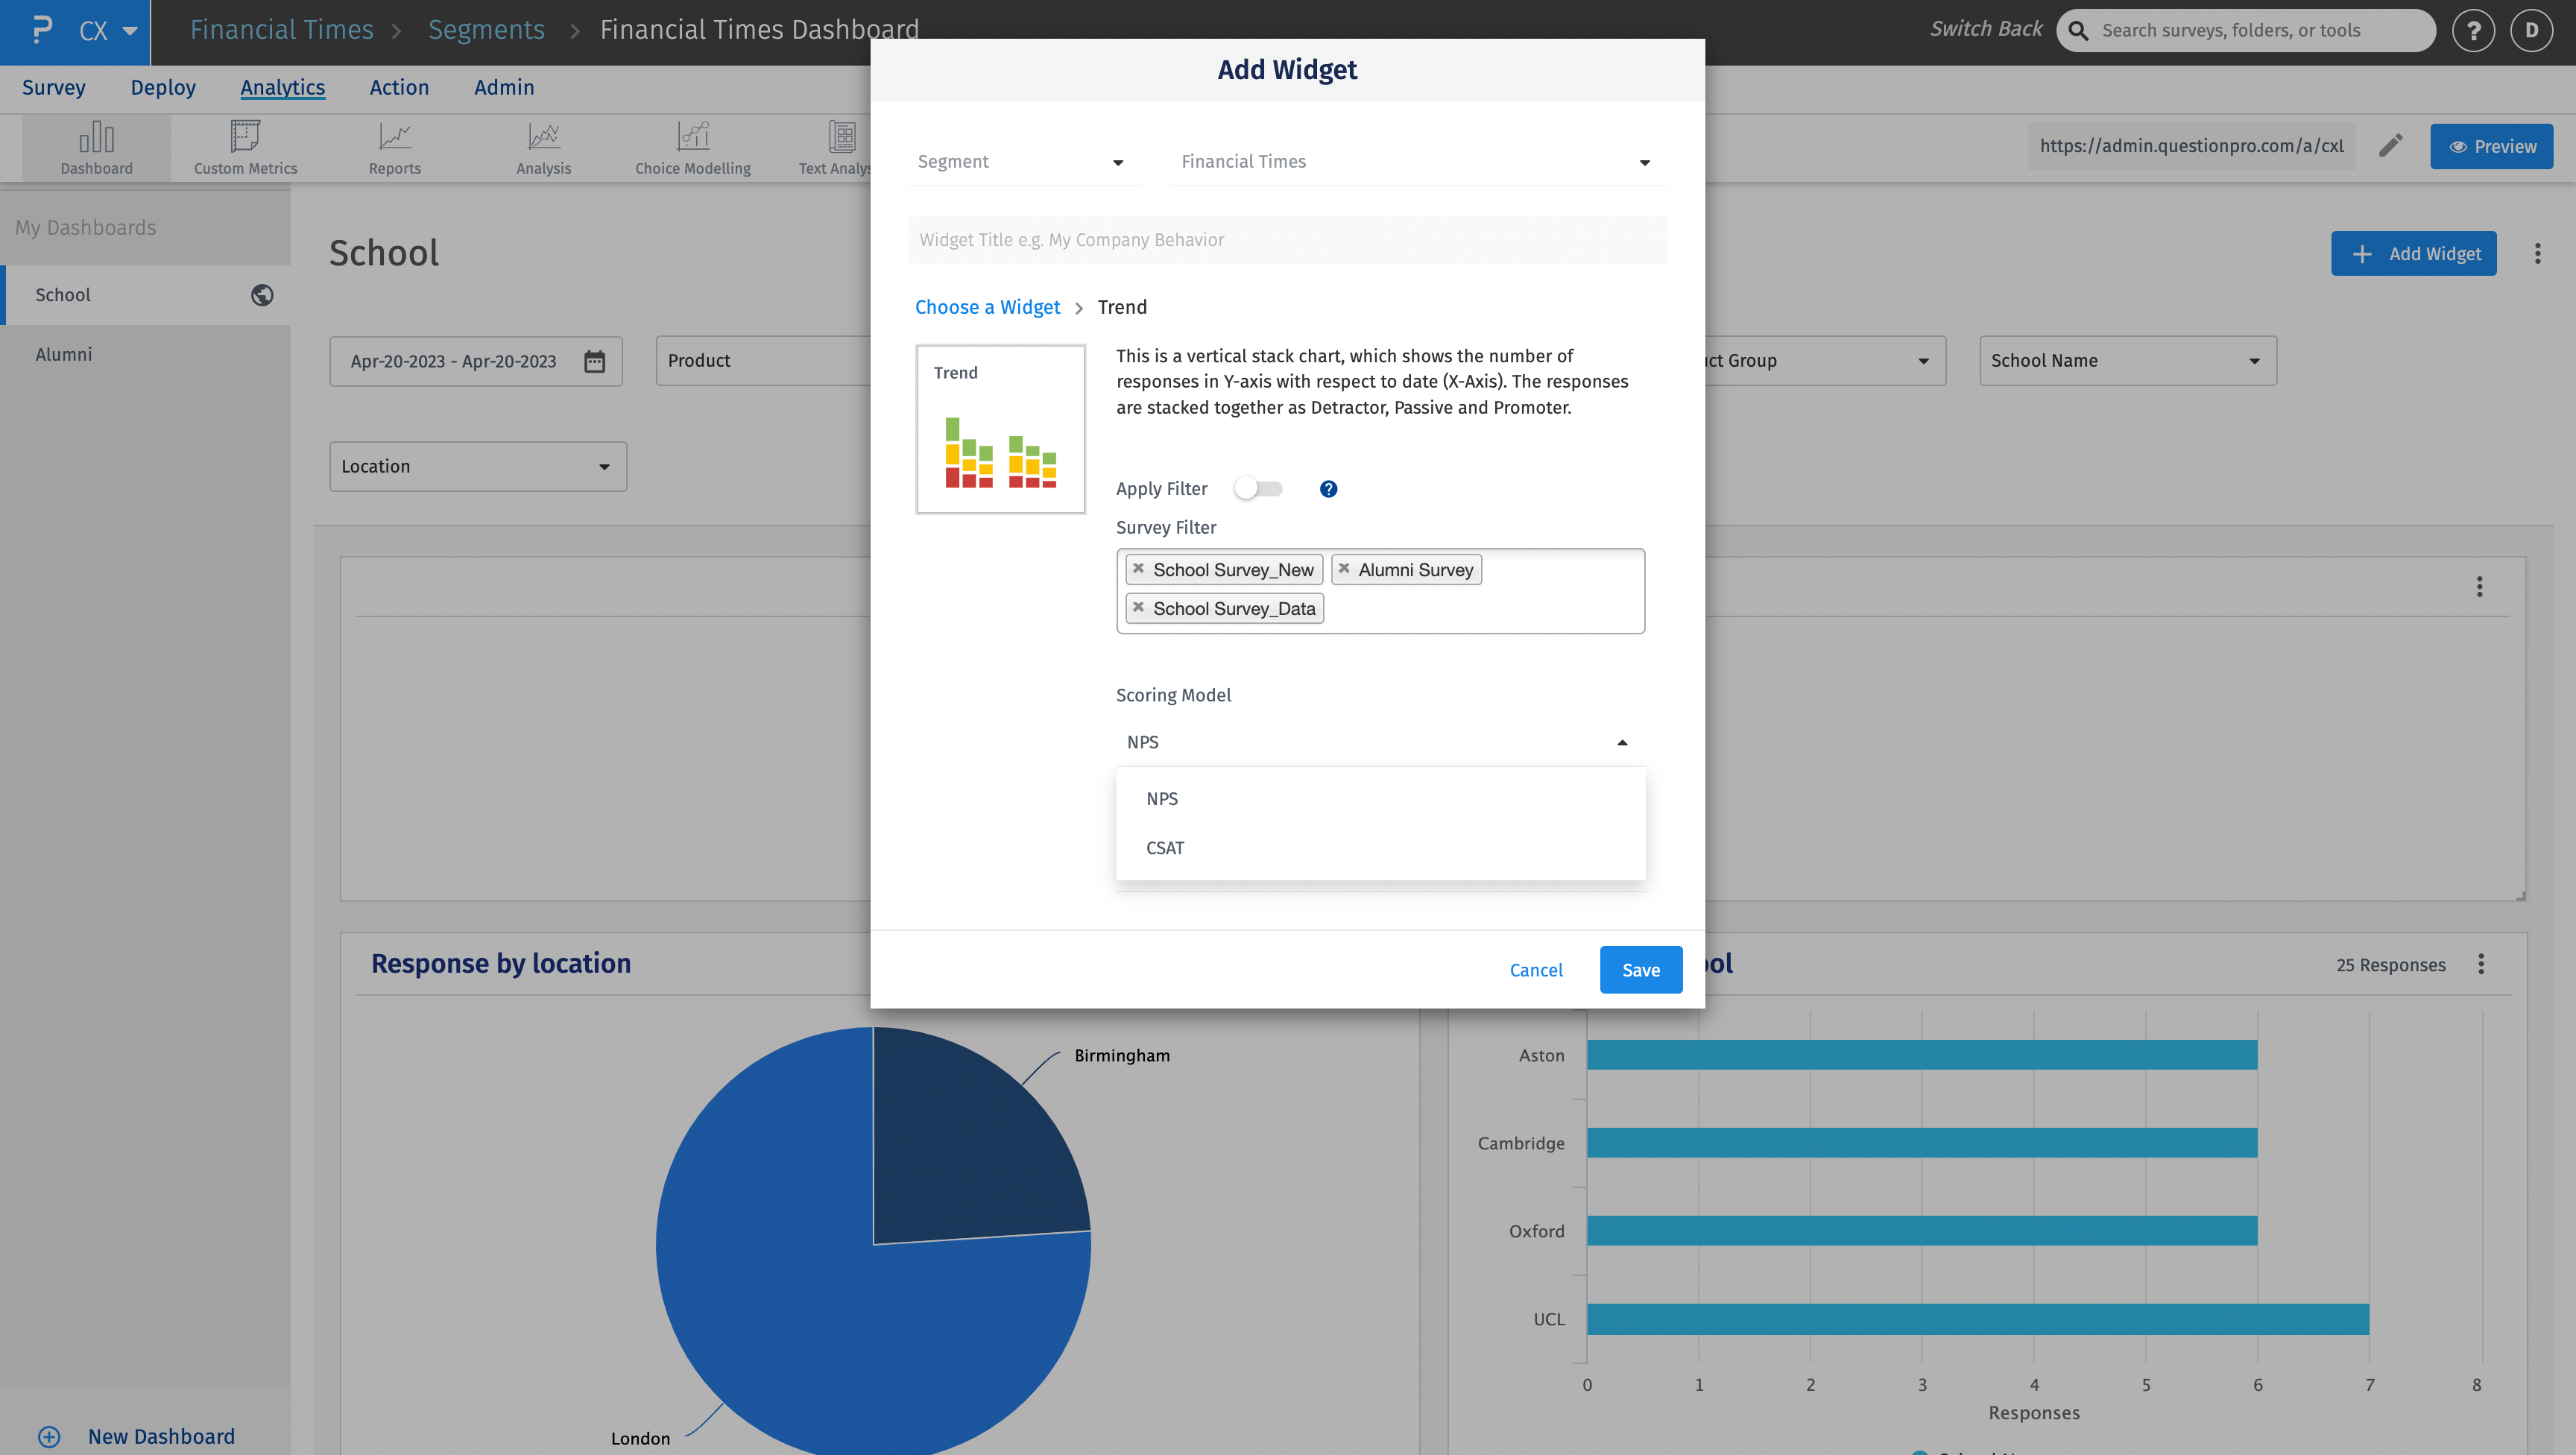
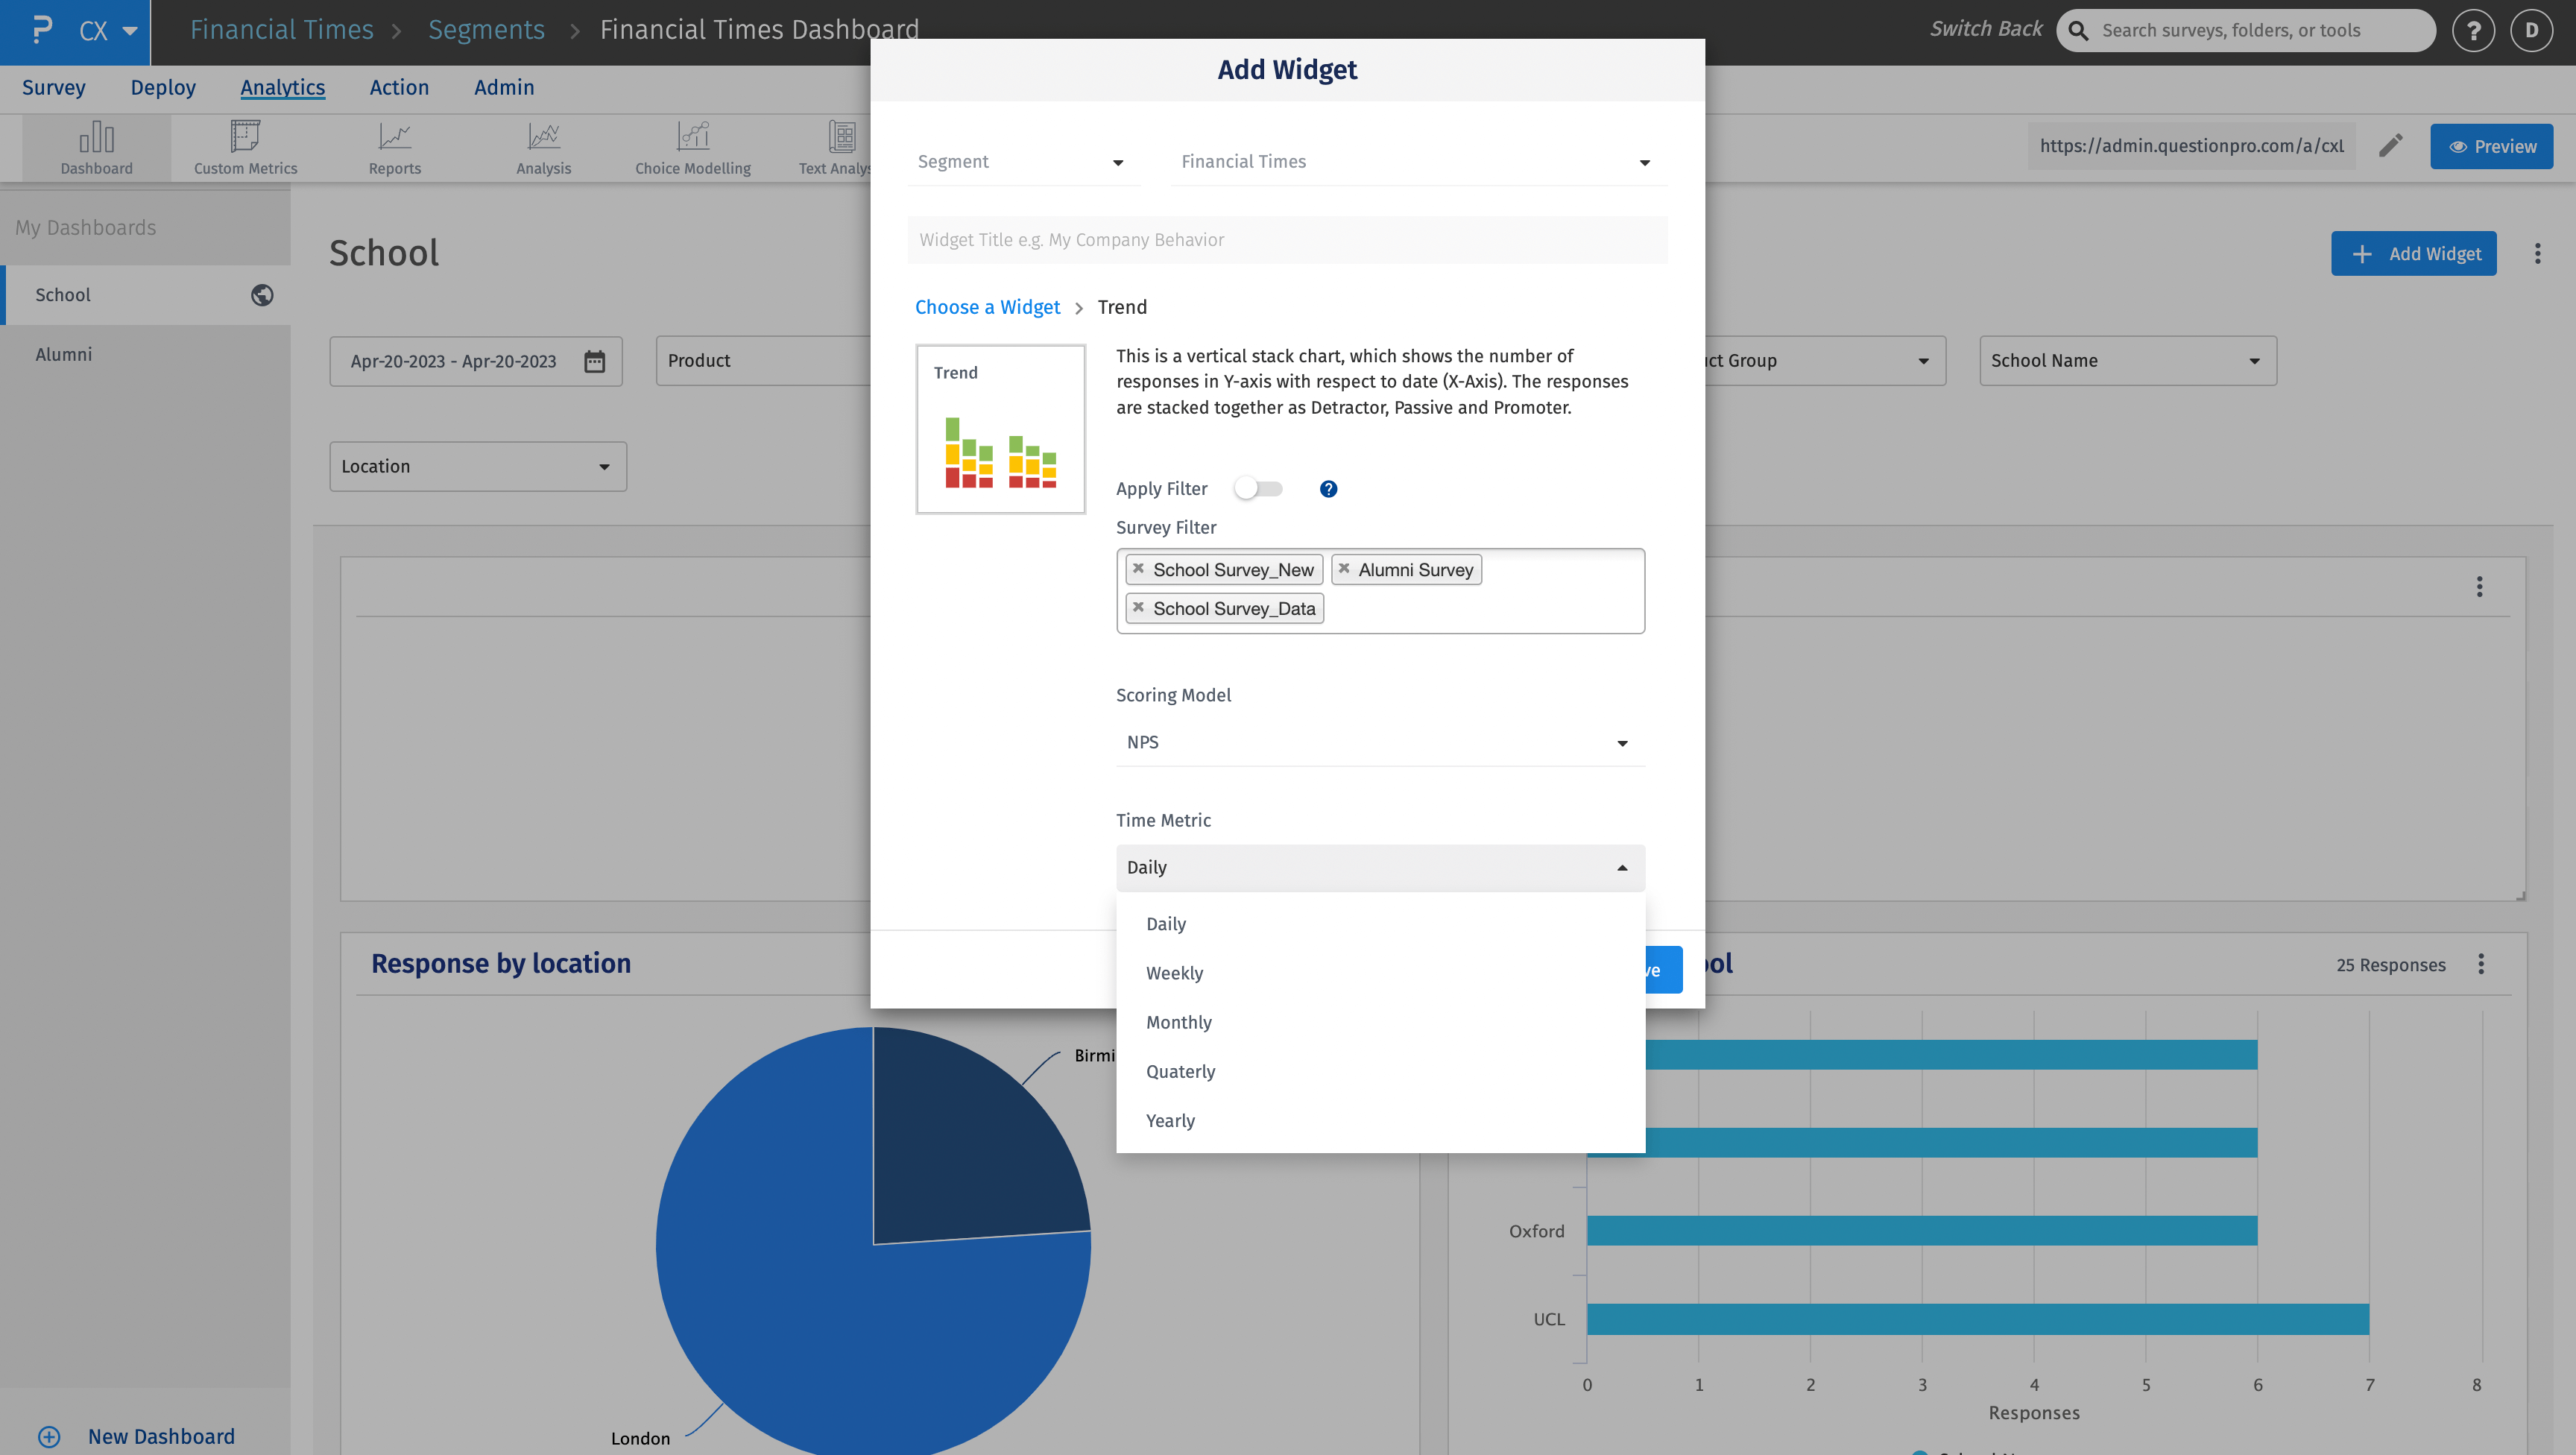
- Click on Add widget button. You can select the scoring model and the time metric. Scoring model can be either NPS or CSAT. The time metric can be Daily, Weekly, Monthly, Quartely and Yearly.
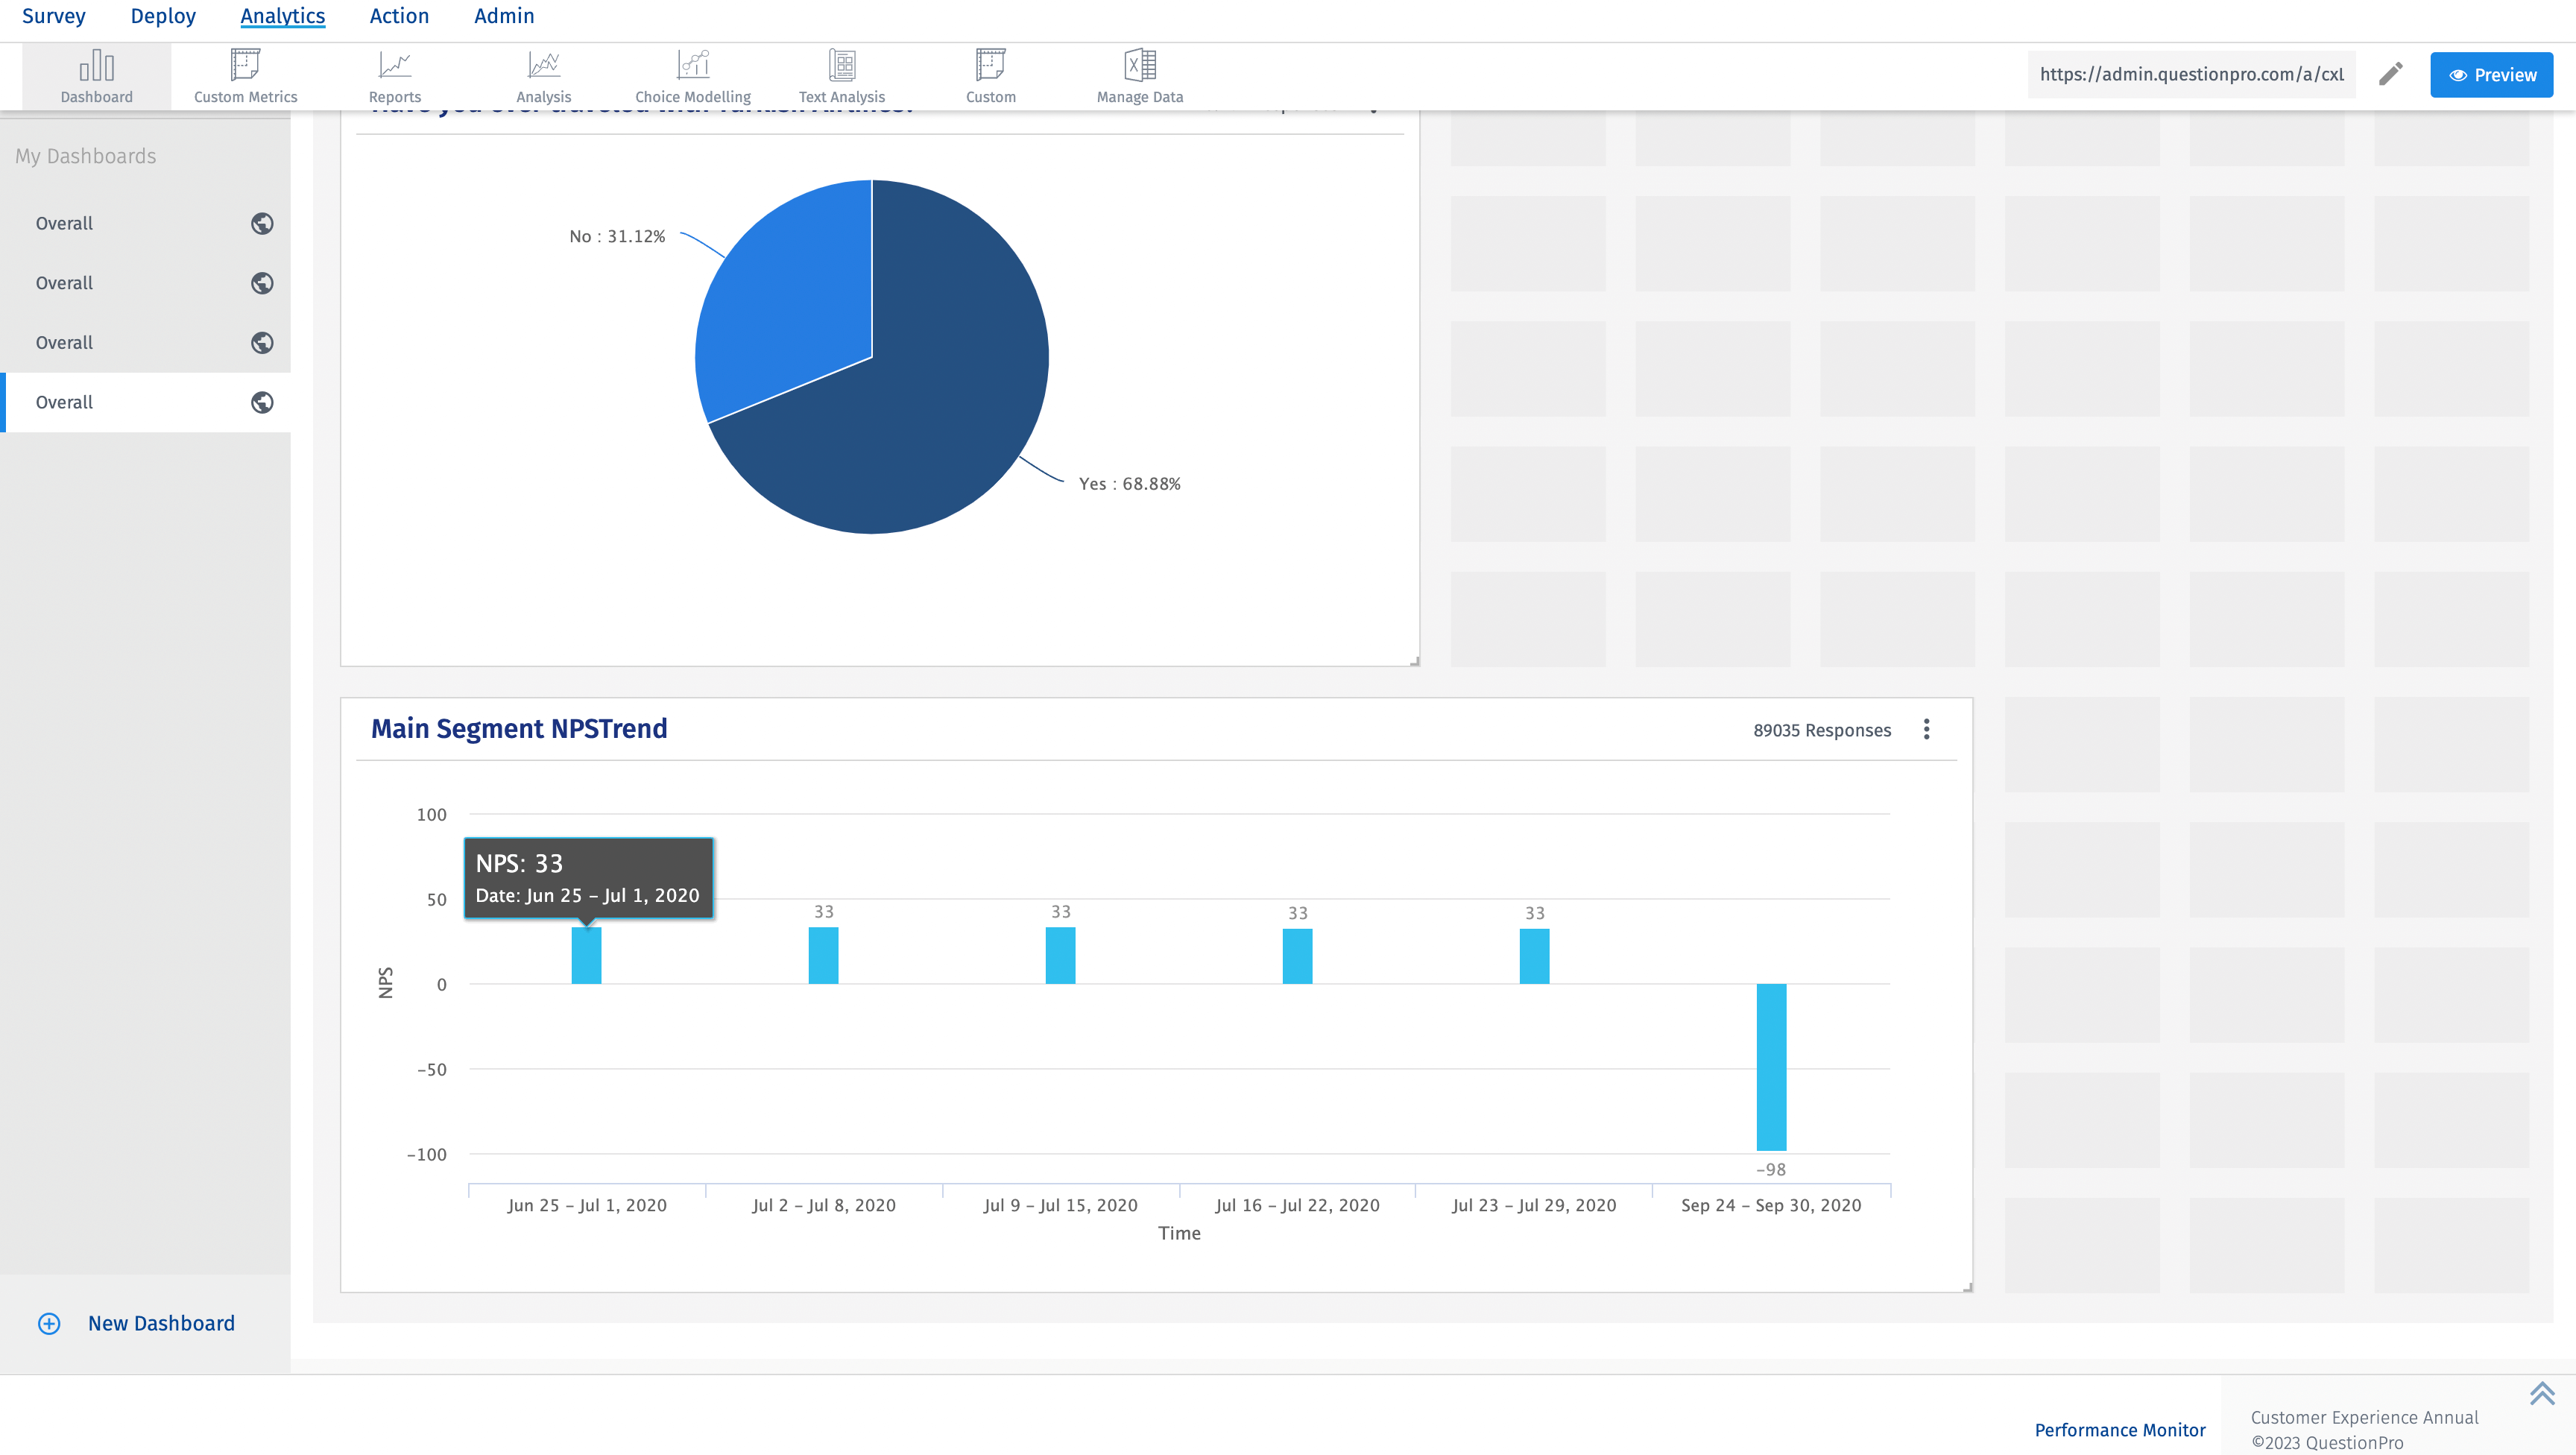
- The trend widget will be added in the dashboard.


You may also be interested in...

