

- Custom Variable Widget
- Priority Matrix
- Heatmap Widget
- Grid Widget
- Weighted mean widget
- Comment List widget
- Widget Filters
- Ranking List Widget
- Distribution Chart
- NPS Widget
- Trend Widget
- Word Cloud Widget
- Cross tab widget
- KPI Comparison Widget
- Bubble chart
- Custom Metric Trend Chart
- Trend Comparison Widget

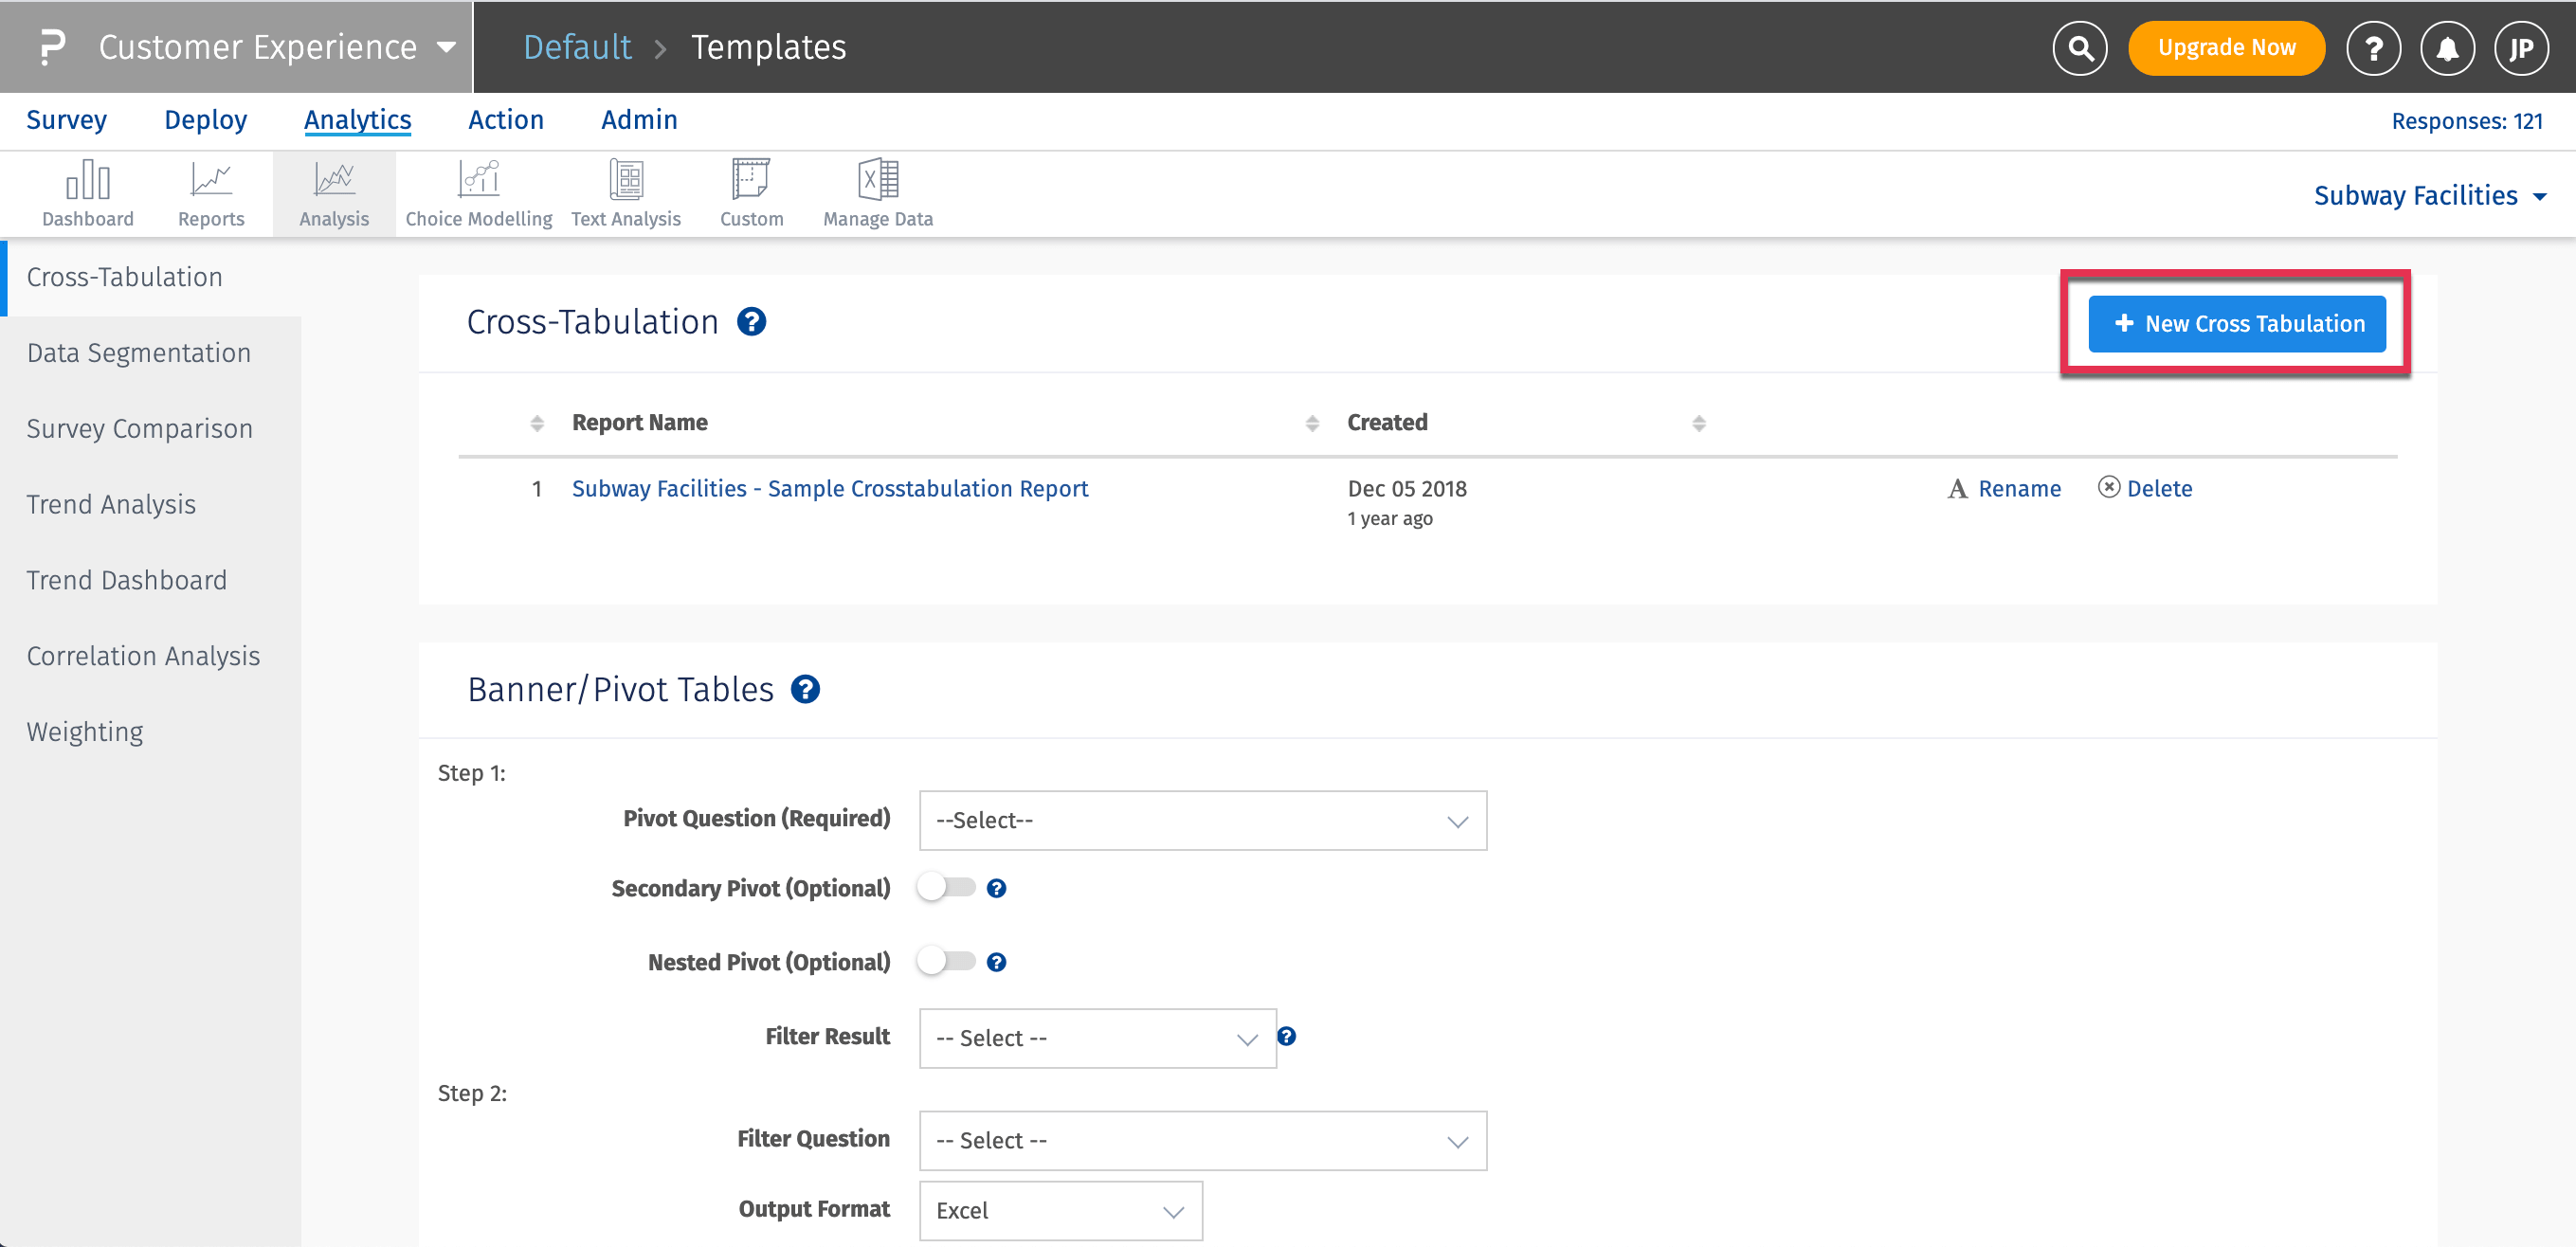
CX- Cross-tab Reports
The cross-tabulation tool allows you to measure the interaction between two questions (variables). The table will only show respondents that answered both of the questions, meaning the frequencies shown may differ from a standard frequency table. The cross-tab report will also show Pearson’s Chi-Square Statistics, which shows the level of correlation between the variables using the chi-square, p-value, and degrees of freedom.
- Login >> Customer Experience >> Analytics >> Analysis
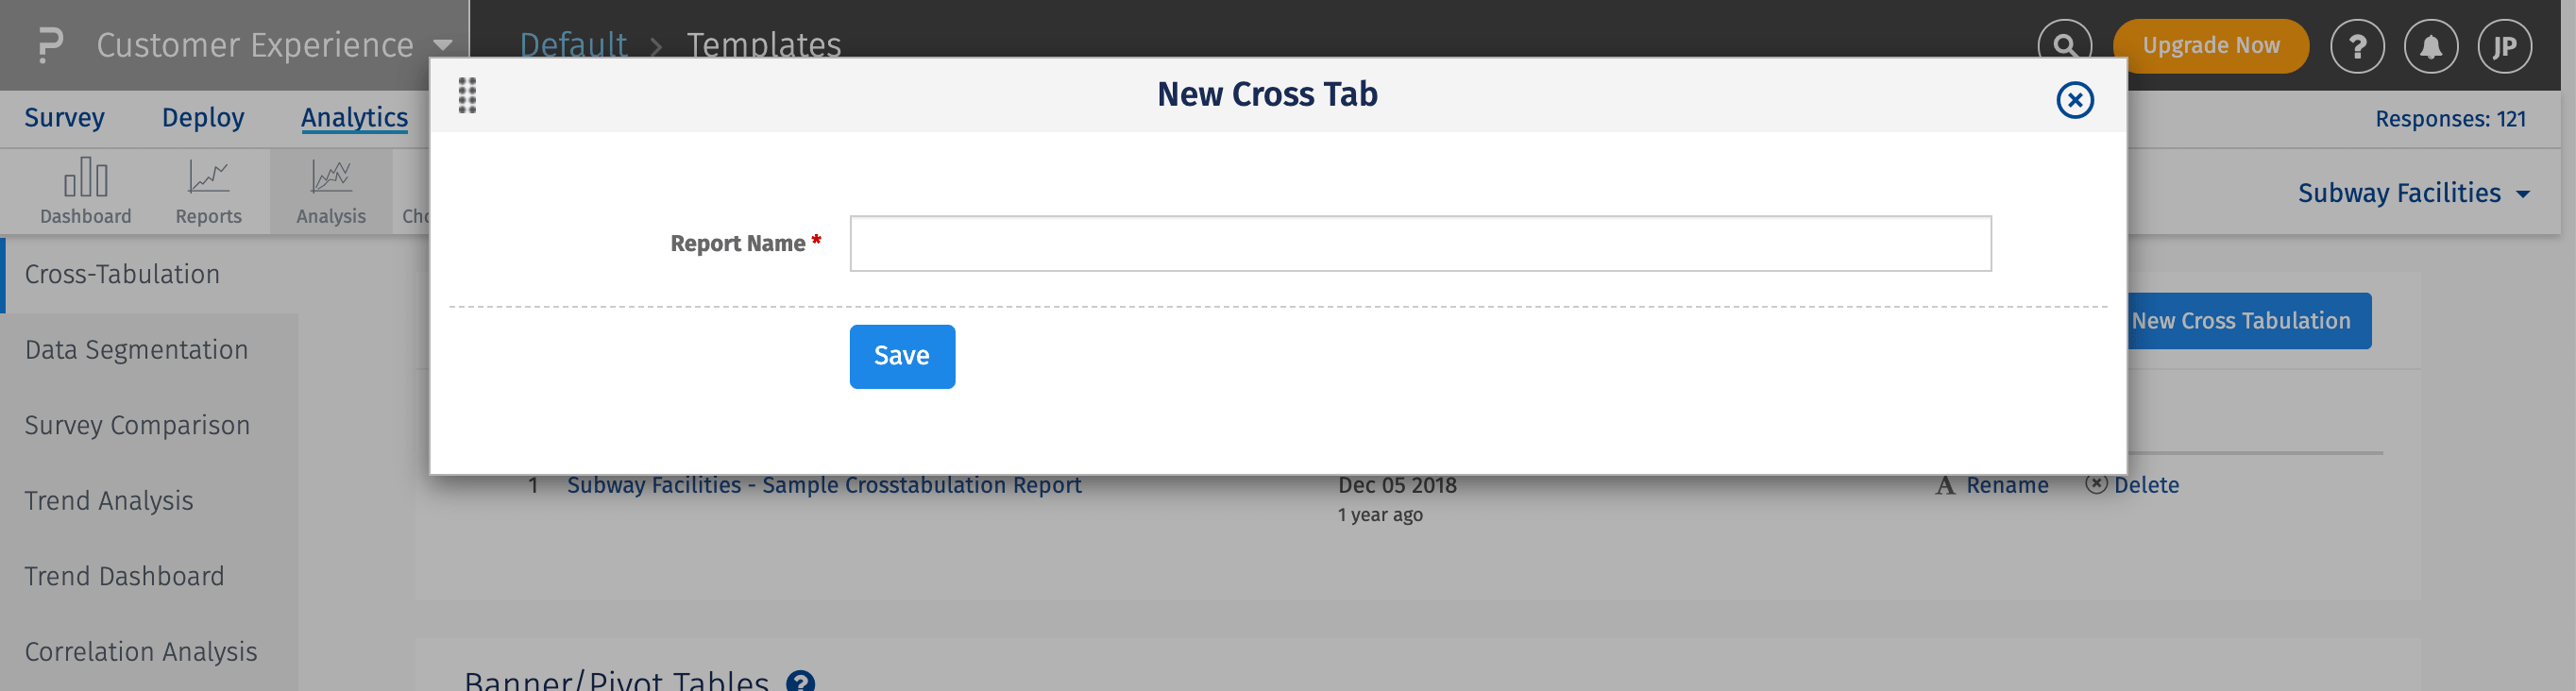
- Select a row question and a column question from the respective dropdowns.
- The cross-tab table will be generated, along with Pearson’s Chi-Square Statistics and a Significant Cells for both questions.

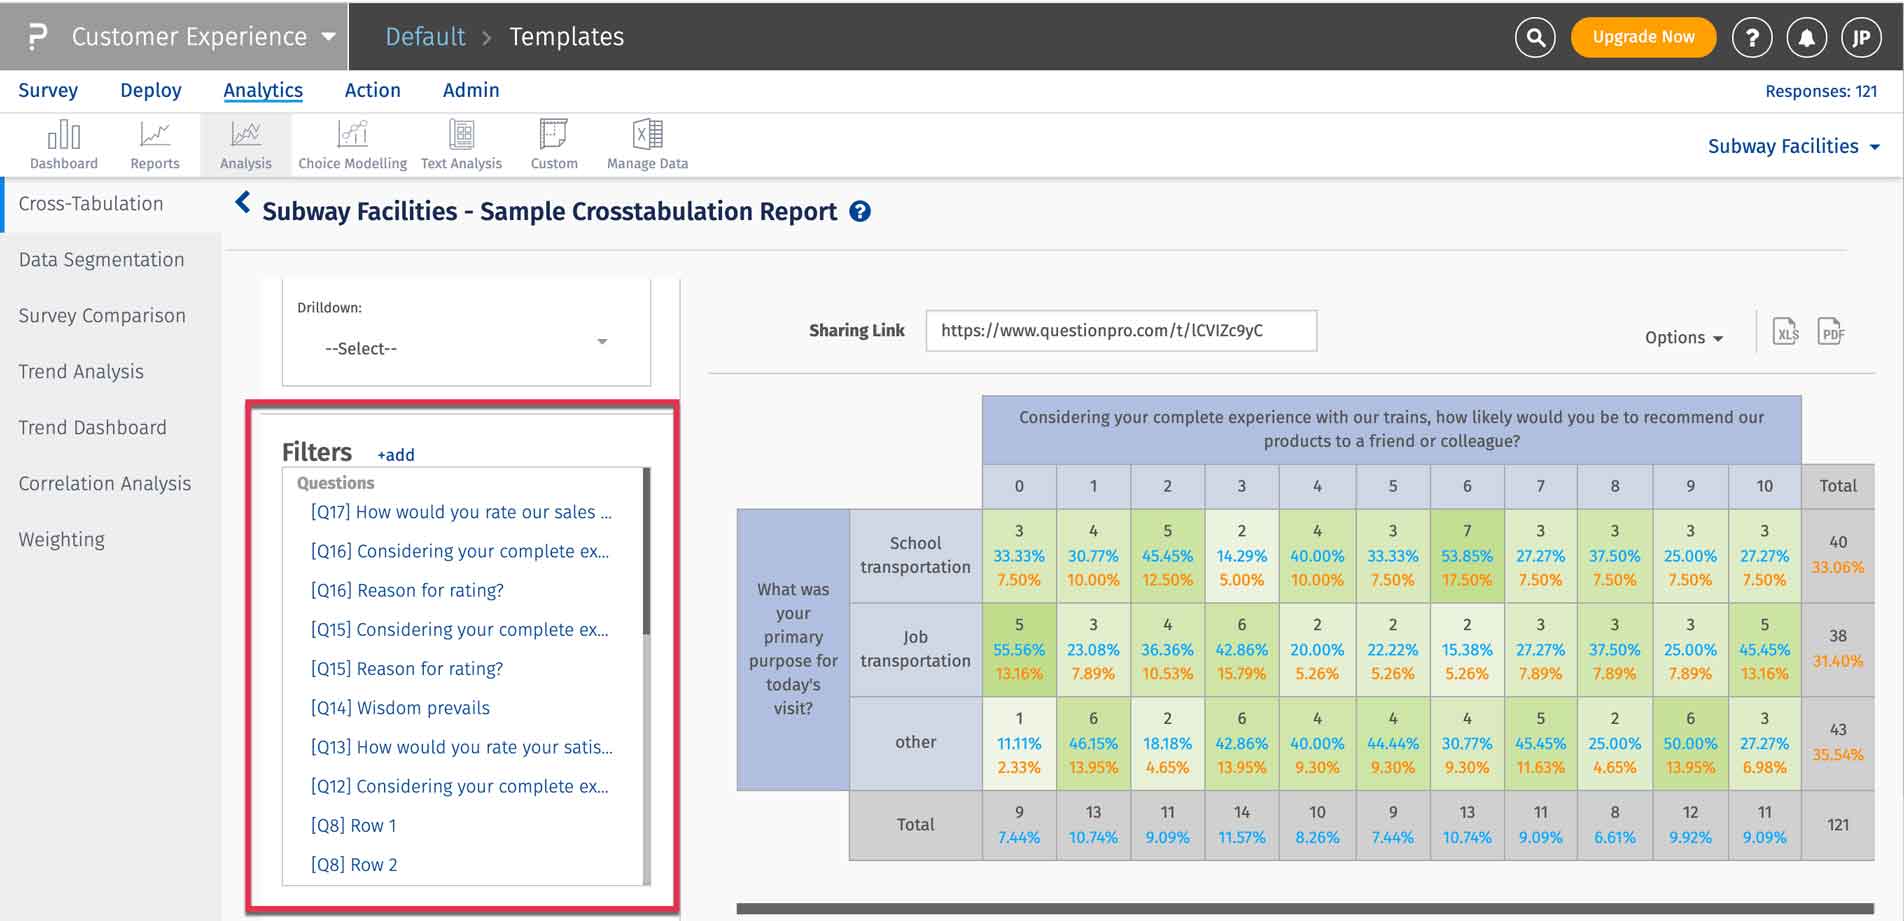
Can I filter the data that will be used to generate the report?
Yes, you can filter the data based on the following:
- Responses to Questions
- System Variables
Can I share the report?
Yes, you can share the report using the sharing link.
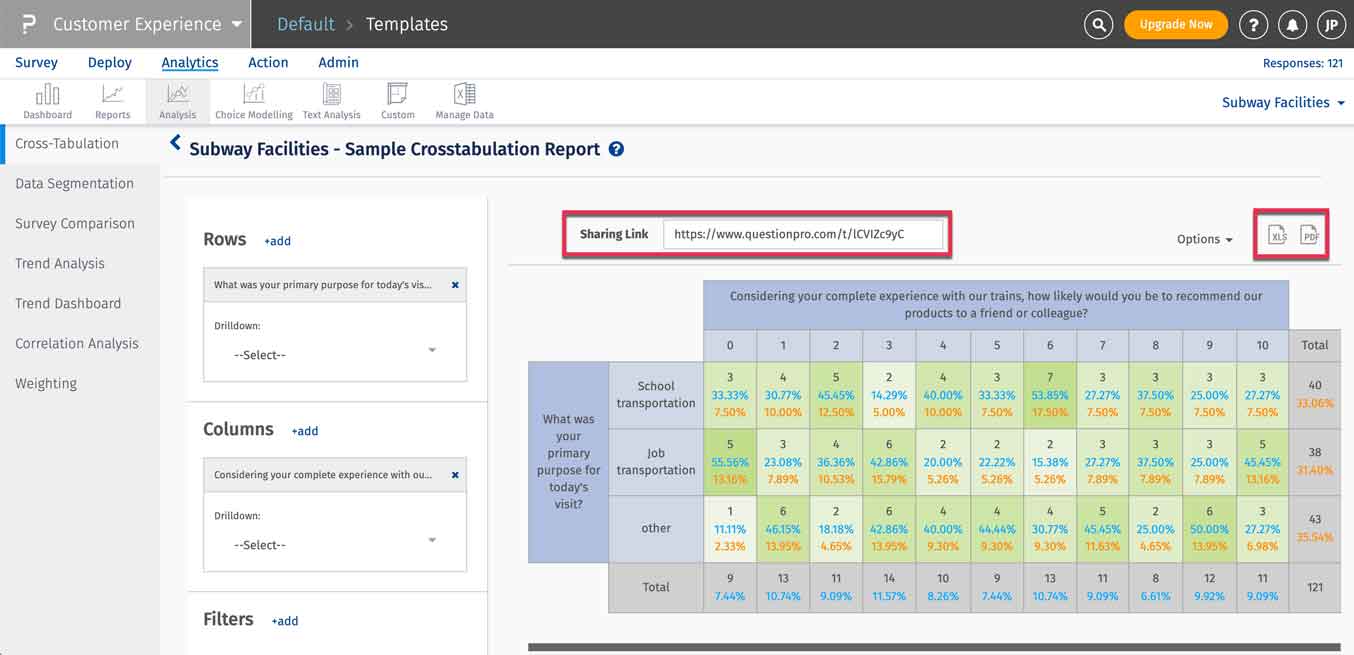
Can I download the report?
Yes, you can download the report in the following formats:
- Excel
What are row and column percentages?
- Row Percents: The percent of the row total that each cell represents.
- Column Percents: The percent of the column total that each cell represents.
Row Percentage = (Cell frequency/Row Total)*100
= 37/269
=13.75%
Column Percentage = (Cell frequency/Column Total)*100
= 37/37
= 100%
License & Access Options
This feature/tools described here are available with the following license(s) :
You may also be interested in...
Banner/pivot tables
Cross Tabulation - Significant Cells
Cross Tabulation - Pearson’s Chi-Square Test